Choose a calculation layout with a labeled header and notes strip. Add your own axis units, then work through the fictional data and density exercise.
Choose US Letter or A4, then download the PDF for printing or the SVG for editing. Keep the student worksheet separate from its answer or reference completion. All files, including the answers, are free without signup.
Choose your paper and download
Download paper size
Every worksheet and answer is free. No signup.
Free original resource
Engineering paper: 5 squares per inch
Original blank printable. Choose Letter or A4; print at actual size.
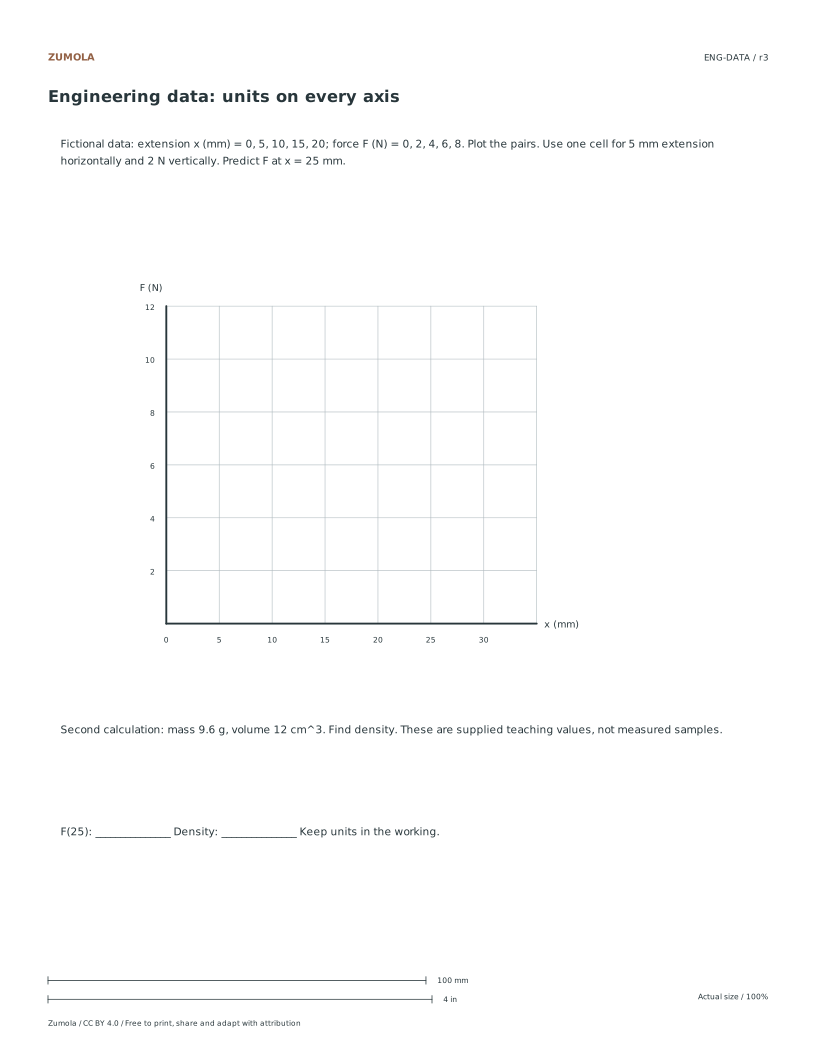
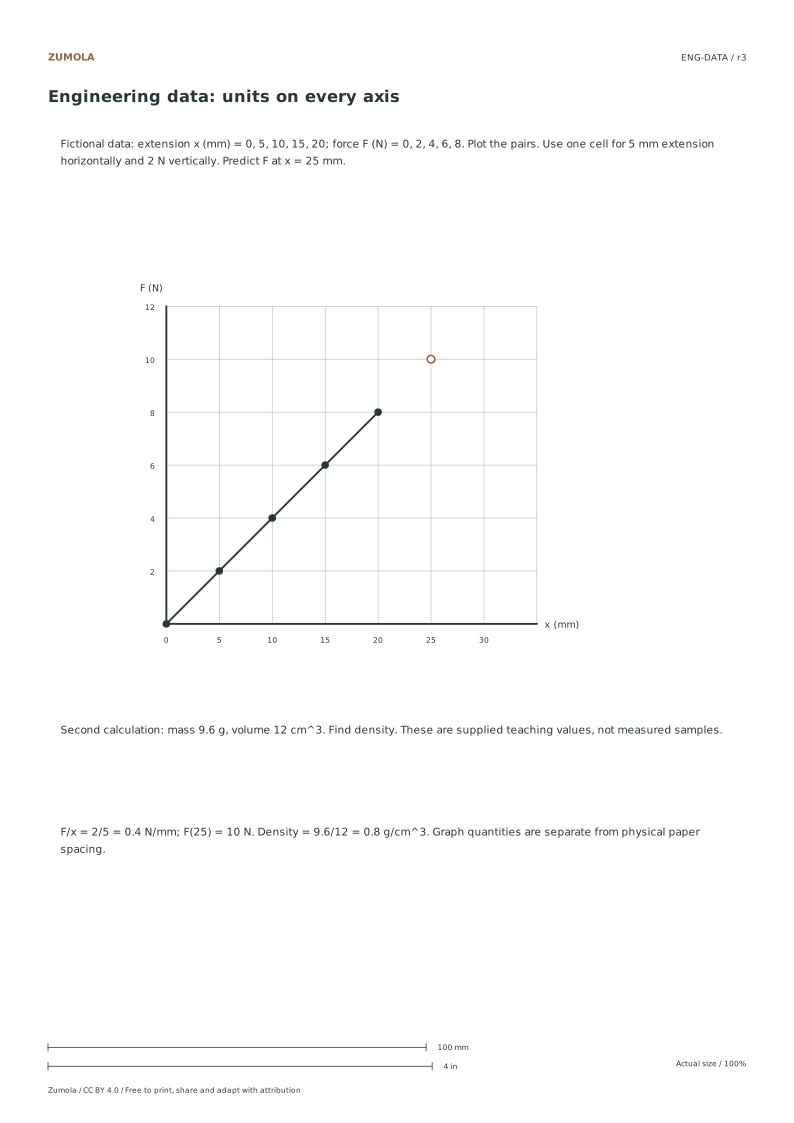
The fictional force increases by 2 N for each 5 mm extension. The slope is 0.4 N/mm; extending the stated linear pattern predicts 10 N at 25 mm. This is an arithmetic model in a worksheet, not a measured material law.
A separate calculation gives mass 9.6 g and volume 12 cm³. Density = mass / volume = 9.6 / 12 = 0.8 g/cm³. Keep the cubic unit in the denominator. Use the notes space to show the substitution and result.
Free original resourceENG-DATA
Engineering data and units
Original practice with a separate reference answer. Choose Letter or A4.
These print the grid on the front as ordinary vector lines. They are calculation sheets, not a claim to reproduce translucent commercial engineering pads with reverse-side printing. Use a pencil for working and a darker mark for the final result, and write the scale before plotting on a fresh blank sheet.
Work through the page
Selecting the Correct Grid Variant
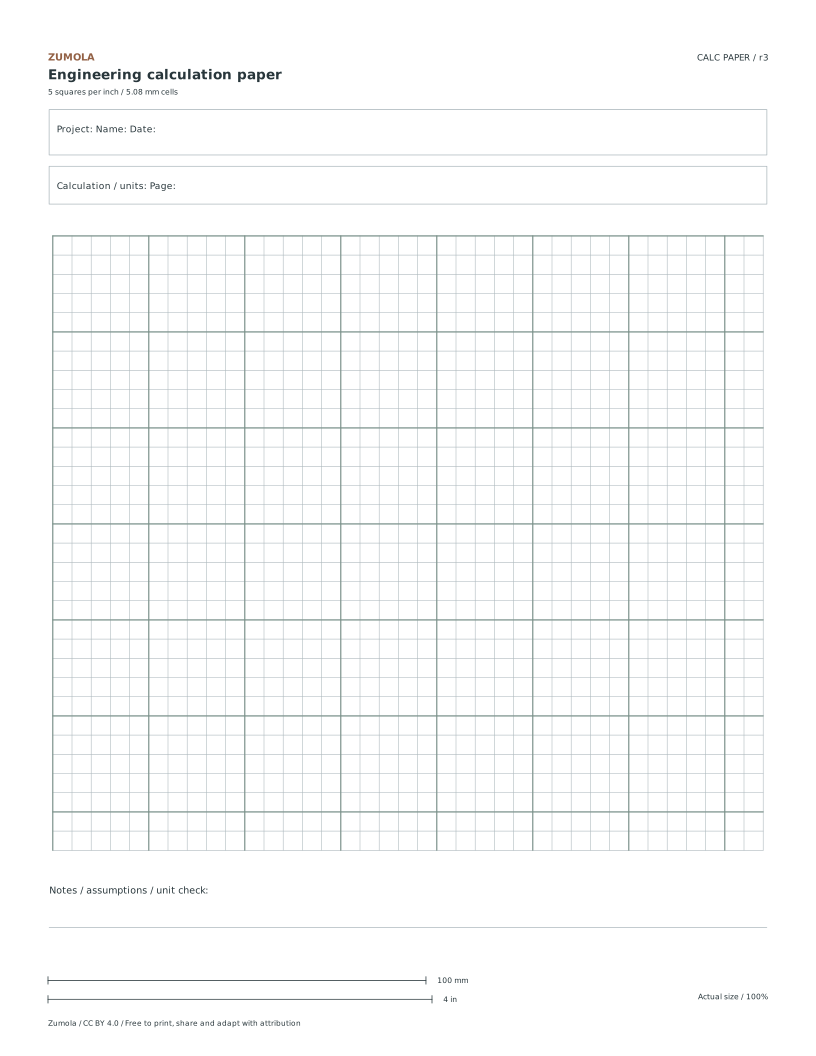
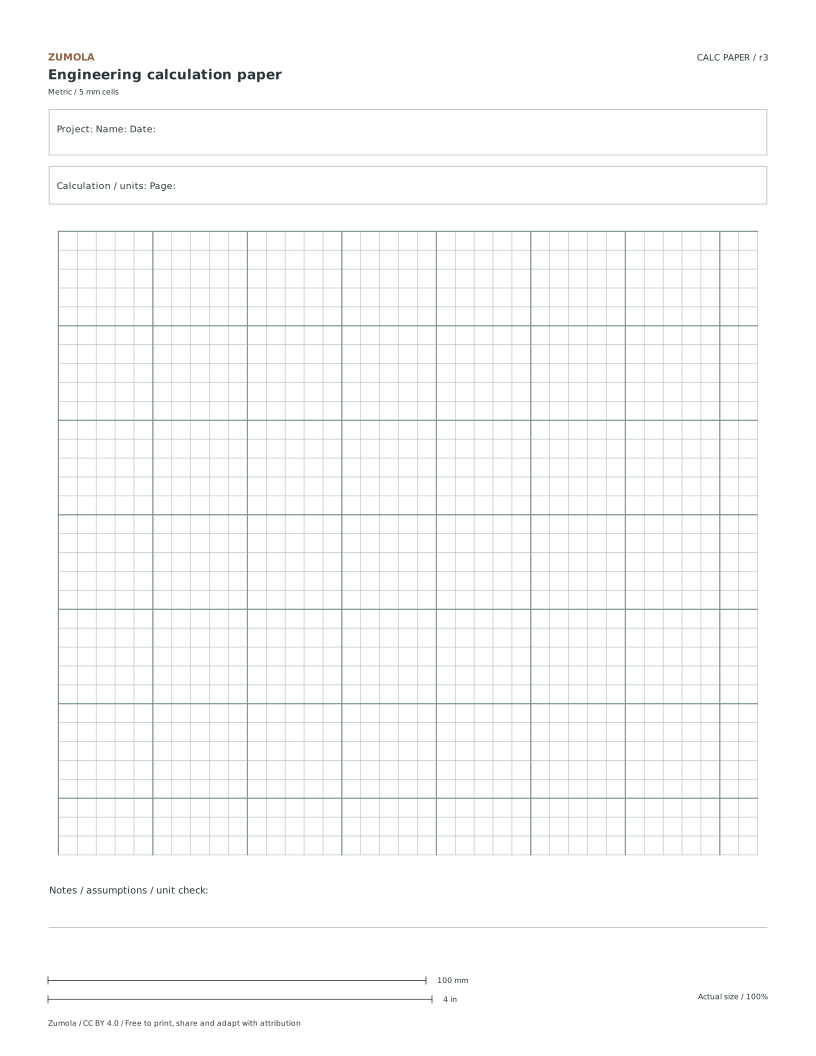
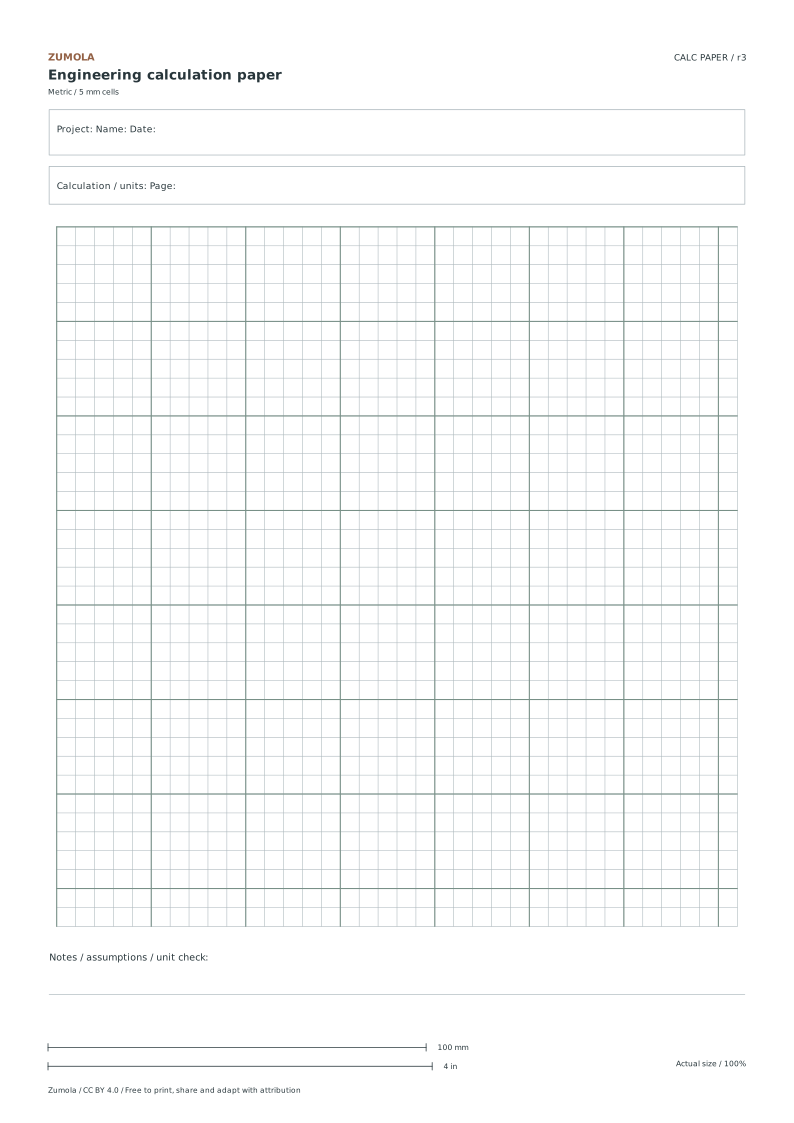
Choose physical paper spacing independently from your data units. The five-squares-per-inch paper has 5.08 mm cells and a heavier line every 25.4 mm. The metric version has 5 mm cells with a heavier line every 25 mm. Either can hold a plot in millimeters, seconds, newtons or another labeled quantity. Both layouts include Project, Name, Date and Page fields plus a notes strip. Pick the version that is convenient for your ruler or class, and state the axis scale explicitly instead of assuming that a physical paper square defines the measured quantity.
Mapping Data to Grid Cells
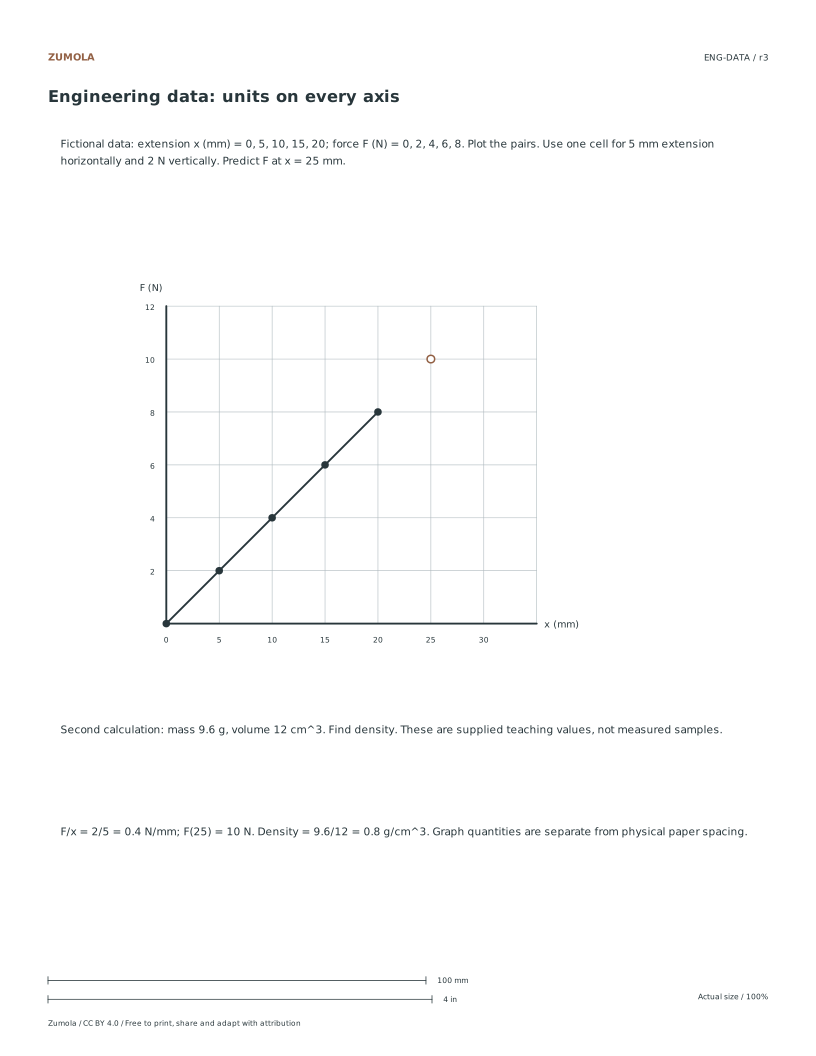
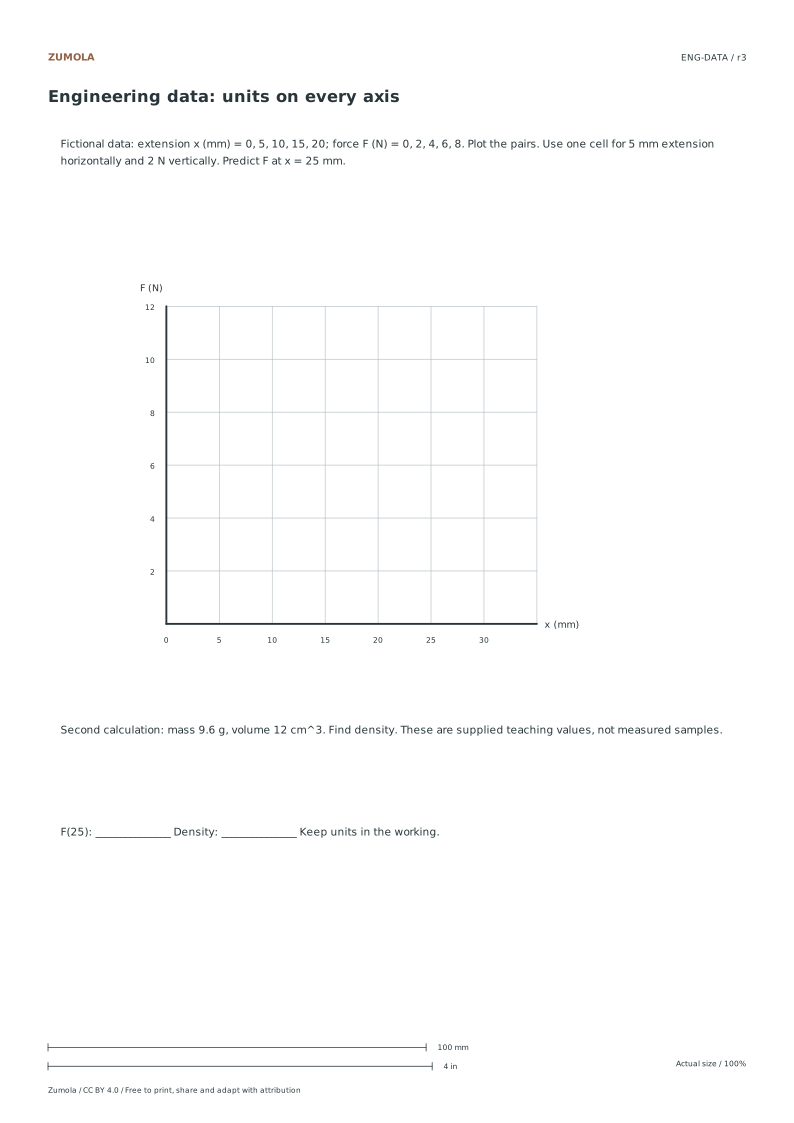
The separate data worksheet provides its own larger plotting plane with 14 mm cells for readable labels. On that chart, one horizontal cell represents 5 mm of extension and one vertical cell represents 2 N of force. Plot the five fictional data pairs, then extend the linear pattern to x = 25 mm. The slope is 2 N / 5 mm = 0.4 N/mm, so F = 0.4x gives 10 N at that point. The 14 mm physical chart spacing does not change those data units. On blank engineering paper, select a new cell-to-data mapping and label it before plotting.
Verifying Density Calculations
Use the worksheet to practice arithmetic and data layout by calculating density from given mass and volume values. Divide the mass of 9.6 grams by the volume of 12 cubic centimeters to derive a density of 0.8 grams per cubic centimeter. This exercise focuses on correct numerical handling and spatial organization rather than physical measurement validation. The worked answer serves as a reference for checking arithmetic precision. Ensure that units are clearly labeled in the header or notes area to maintain clarity. This task reinforces the importance of consistent unit usage and accurate division in engineering contexts, providing a structured environment for practicing fundamental calculation skills without relying on external measurement tools.
Small checks that catch common errors
Watch for
Check instead
Confusing the physical grid spacing with the data axis scale when plotting points.
Remember that one horizontal cell represents five millimeters of extension and one vertical cell represents two Newtons of force, distinct from the physical cell dimensions.
Assuming metric paper can only show metric quantities.
Either physical grid can show any stated units. Label both axes and record the quantity represented by each interval.
Treating the density calculation as a validated engineering design measurement.
Recognize that the mass and volume values are fictional data for an arithmetic exercise, not results from real-world physical measurements.
Print a test sheet before a full pack
Use the PDF that matches the paper loaded in your printer. Choose Actual size / 100% and turn off Fit, Shrink and browser headers. The SVG keeps millimeter dimensions, but an editor or browser can rescale it; the PDF is the simpler print path. Measure any calibration bars with a separate physical ruler when the exercise depends on printed size. A screen preview does not establish physical scale.
Packs combine the same individual pages; they are not extra different exercises. Print a student copy first and keep references nearby for review. Letter and A4 preserve the stated grid spacing or model definition while their surrounding white space can differ. Color is optional: the references also use line position, text or relative lightness to explain the result.
Useful answers
What file formats are available for the printable resource?
The resource is available in PDF and SVG formats, compatible with both Letter and A4 paper sizes for flexible printing options.
How many major interval lines appear on the grid?
Major interval lines appear every five cells in both the imperial and metric variants, helping to visually group data points for easier reading.
What information should be entered in the header fields?
Use the Project, Name, Date and Page fields for your calculation record. Put assumptions, conversions and the meaning of each plotted interval in the notes strip.
Are the answers and editable files free too?
Yes. Every linked PDF, SVG, worksheet and answer is free without signup. The original Zumola resources use CC BY 4.0: credit Zumola, link the license and indicate changes. Analytics consent is not required to download or use them.
Further reading: NIST: exact inch conversion. The downloadable diagrams and exercises are original Zumola work.
Your analytics choice
Optional Google Analytics helps us understand which free resources are useful. It is off until you allow it. Drawing tools and downloads work with either choice. Privacy details