HomeCeratosaurus Scale Drawing: Plan a Cutout with a Scale Bar Free original lessons
Ceratosaurus Scale Drawing: Plan a Cutout with a Scale Bar
Learn to scale a Ceratosaurus outline for a cutout using a scale bar, grid transfer, and simple arithmetic checks. Includes practice tasks and a rubric.
Free lesson
Four exercises
Worked answers
Object Drawing Lessons
This lesson teaches a reliable method for drawing a Ceratosaurus to scale as a cutout. You will set a scale bar, transfer an outline by grid, and verify proportions with simple measurements. The convention is explicit: x-height is measured from baseline to midline, and letter styles may vary. All numerical values below are hypothetical examples unless you measure your own equipment. The planned printable outline, scale bar, cut lines, and blank panel are described in the resource plan but are not yet built.
Practice materials: Printable downloads are not available for this lesson yet. Use the instructions and four exercises below.
Reference illustration
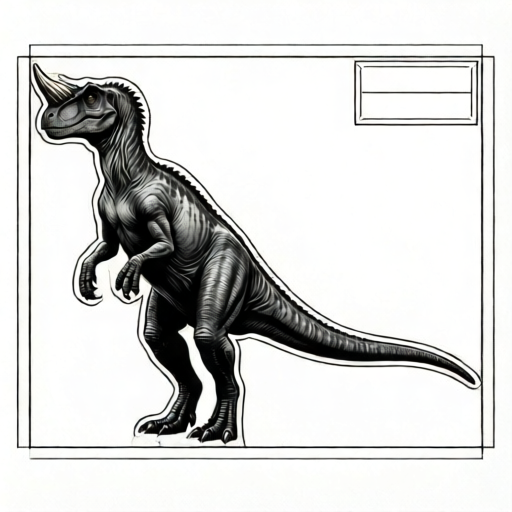
Use the stated measurements and conventions for each exercise.
Set the scale before drawing
A scale drawing is only useful if the scale is stated and checkable. Decide a real-world length for the cutout, then choose a drawing length that fits your paper. For example, a hypothetical cutout length of 60 cm drawn at 1:10 becomes 6 cm on paper. Write the ratio beside the drawing so anyone can verify it.
Use a scale bar rather than a single number. A scale bar shows equal divisions, such as 0, 2, 4, 6 cm, so a reader can compare the drawing directly. Measure the actual paper and printer output with a ruler; do not assume a tolerance.
- Choose the real cutout length and the paper length; record both in the same unit.
- Compute the scale ratio as paper length divided by real length.
- Draw a scale bar with equal divisions and label the units.
- Measure the printed scale bar with a ruler and correct the ratio if needed.
Transfer the outline by grid
A grid transfer keeps the Ceratosaurus outline proportional. Place a grid over the reference outline and an identical grid on the blank panel. Count squares from a fixed reference point, such as the tip of the snout, to each outline point. Mark points, then connect them with smooth curves.
Keep the body axis horizontal and mark the tail, hips, shoulders, and head before adding details. The cut line should follow the outline with a small margin; measure that margin on your own equipment and label it as a chosen value.
- Draw equal grid squares on the reference and the blank panel.
- Mark the snout tip as the origin and record square counts to key points.
- Plot the same counts on the blank panel and connect the points.
- Add a cut margin and label it with the measured value.
Check proportions with arithmetic
Simple ratios catch scaling errors. If the real body length is 60 cm and the drawn length is 6 cm, the scale is 1:10. A drawn head length of 1.2 cm then represents 12 cm in reality. Check that each measured segment times the scale factor equals the intended real length.
Use consistent units throughout. Convert all measurements to centimetres before multiplying. If a check fails, adjust the grid count or the scale bar rather than redrawing everything.
- Measure the drawn body length and divide by the real length to confirm the ratio.
- Multiply each drawn segment by the scale factor and compare with the planned real segment.
- Record any difference and correct the grid point that caused it.
Prepare the cutout panel
The cutout needs a clear outline, a scale bar, and a label stating the ratio. Leave a blank panel for an independent scaled drawing so the method can be repeated without the reference. Cut lines should be distinct from construction lines; use a consistent line convention and state it.
Because letter styles vary, label the scale bar and ratio in any legible style. The x-height convention is baseline to midline, so keep labels large enough to read after cutting.
- Trace the final outline onto the cutout panel.
- Add the scale bar and ratio label.
- Mark the blank panel for an independent drawing.
- Check that all labels use the same units.
Worked example
A hypothetical Ceratosaurus cutout is planned at 50 cm real length. The drawing is 5 cm long. The drawn head is 1.0 cm and the drawn tail is 2.0 cm. Find the scale ratio and the real head and tail lengths.
Worked answer
Scale ratio = 5 cm divided by 50 cm = 1:10. Real head = 1.0 cm times 10 = 10 cm. Real tail = 2.0 cm times 10 = 20 cm. Check: 10 cm plus 20 cm is less than 50 cm, leaving 20 cm for the body, which is consistent with the planned total.
Four practice exercises
Exercise 1
A drawing is 8 cm long and represents a 40 cm cutout. What is the scale ratio? If the drawn hip height is 2 cm, what real height does it represent?
Show answer and check
Scale ratio = 8 divided by 40 = 1:5. Real hip height = 2 cm times 5 = 10 cm.
Why: Divide drawn length by real length to get the ratio, then multiply the drawn segment by the same factor.
Check: Multiply 10 cm by 1/5 to return to 2 cm; confirm the ratio is written as 1:5.
Exercise 2
On a grid, the snout tip is at square 0. The shoulder is 6 squares right and 2 squares up. The hip is 10 squares right and 1 square down. Describe how to plot these points on a blank panel with identical squares.
Show answer and check
Start at the snout tip on the blank panel. Count 6 squares right and 2 up for the shoulder; count 10 squares right and 1 down for the hip. Mark both points and connect them smoothly.
Why: Identical grids preserve relative positions, so the same square counts transfer the outline proportionally.
Check: Recount the squares from the snout tip to each point and confirm the directions match.
Exercise 3
A scale bar shows divisions of 0, 2, 4, 6 cm. The printed bar measures 6.2 cm with a ruler. The planned ratio is 1:10. What is the corrected ratio using the measured bar?
Show answer and check
Corrected ratio = 6.2 cm divided by 60 cm, approximately 1:9.68. Label the measured value and use it for checks.
Why: The scale bar represents 60 cm in reality because 6 cm at 1:10 equals 60 cm. The measured 6.2 cm changes the effective ratio.
Check: Divide 6.2 by 60 and compare with the labelled ratio; record the measured value beside the bar.
Exercise 4
A cutout outline has a drawn body length of 7 cm at 1:8. A cut margin of 0.5 cm is added around the outline. What real length does the margin represent, and what is the total drawn length including one margin on each end?
Show answer and check
Real margin = 0.5 cm times 8 = 4 cm. Total drawn length = 7 cm plus 0.5 cm plus 0.5 cm = 8 cm.
Why: Multiply the drawn margin by the scale factor to get the real margin. Add the margin at both ends for the total drawn length.
Check: Convert 8 cm drawn back to real length: 8 times 8 = 64 cm, which equals 56 cm body plus 8 cm total margin.
Common mistakes
- Stating a scale without a scale bar. Add a divided scale bar and label its units so the ratio can be checked directly.
- Mixing centimetres and millimetres in calculations. Convert every measurement to one unit before multiplying or dividing.
- Assuming a printed size is exact. Measure the actual printed scale bar with a ruler and correct the ratio if needed.
- Drawing details before fixing the body axis. Mark the snout, tail, hips, and shoulders first, then add details.
Self-check rubric
- Scale ratio is stated and matches the measured scale bar.
- Grid counts from the snout tip to key points are consistent.
- Body axis and key points are marked before details.
- Cut line is distinct from construction lines and has a labelled margin.
- Labels use one unit and follow the baseline-to-midline x-height convention.
- Valid alternative letter styles and outline curves are accepted if measurements check.
Questions and answers
What does x-height mean here?
X-height is the distance from the baseline to the midline of lowercase letters. Letter styles vary, so use this convention consistently when labelling.
Can I use a different scale?
Yes. Choose any ratio that fits your paper, then draw a scale bar and record the ratio beside the drawing.
How do I check a grid transfer?
Count squares from the snout tip to key points on both grids. If the counts match, the outline is proportional.
Are the numerical values fixed?
No. Values such as 60 cm and 1:10 are hypothetical examples. Measure your own paper and equipment and label chosen values.