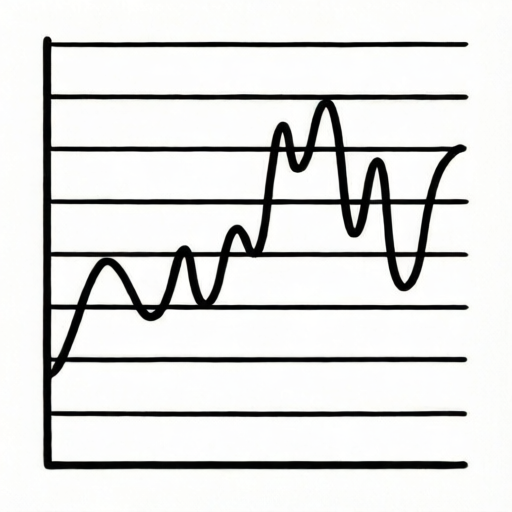
Reference diagram
LETTER · Download PDF (1 page)
Free original resources
Learn to translate pitch-rise and fall graphs into melodic contour lines on staff-like areas, using a clear convention and checkable steps.
Original reference diagrams, four practice exercises and separate worked answers. All files are free. No signup required.
LETTER · Download PDF (1 page)
LETTER · Download PDF (4 pages)
LETTER · Download PDF (4 pages)
Choose A4 or US Letter for your printer. The reference and answer illustrations are not physical rulers; follow the scale instruction printed on the practice worksheet.
Melodic contour drawing turns a graph of pitch over time into a line that rises and falls. This lesson teaches a simple convention: the vertical position of your drawn line matches the graph's pitch height, and horizontal position matches time. You will practice reading graphs, plotting contour points, and checking your line against the graph. No music notation is required. All examples use a staff-like area with five horizontal guide lines, but the contour line itself is the focus. The convention is explicit so that valid alternatives, such as slightly different line thickness or smoothness, are accepted when the shape matches the graph.
A pitch graph shows time on the horizontal axis and pitch height on the vertical axis. Higher points mean higher pitch. The graph is a series of line segments connecting points. Your task is to copy the shape of that line into a staff-like drawing area, keeping the same rise and fall pattern and the same heights on the numbered guide lines.
Use the graph's grid to note key points: where the line starts, where it peaks, where it dips, and where it ends. Mark these times and heights lightly before drawing the contour. The staff-like area has five horizontal guide lines numbered 1 to 5 from bottom to top. Treat these as a fixed height scale: height 1 is the bottom guide line, height 2 is the second guide line, and so on up to height 5. Place your contour so that each height in the graph sits on the matching numbered guide line.
Draw the contour line in one continuous stroke if possible. The line should be clear and unbroken. You may use a pencil and then darken it. The line's vertical position is set by the numbered guide lines: a graph height of 3 means your contour passes through guide line 3. Horizontal spacing should match the time intervals on the graph. If the graph has a flat segment, your contour should be flat for the same horizontal distance.
A valid contour does not need to be perfectly smooth. Slight wobbles are acceptable if the overall shape is correct. What matters is that peaks, dips, and flat sections occur at the right horizontal positions and sit on the right numbered guide lines. For example, if a peak is at height 4, your drawn peak should touch guide line 4.
After drawing, compare your contour to the graph point by point. Check that the number of rises and falls matches. Check that the highest point of your contour is at the same horizontal position as the graph's highest point. Check that flat sections are flat. If you find a mismatch, adjust the line rather than starting over.
A simple check is to trace the graph with your finger while tracing your contour with a pencil. Both should move up and down together. Another check is to compare heights to guide-line numbers: if the graph rises from height 2 to height 4, your contour should move from guide line 2 to guide line 4. Small differences in line thickness or smoothness do not affect correctness.
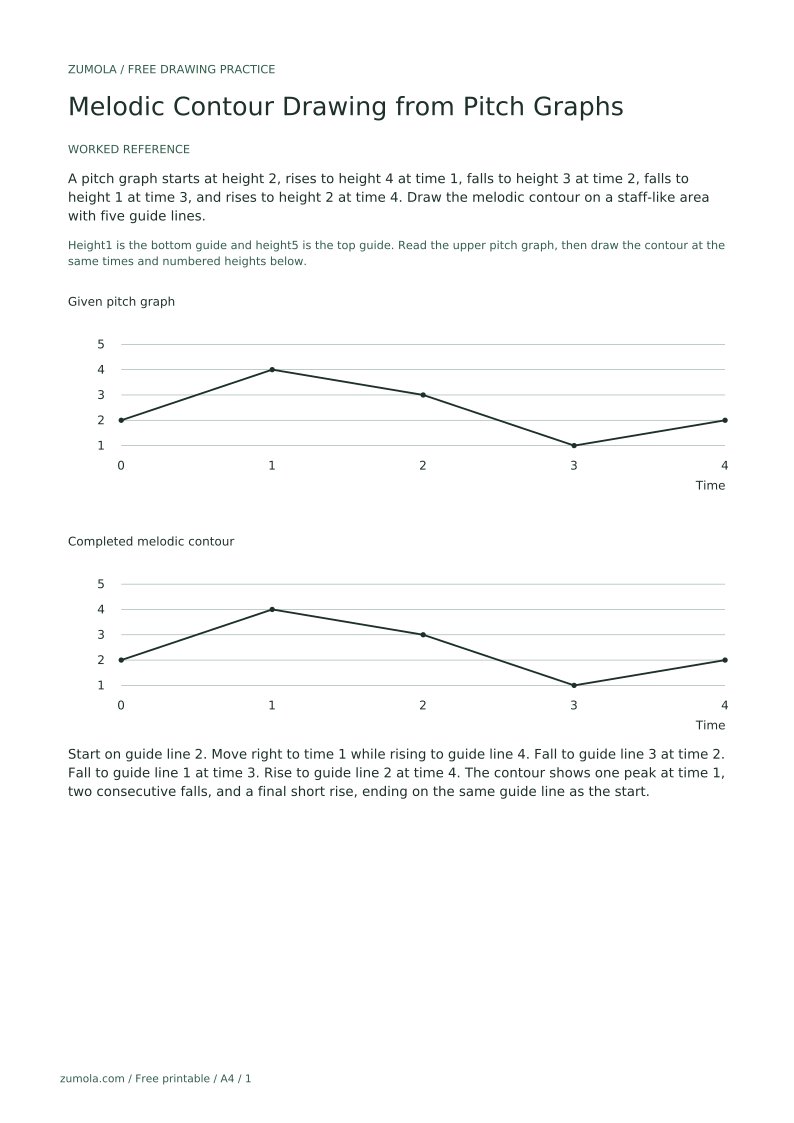
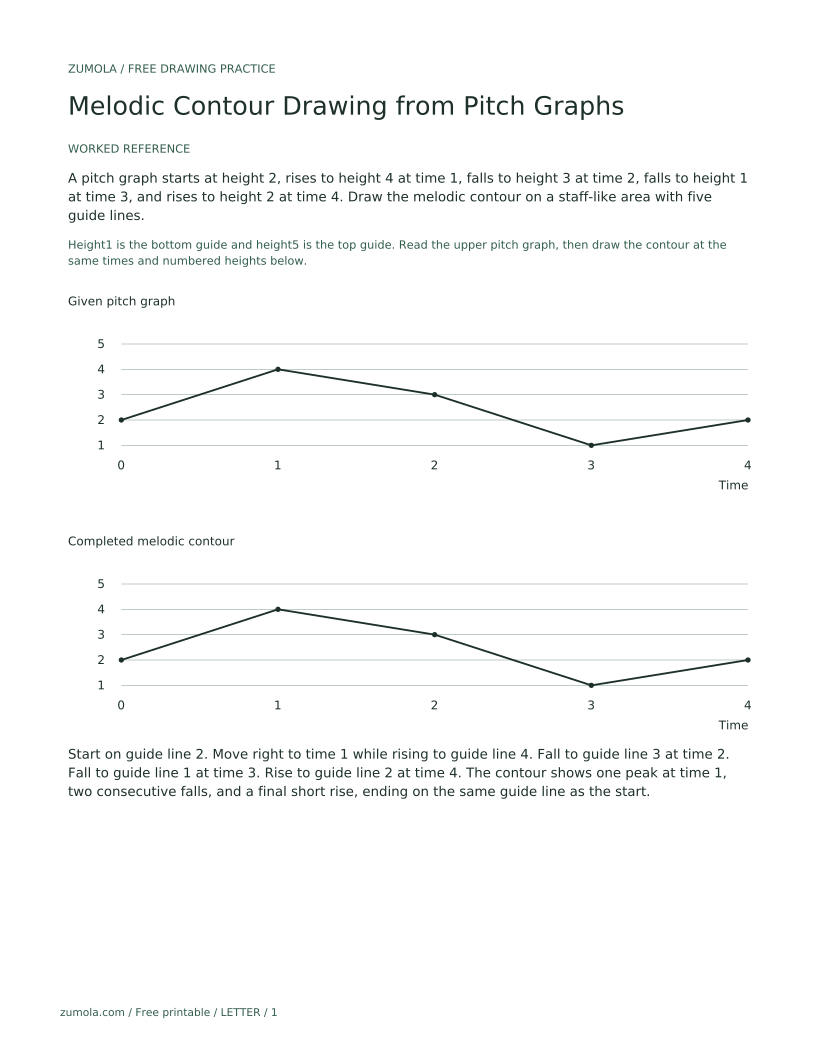
A pitch graph starts at height 2, rises to height 4 at time 1, falls to height 3 at time 2, falls to height 1 at time 3, and rises to height 2 at time 4. Draw the melodic contour on a staff-like area with five guide lines.
Start on guide line 2. Move right to time 1 while rising to guide line 4. Fall to guide line 3 at time 2. Fall to guide line 1 at time 3. Rise to guide line 2 at time 4. The contour shows one peak at time 1, two consecutive falls, and a final short rise, ending on the same guide line as the start.
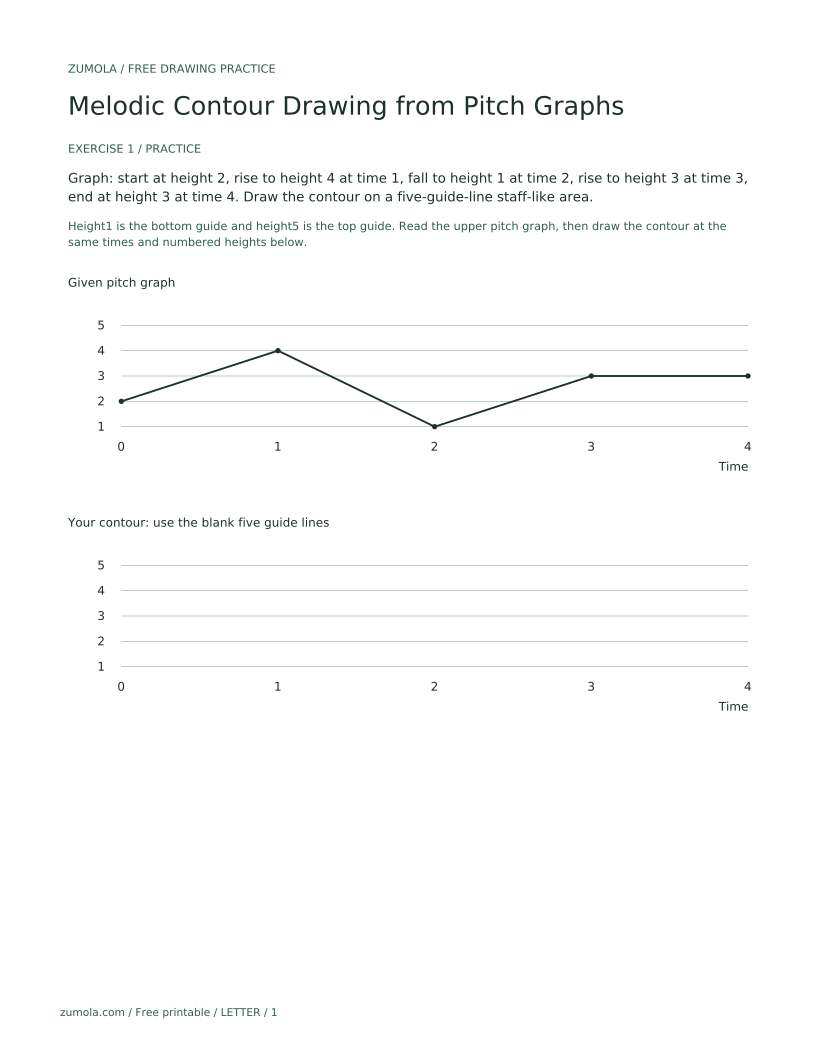
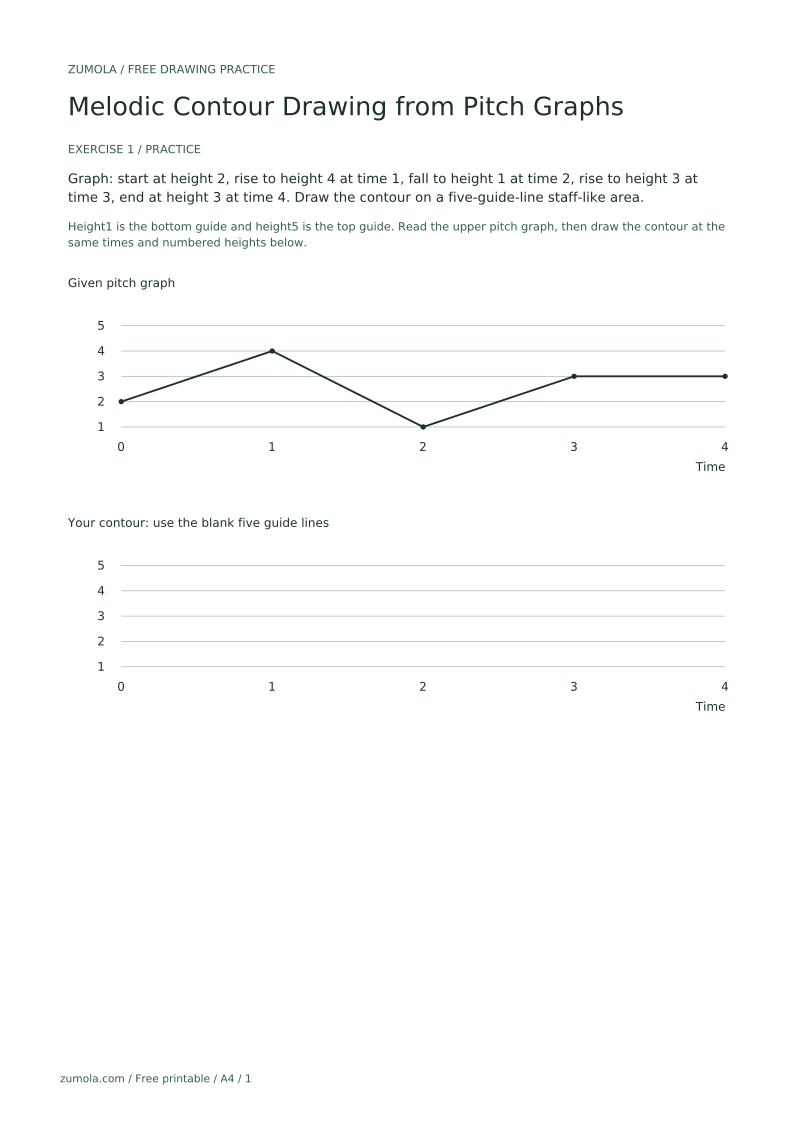
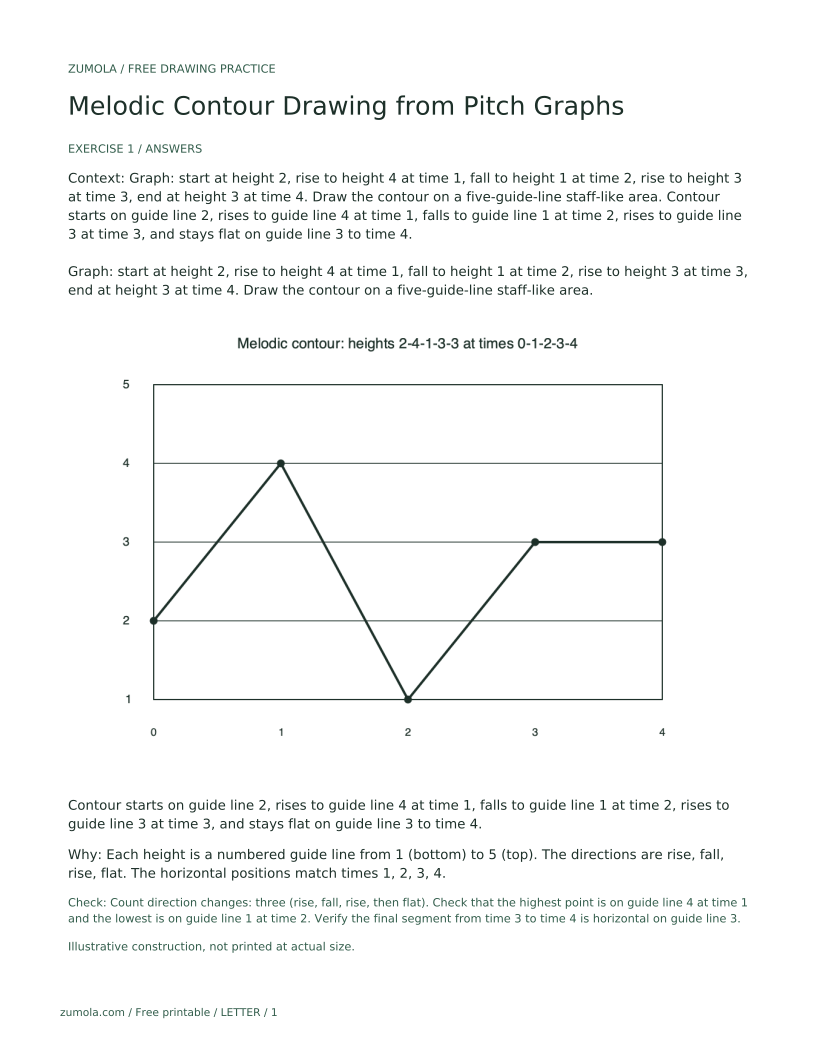
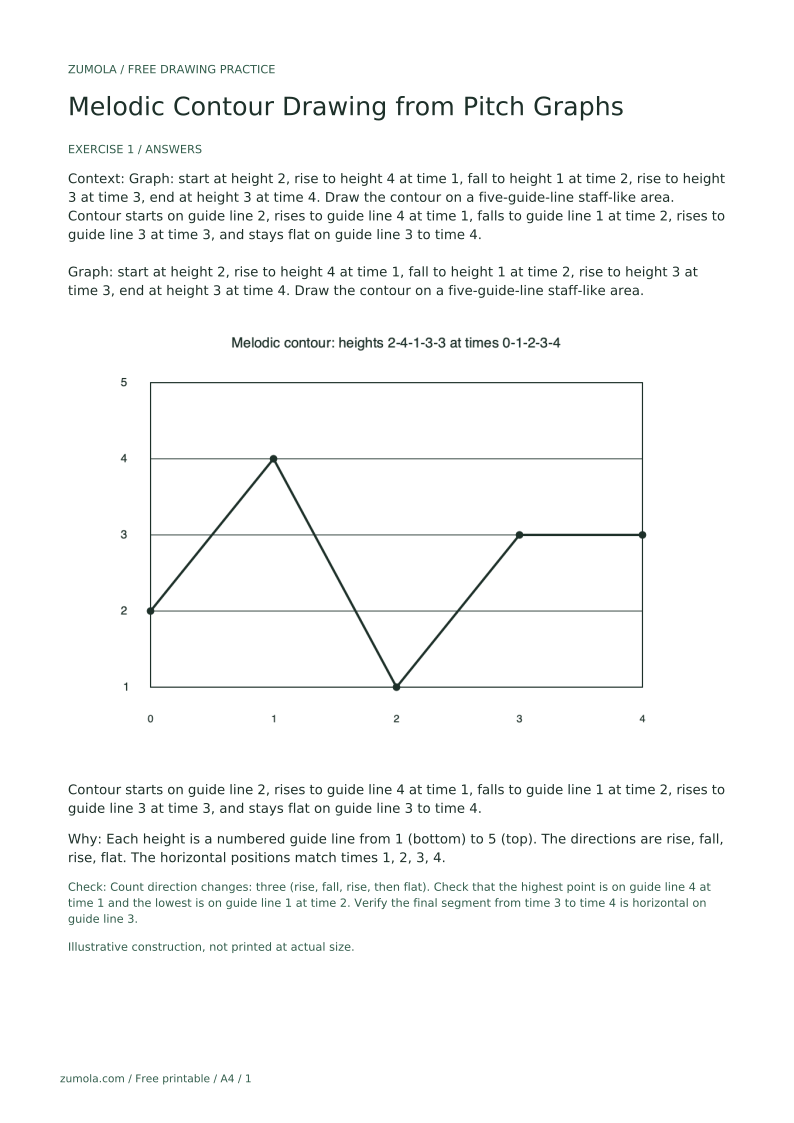
Graph: start at height 2, rise to height 4 at time 1, fall to height 1 at time 2, rise to height 3 at time 3, end at height 3 at time 4. Draw the contour on a five-guide-line staff-like area.
Contour starts on guide line 2, rises to guide line 4 at time 1, falls to guide line 1 at time 2, rises to guide line 3 at time 3, and stays flat on guide line 3 to time 4.
Each height is a numbered guide line from 1 (bottom) to 5 (top). The directions are rise, fall, rise, flat. The horizontal positions match times 1, 2, 3, 4.
Check: Count direction changes: three (rise, fall, rise, then flat). Check that the highest point is on guide line 4 at time 1 and the lowest is on guide line 1 at time 2. Verify the final segment from time 3 to time 4 is horizontal on guide line 3.
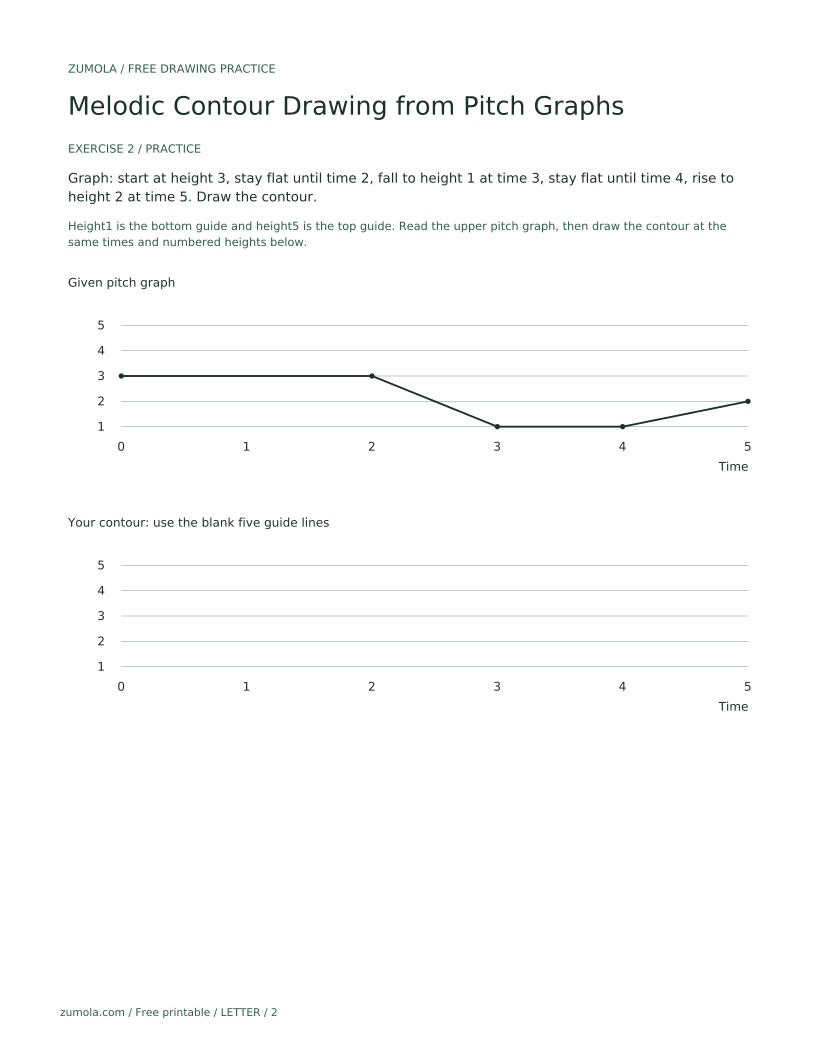
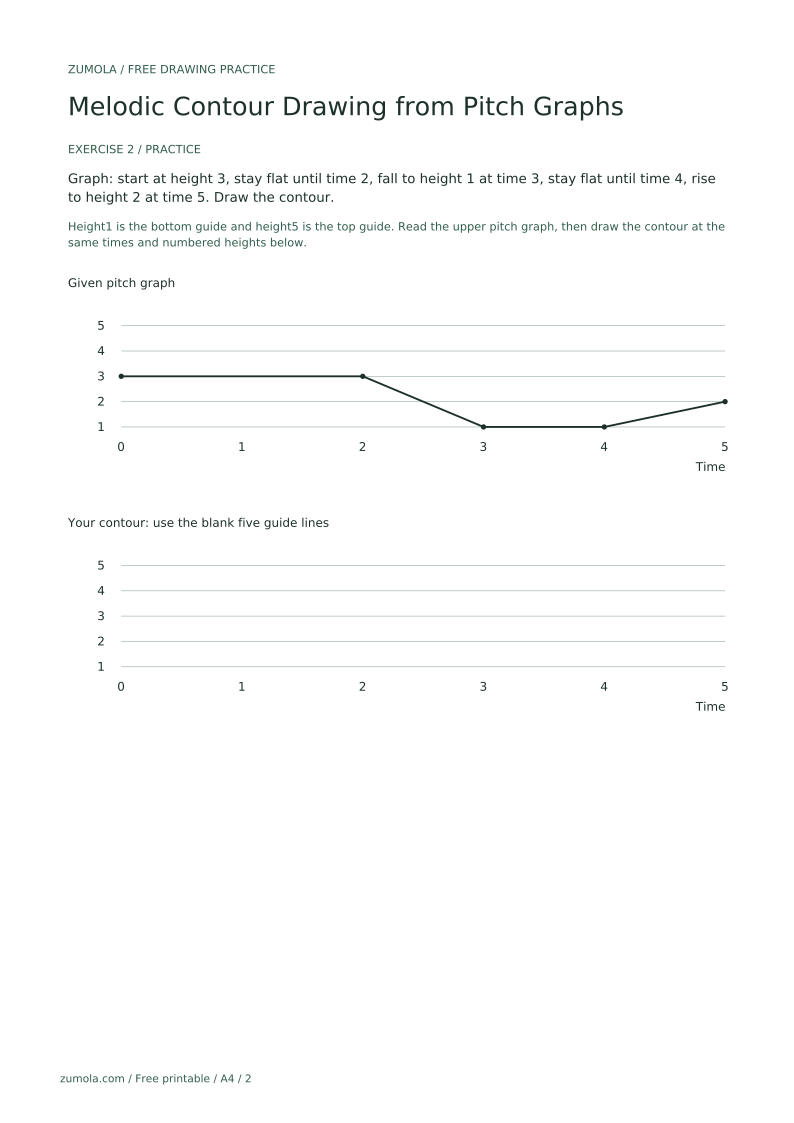
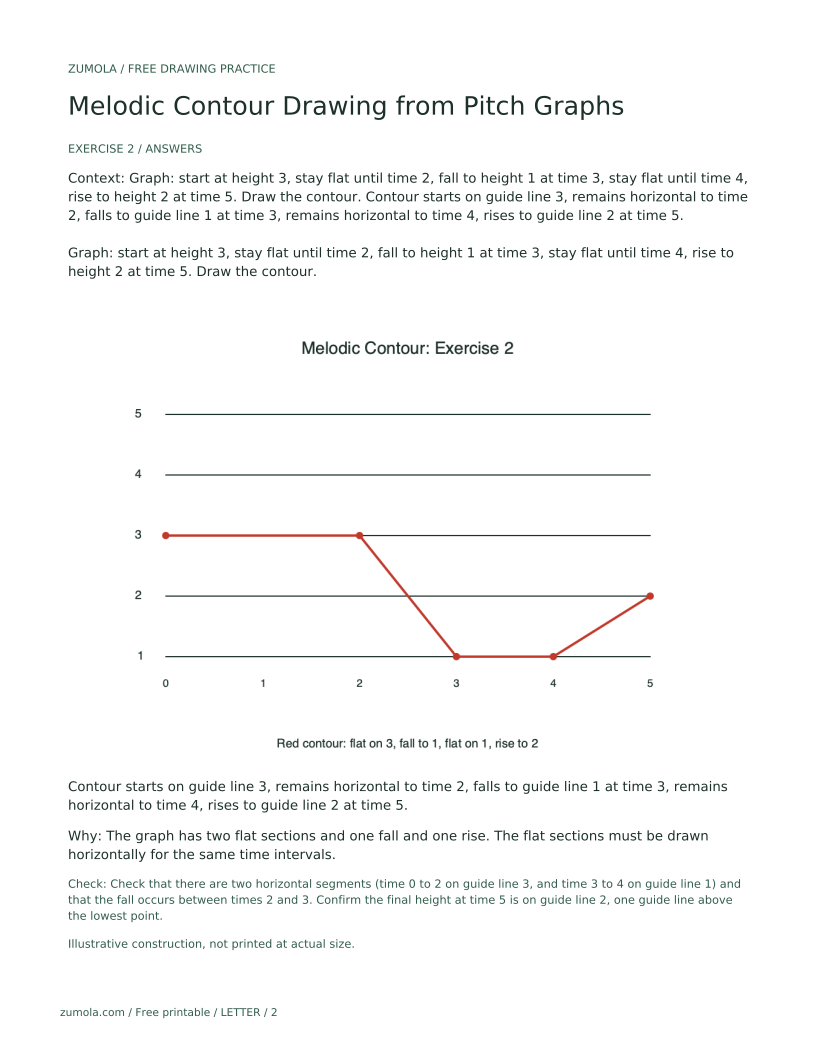
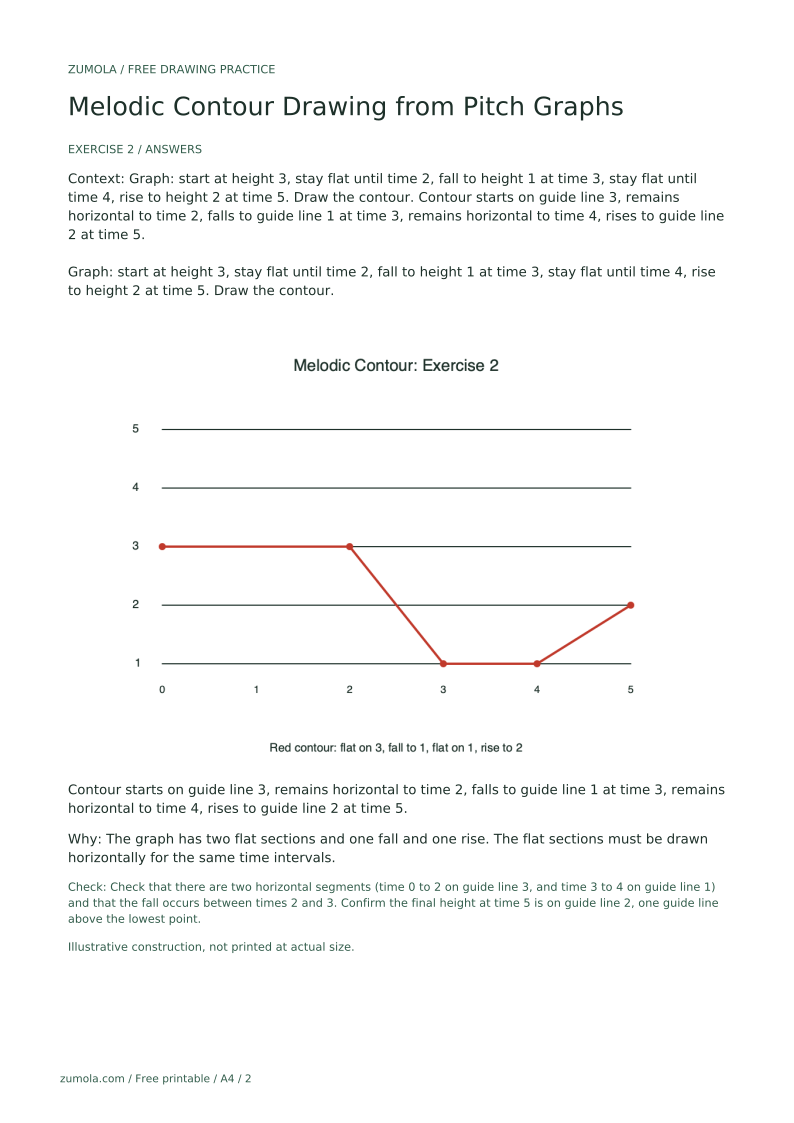
Graph: start at height 3, stay flat until time 2, fall to height 1 at time 3, stay flat until time 4, rise to height 2 at time 5. Draw the contour.
Contour starts on guide line 3, remains horizontal to time 2, falls to guide line 1 at time 3, remains horizontal to time 4, rises to guide line 2 at time 5.
The graph has two flat sections and one fall and one rise. The flat sections must be drawn horizontally for the same time intervals.
Check: Check that there are two horizontal segments (time 0 to 2 on guide line 3, and time 3 to 4 on guide line 1) and that the fall occurs between times 2 and 3. Confirm the final height at time 5 is on guide line 2, one guide line above the lowest point.
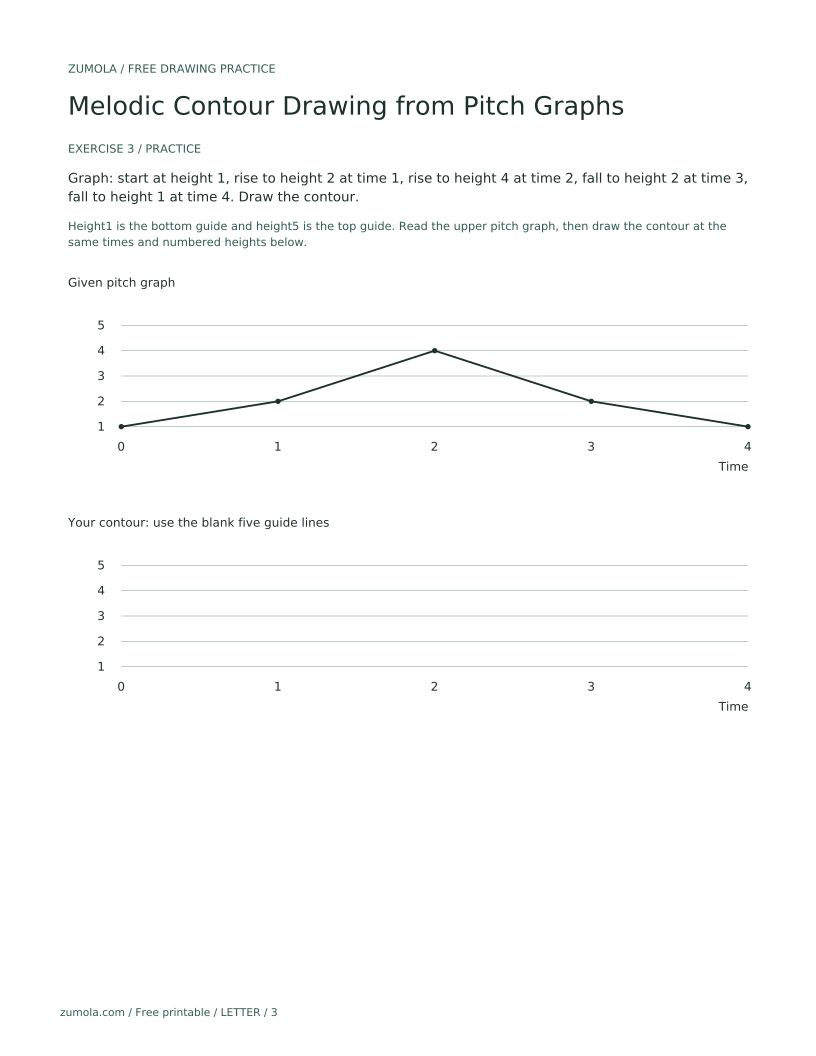
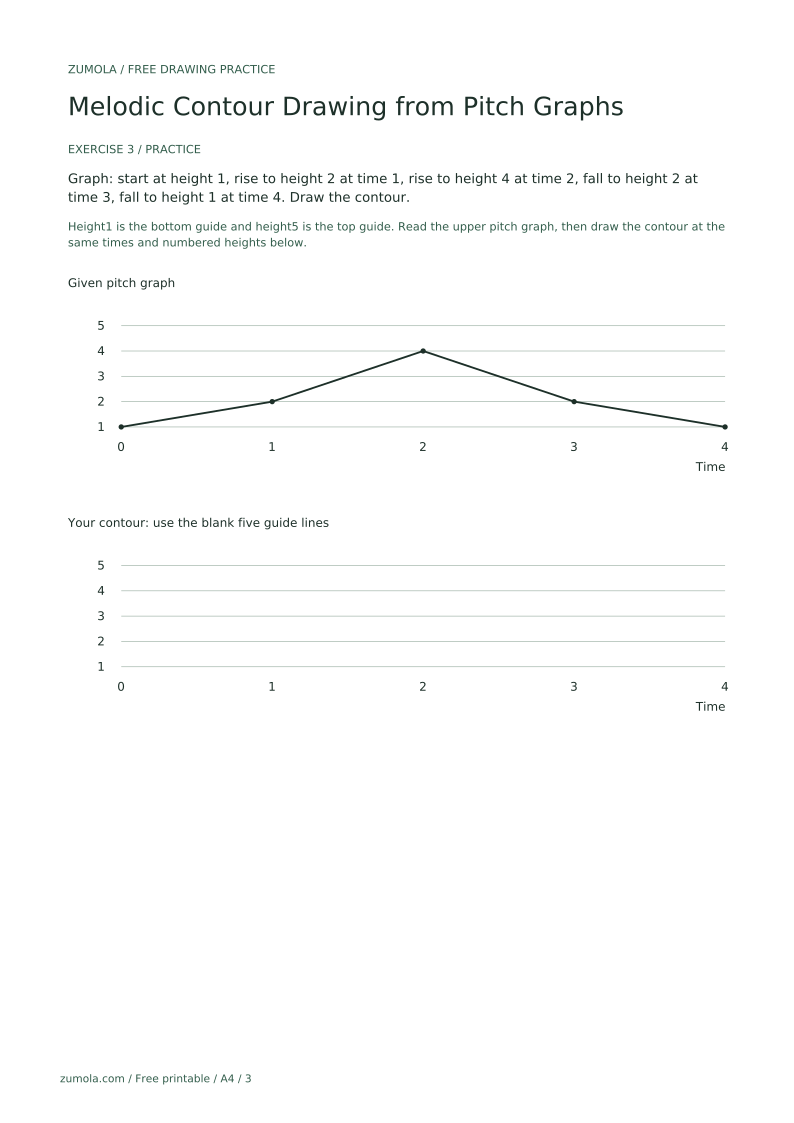
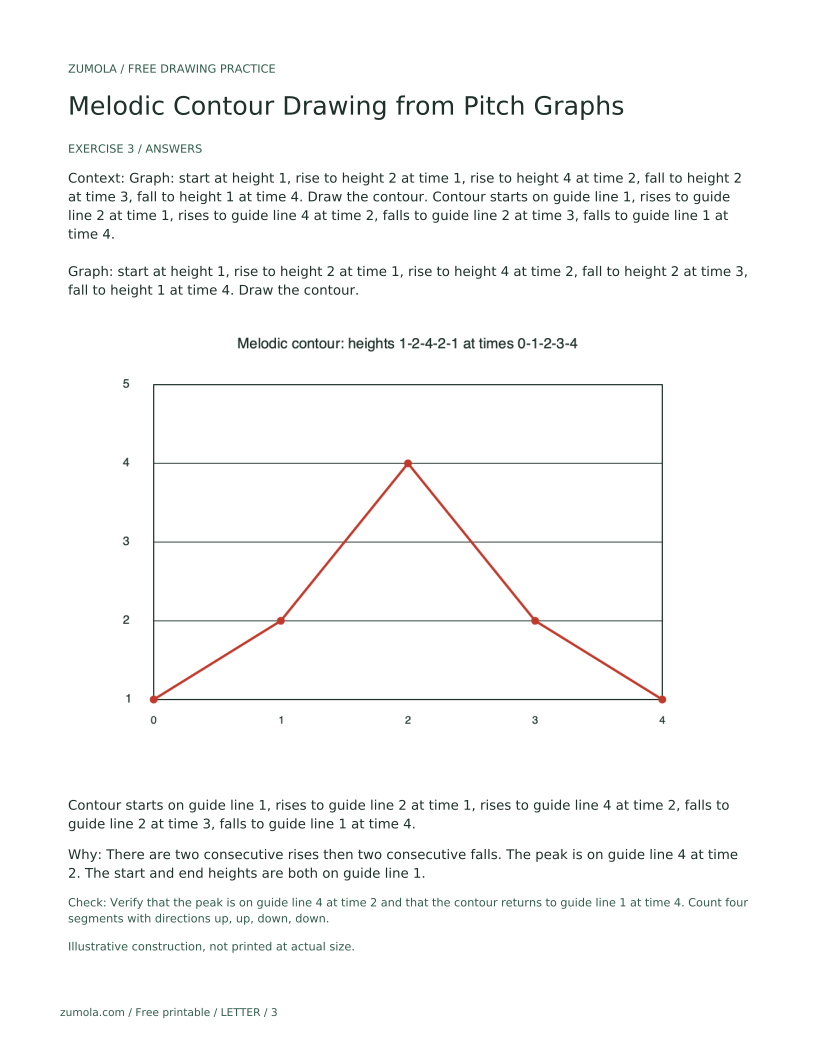
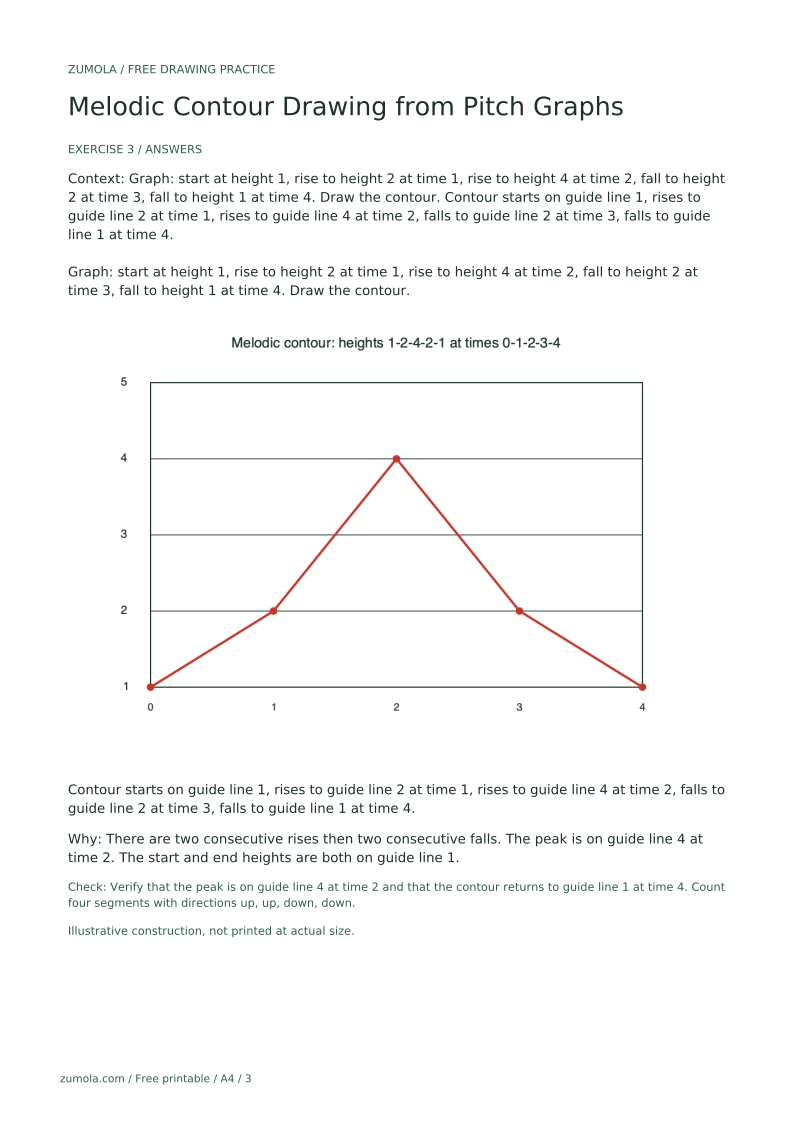
Graph: start at height 1, rise to height 2 at time 1, rise to height 4 at time 2, fall to height 2 at time 3, fall to height 1 at time 4. Draw the contour.
Contour starts on guide line 1, rises to guide line 2 at time 1, rises to guide line 4 at time 2, falls to guide line 2 at time 3, falls to guide line 1 at time 4.
There are two consecutive rises then two consecutive falls. The peak is on guide line 4 at time 2. The start and end heights are both on guide line 1.
Check: Verify that the peak is on guide line 4 at time 2 and that the contour returns to guide line 1 at time 4. Count four segments with directions up, up, down, down.
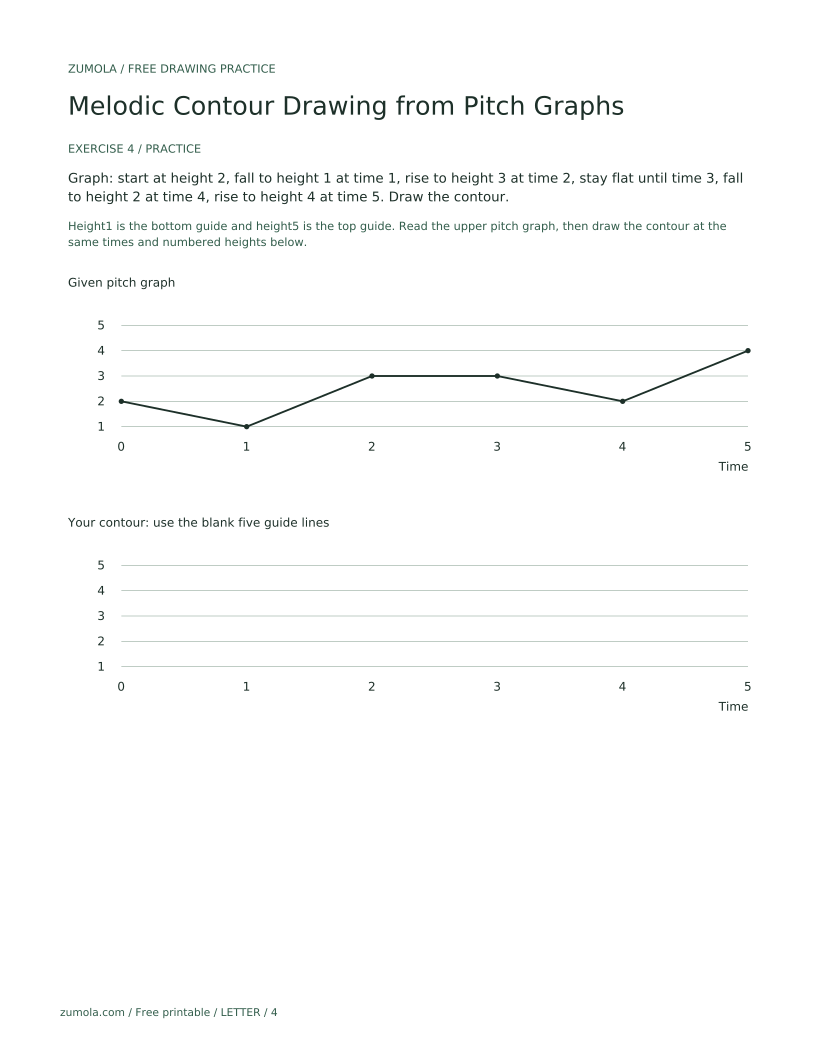
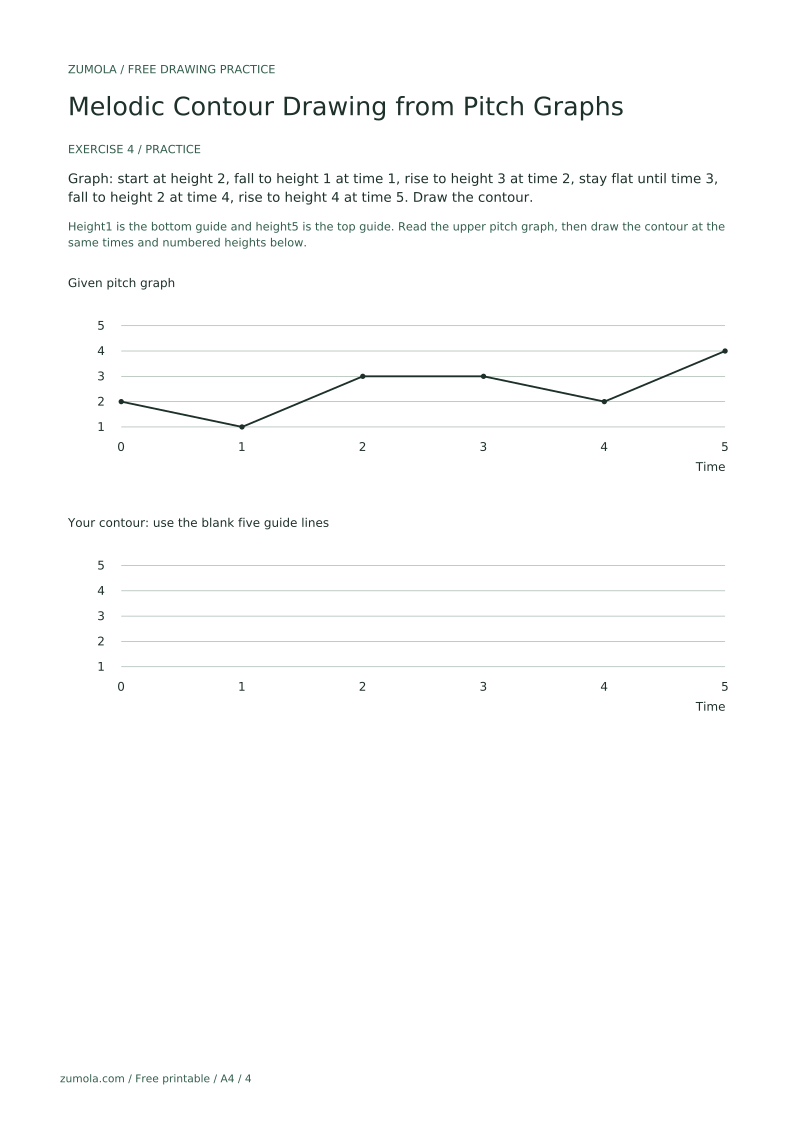
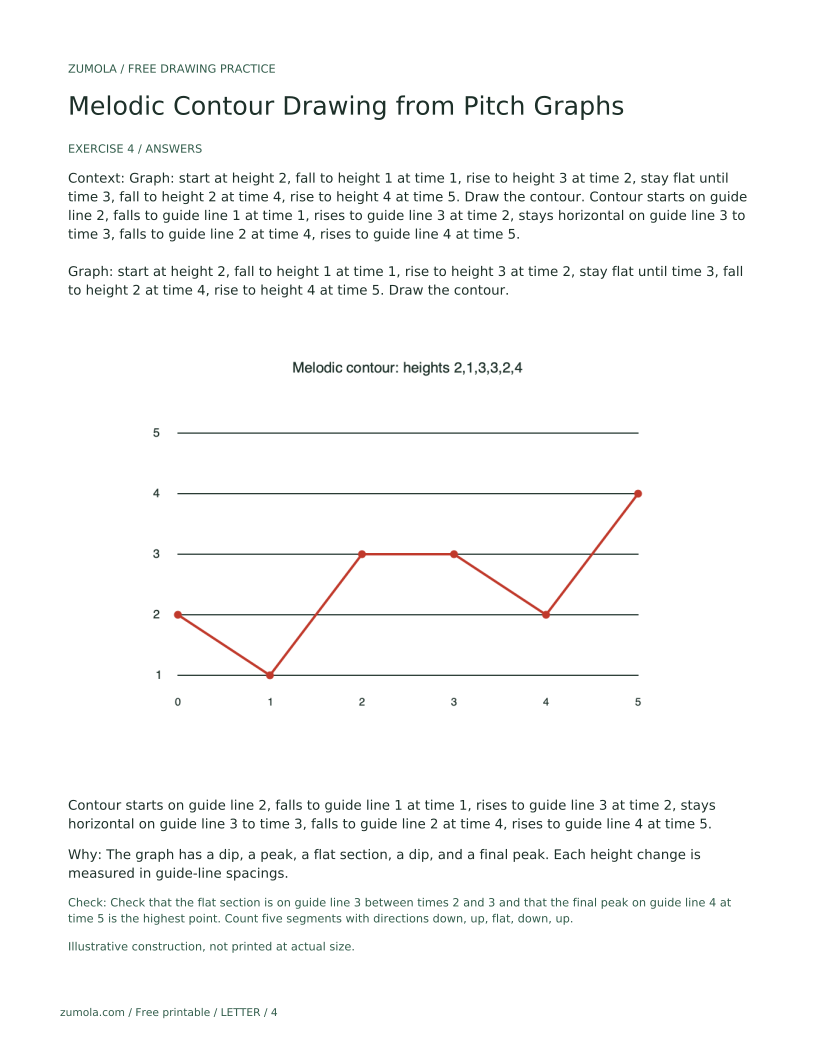
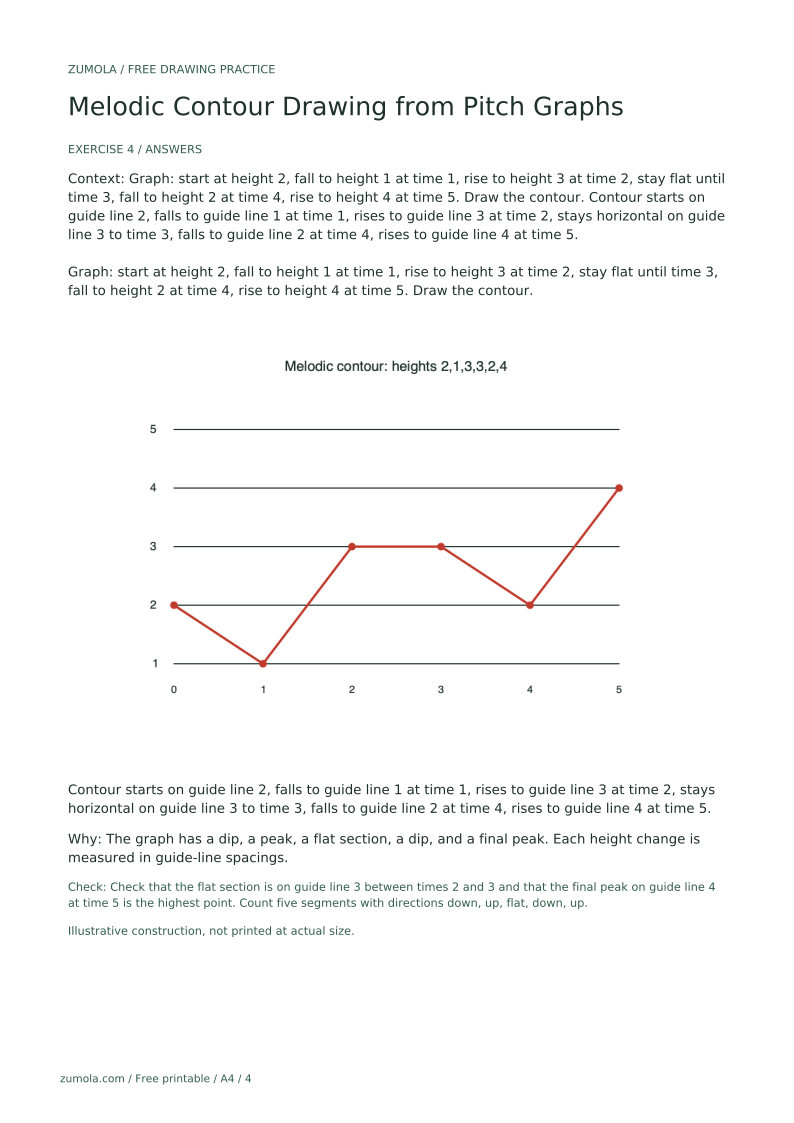
Graph: start at height 2, fall to height 1 at time 1, rise to height 3 at time 2, stay flat until time 3, fall to height 2 at time 4, rise to height 4 at time 5. Draw the contour.
Contour starts on guide line 2, falls to guide line 1 at time 1, rises to guide line 3 at time 2, stays horizontal on guide line 3 to time 3, falls to guide line 2 at time 4, rises to guide line 4 at time 5.
The graph has a dip, a peak, a flat section, a dip, and a final peak. Each height change is measured in guide-line spacings.
Check: Check that the flat section is on guide line 3 between times 2 and 3 and that the final peak on guide line 4 at time 5 is the highest point. Count five segments with directions down, up, flat, down, up.
Re-read the vertical axis: higher on the graph means higher on the staff-like area. Mark the start height first, then move up for rises.
Use the horizontal grid to align each peak with its time. Count intervals from the start before drawing.
Check the graph for horizontal segments and keep your contour horizontal for the same horizontal distance.
Measure peak heights by guide-line number and keep the same guide-line numbers as the graph for start, peak, and end.
No. This lesson uses a staff-like area only as a set of horizontal guide lines. The contour line is the focus, not note names or clefs.
Yes, slight waviness is acceptable if the overall rises, falls, and flat sections match the graph. The rubric allows valid alternatives in line quality.
No. The five guide lines are a fixed height scale numbered 1 to 5, so your contour must sit on the same numbered guide lines as the graph. The convention cares about matching those heights and the pattern of rises and falls.
Use the numbered guide lines as the scale. Your contour should touch the same guide-line numbers as the graph at each key point. The key is matching the pattern of rises and falls and the guide-line heights.