Plot four functions in y=a|x-h|+k. Identify each vertex and symmetry line, calculate sample values and compare upward, downward and wider V shapes.
Choose Letter or A4, then download a student sheet first. Keep the separate reference or answer file closed until you have attempted the case. Every worksheet, SVG and answer is free without signup.
Choose your paper and download
Download paper size
Every worksheet and answer is free. No signup.
Free original resourceAV01
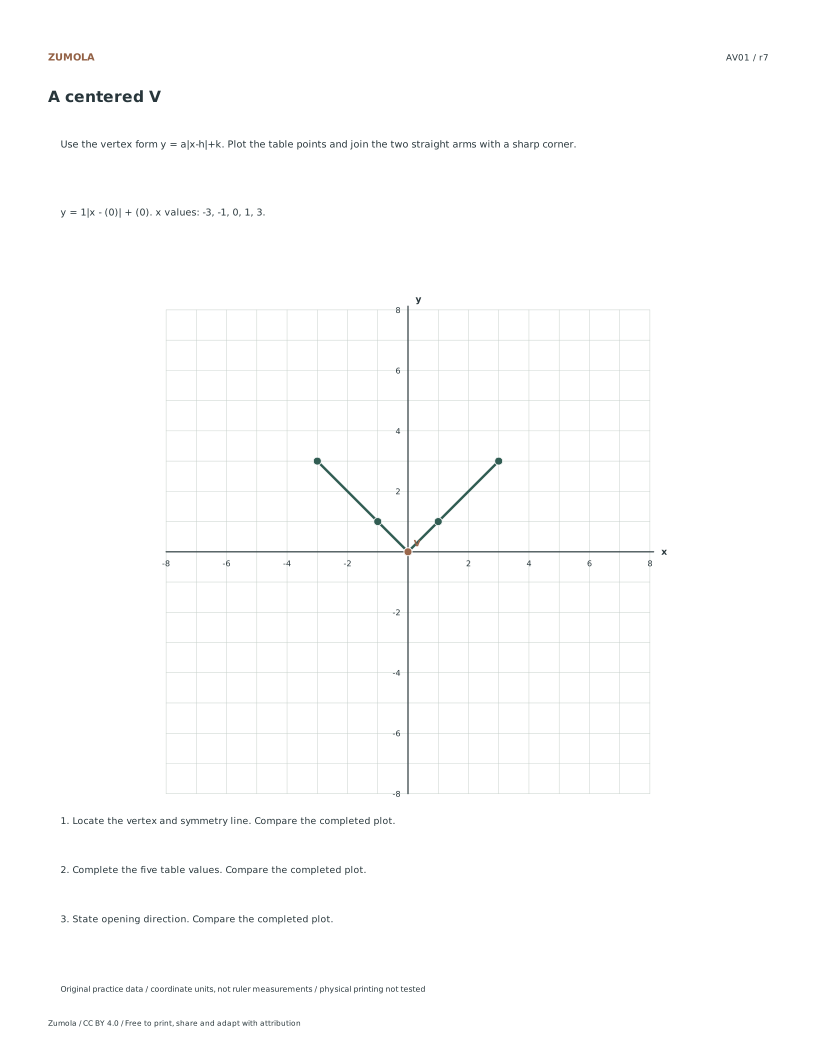
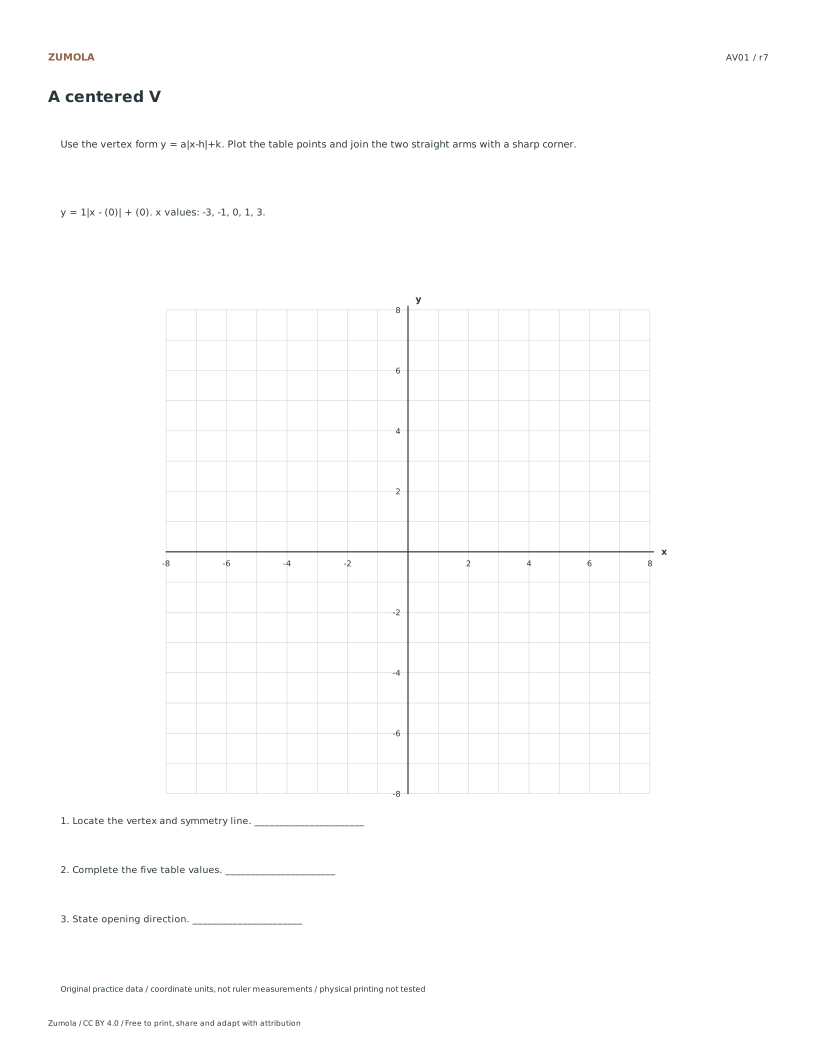
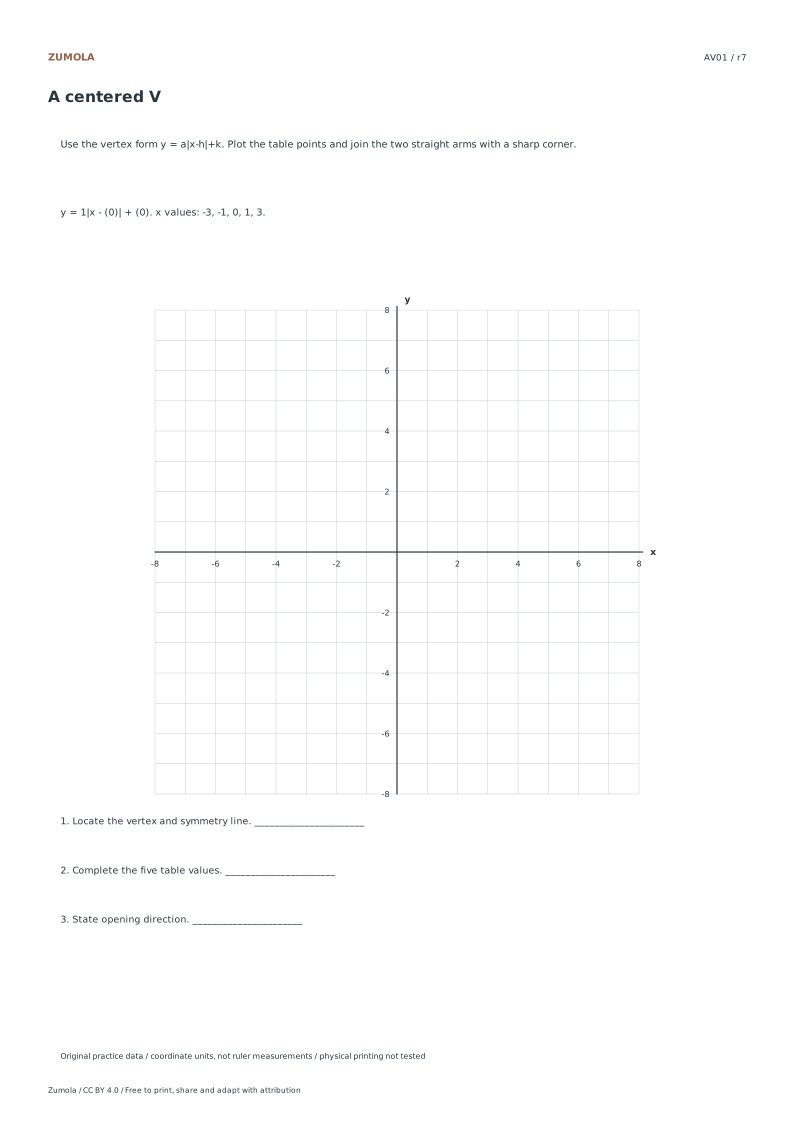
A centered V
Original worksheet collection. Letter or A4 PDF and editable SVG.
All examples use original fictional data and coordinate units. They are practice material, not measured classroom results, published questions or evidence about real people.
Check the first case
AV01: A centered V
Check
Worked result
1
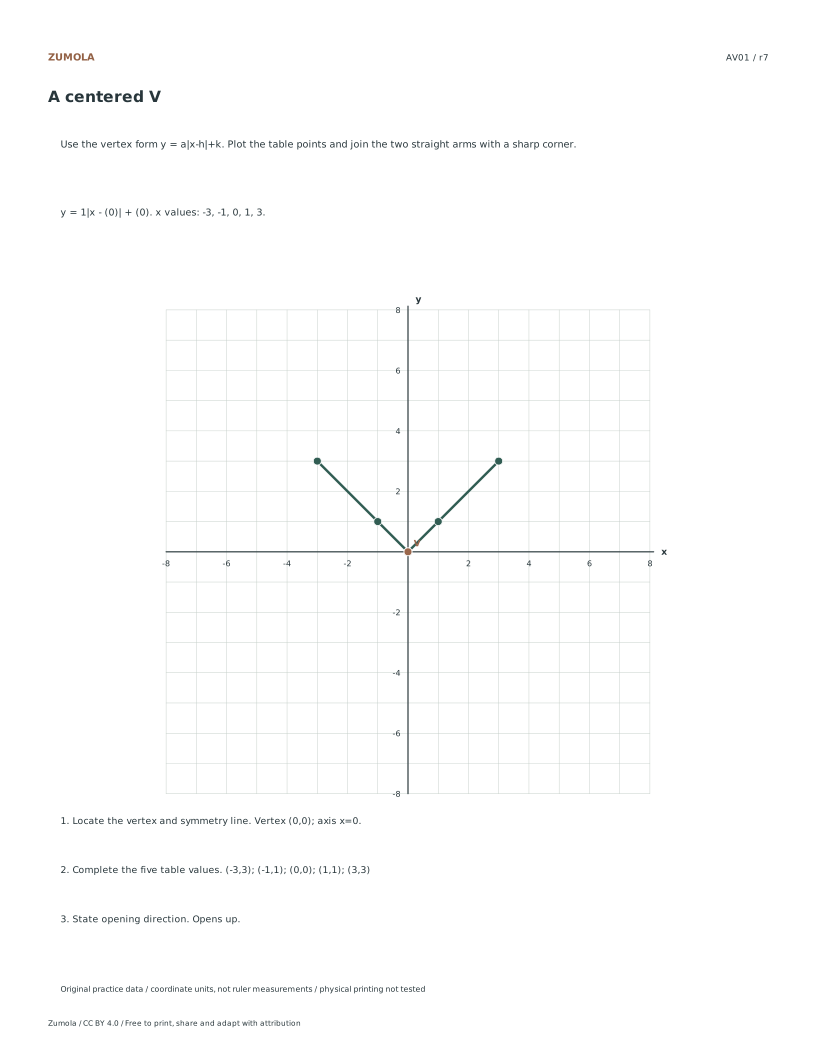
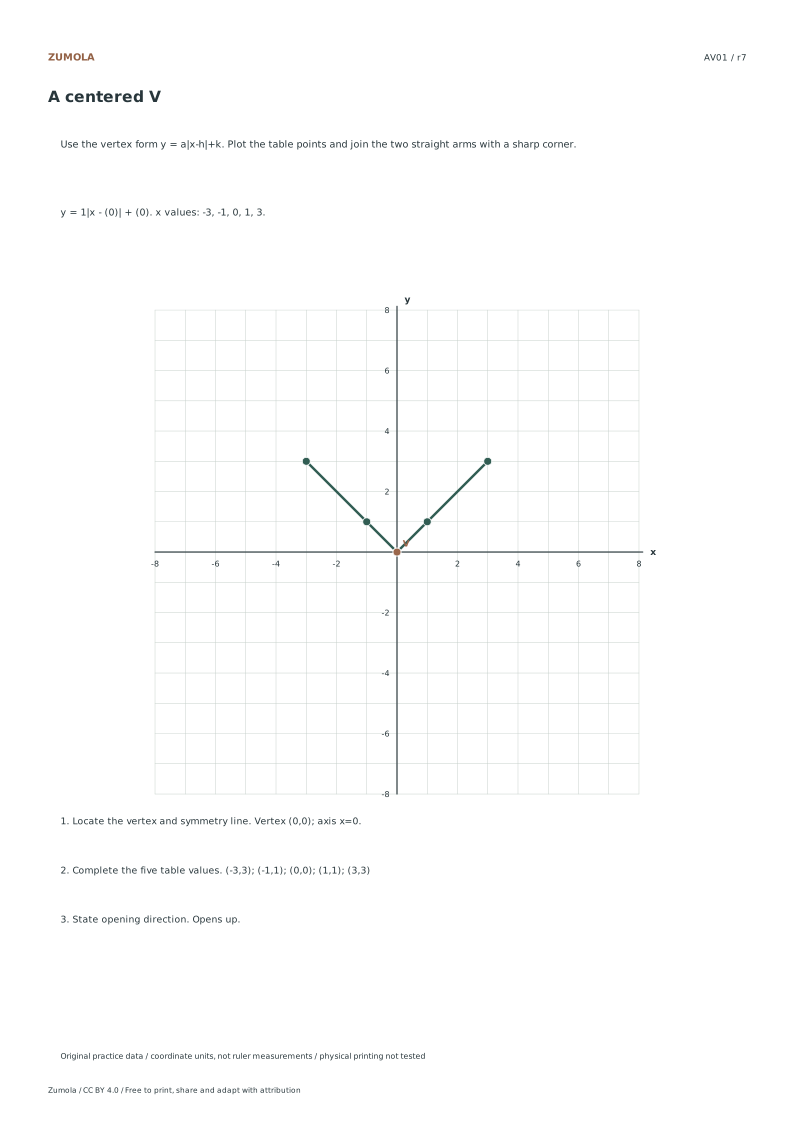
Vertex (0,0); axis x=0.
2
(-3,3); (-1,1); (0,0); (1,1); (3,3)
3
Opens up.
The first case shows the checking pattern. Individual answer files contain the completed graph and result for every case.
Work through the graph
Locating the Vertex Precisely
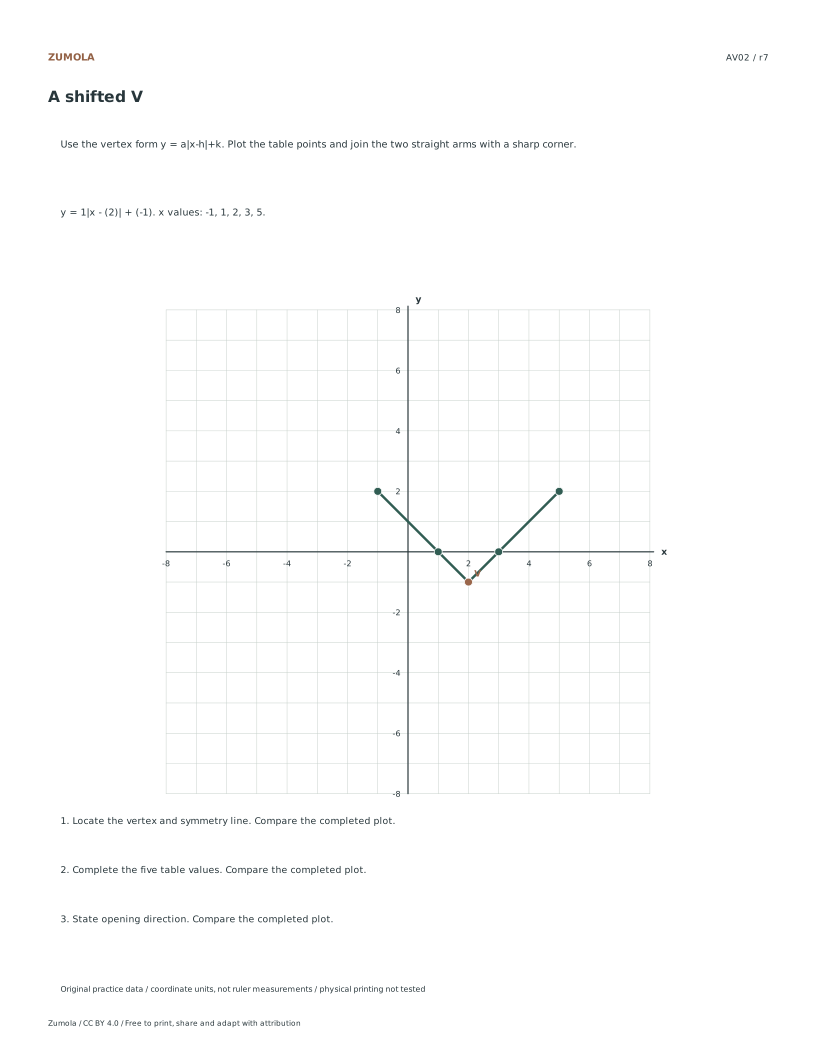
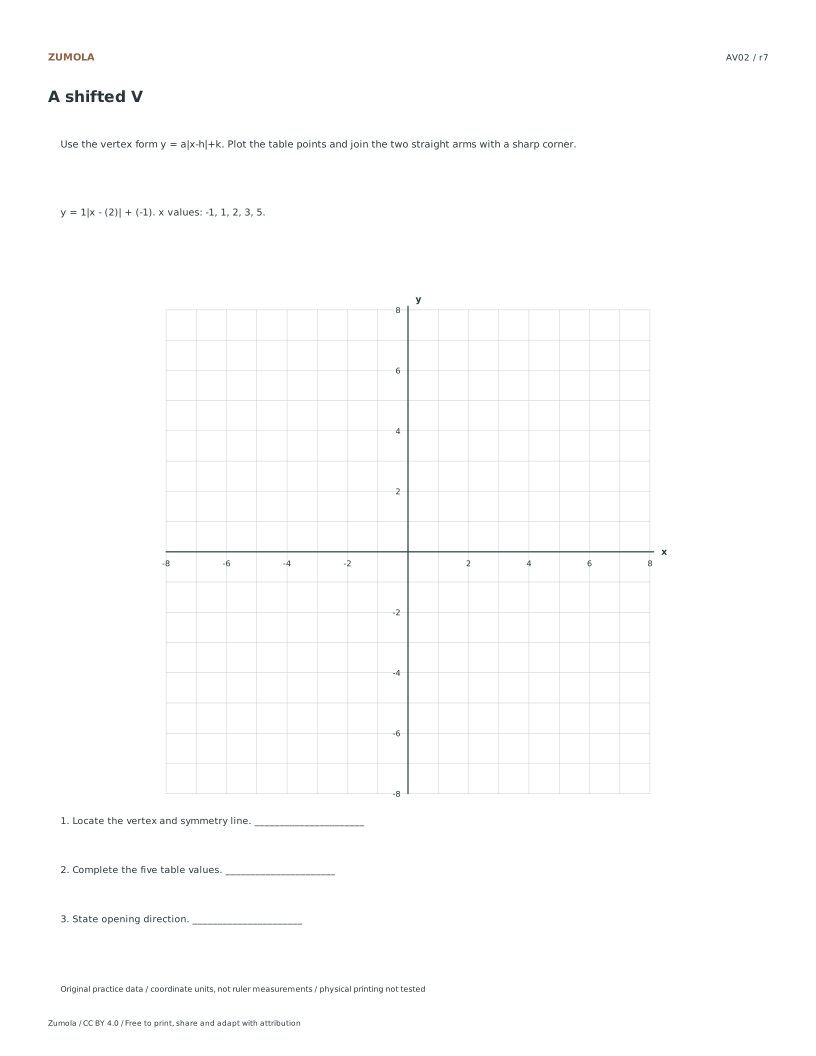
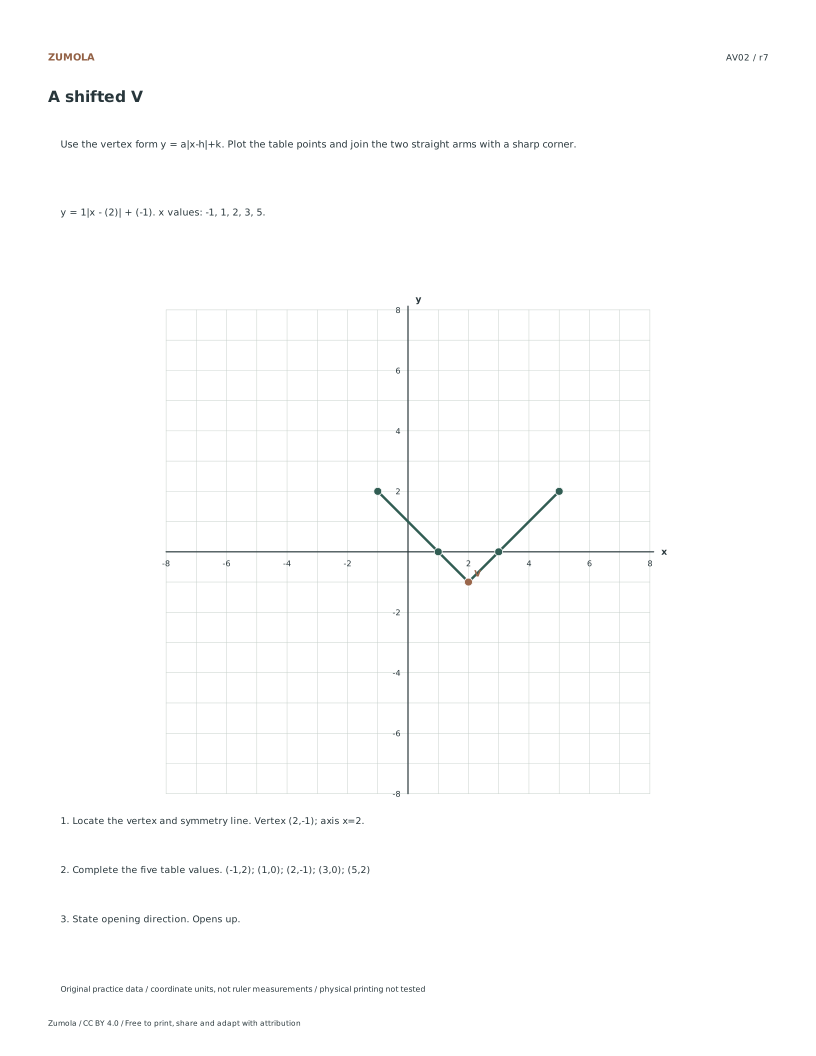
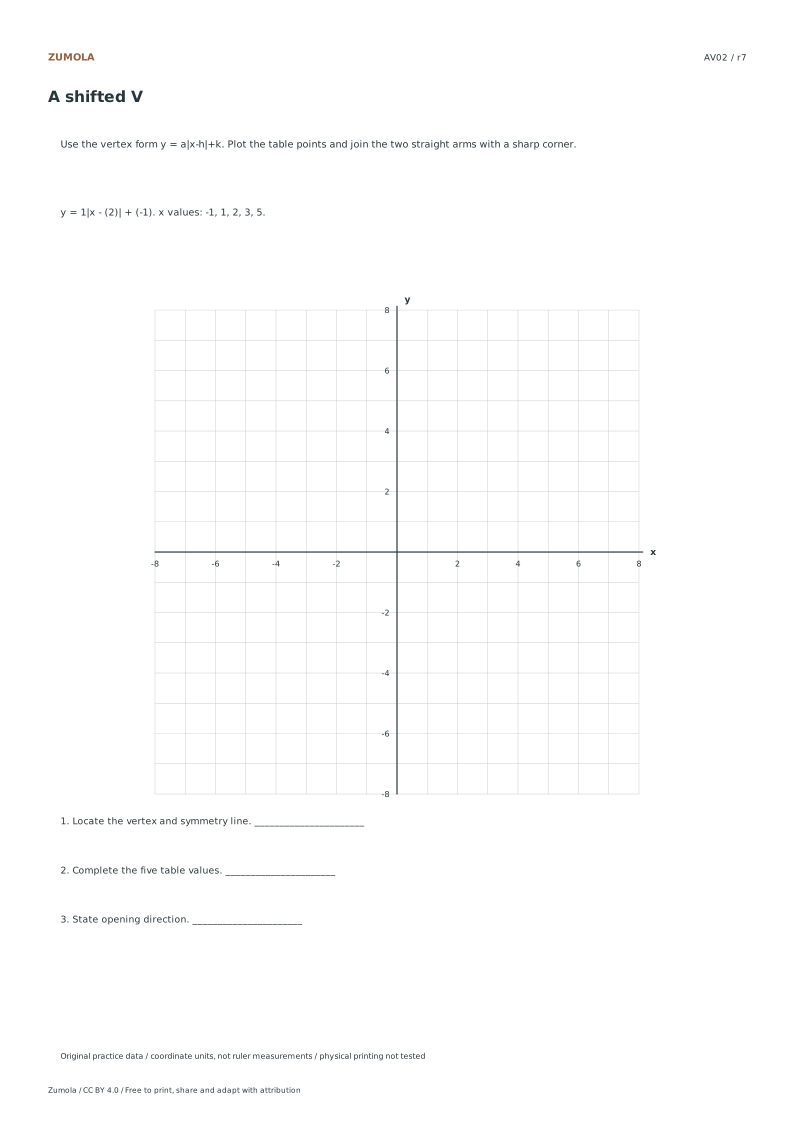
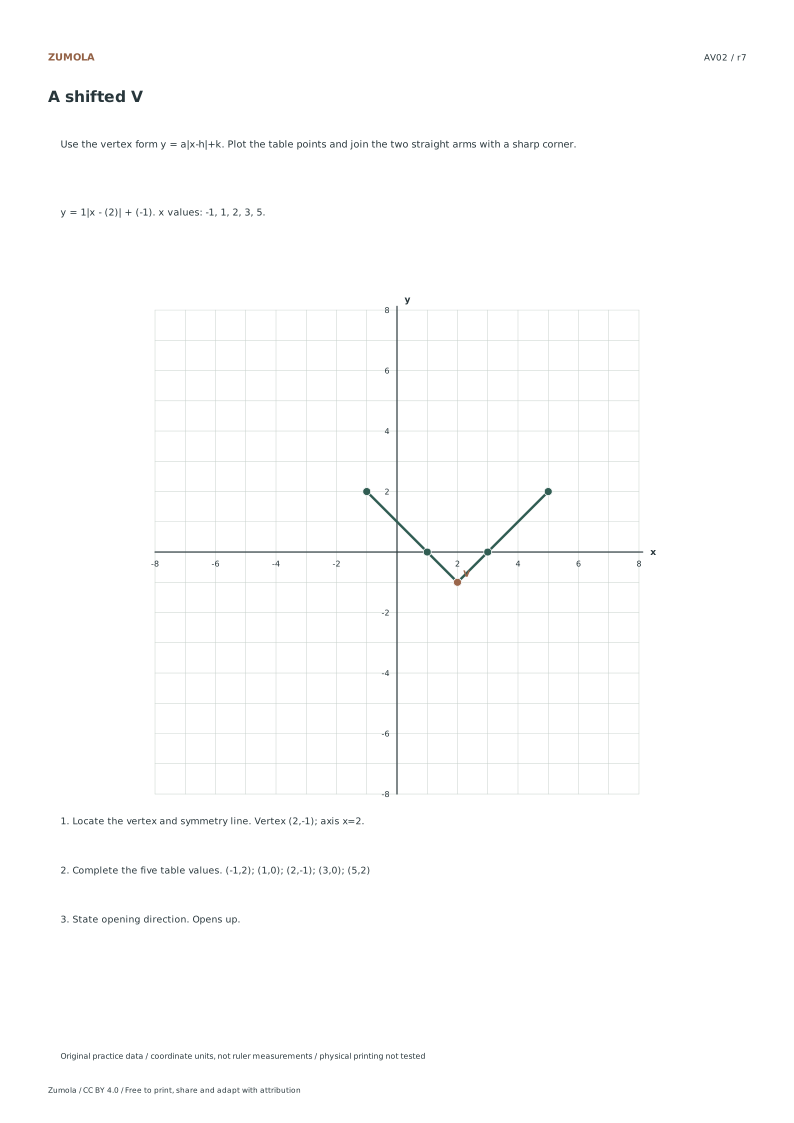
Begin by identifying the vertex coordinates h and k from the function definition y equals a absolute value of x minus h plus k. For the centered V case, the vertex is at zero zero. For the shifted V, it is at two negative one. Mark this point clearly on your grid. Do not rely on physical ruler measurements to find this spot. Instead, use the listed coordinates provided in the reference PDF. This ensures the sharp corner aligns exactly with the mathematical definition. The vertex serves as the anchor for all subsequent plotting steps. Accurate placement here prevents distortion in the rest of the graph. Verify the coordinates against the supplied values before proceeding to the next step.
Plotting Symmetric Input Values
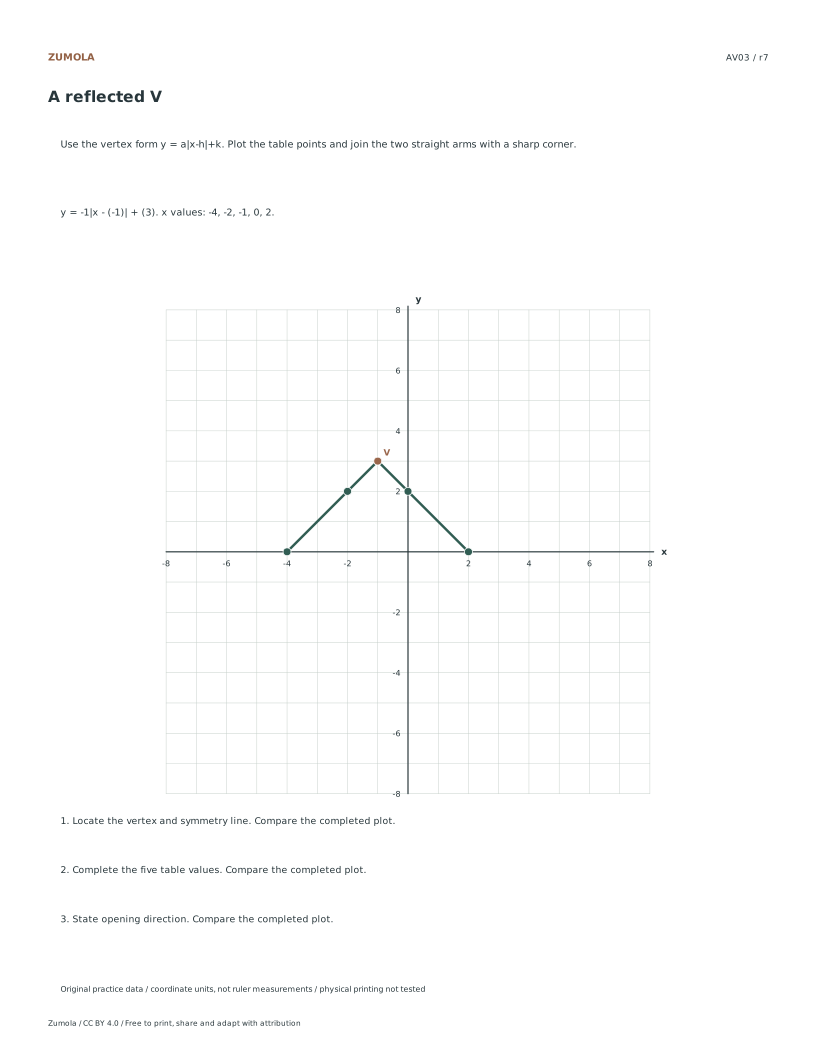
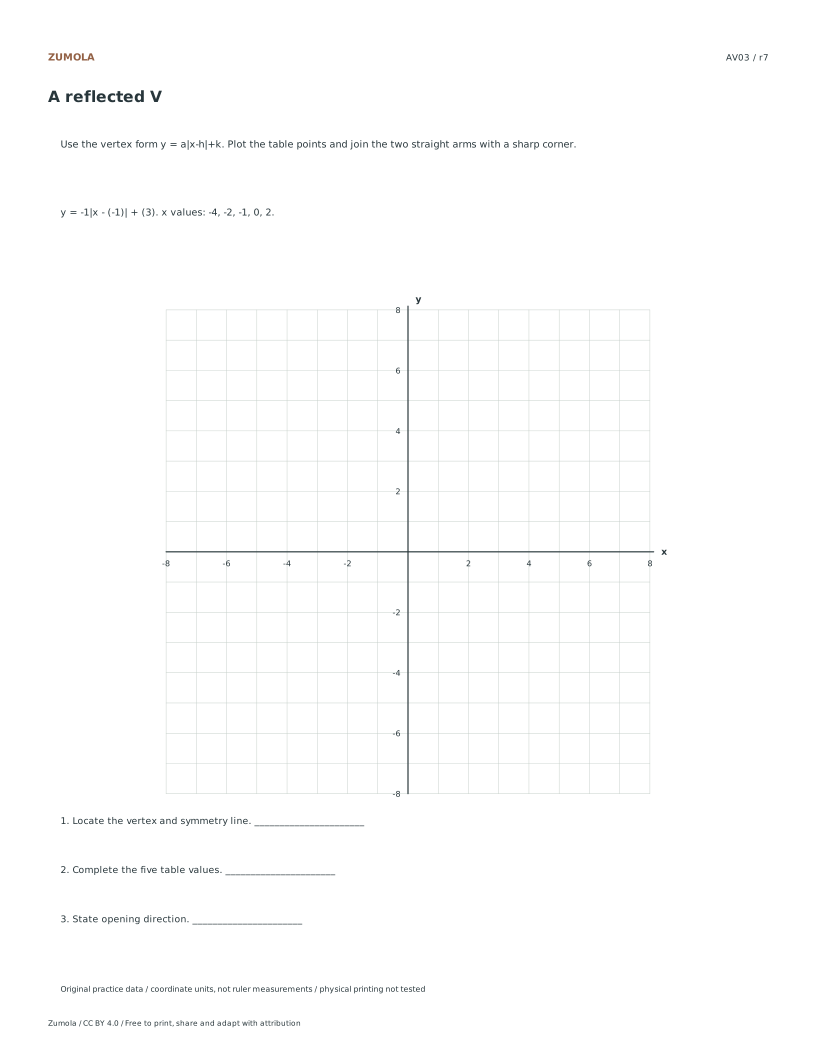
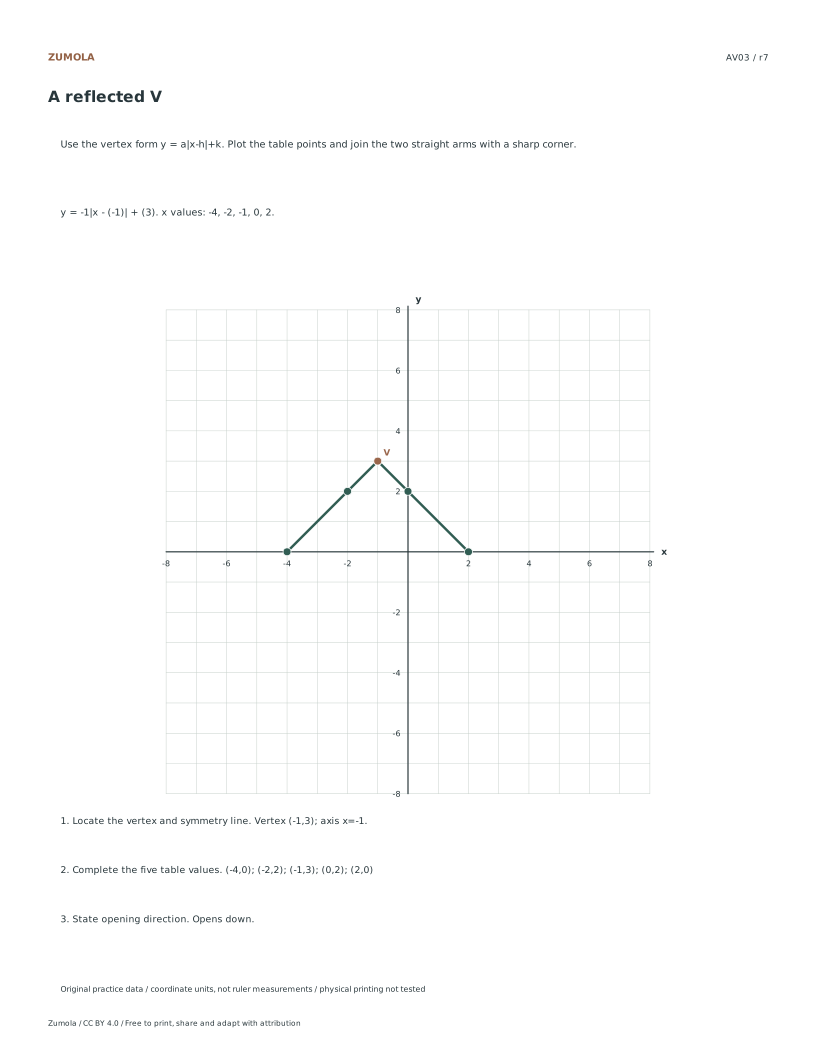
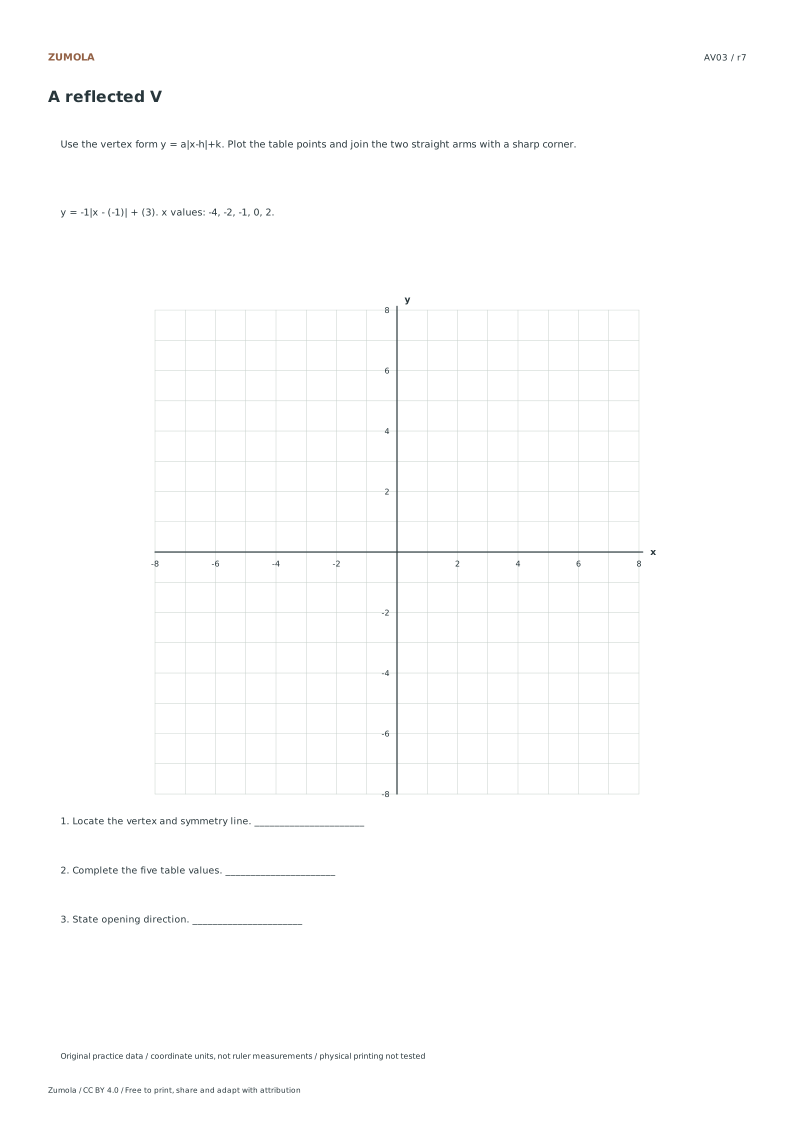
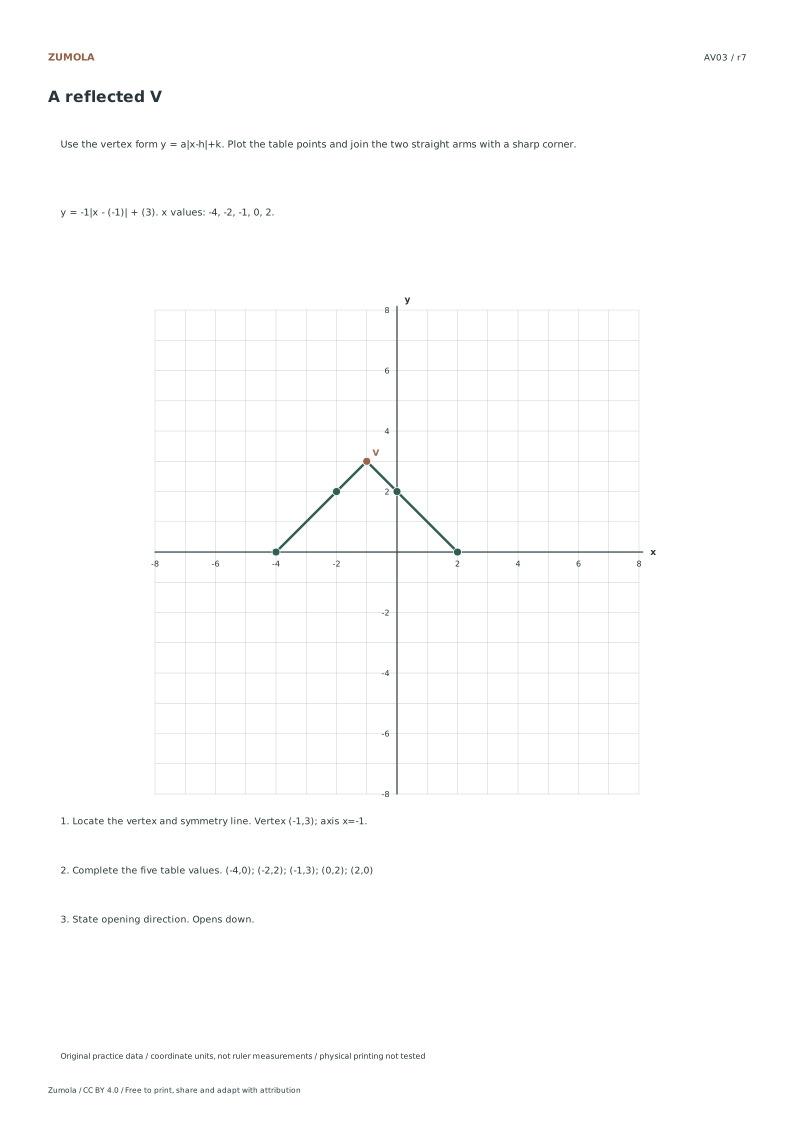
Use the table of symmetric inputs around the vertex h to calculate y values. For the reflected V case with vertex at negative one three, use inputs negative four, negative two, negative one, zero, and two. Calculate each output using the function rule. Plot these points on the coordinate plane. Connect the points with straight lines to form the V shape. Ensure the lines meet at a sharp corner at the vertex. Do not smooth the corner. The symmetry of the inputs ensures the graph balances correctly around the vertical axis of symmetry. Check your plotted points against the answer PDF to confirm accuracy. This method relies on calculation, not physical estimation.
Applying the Scale Factor
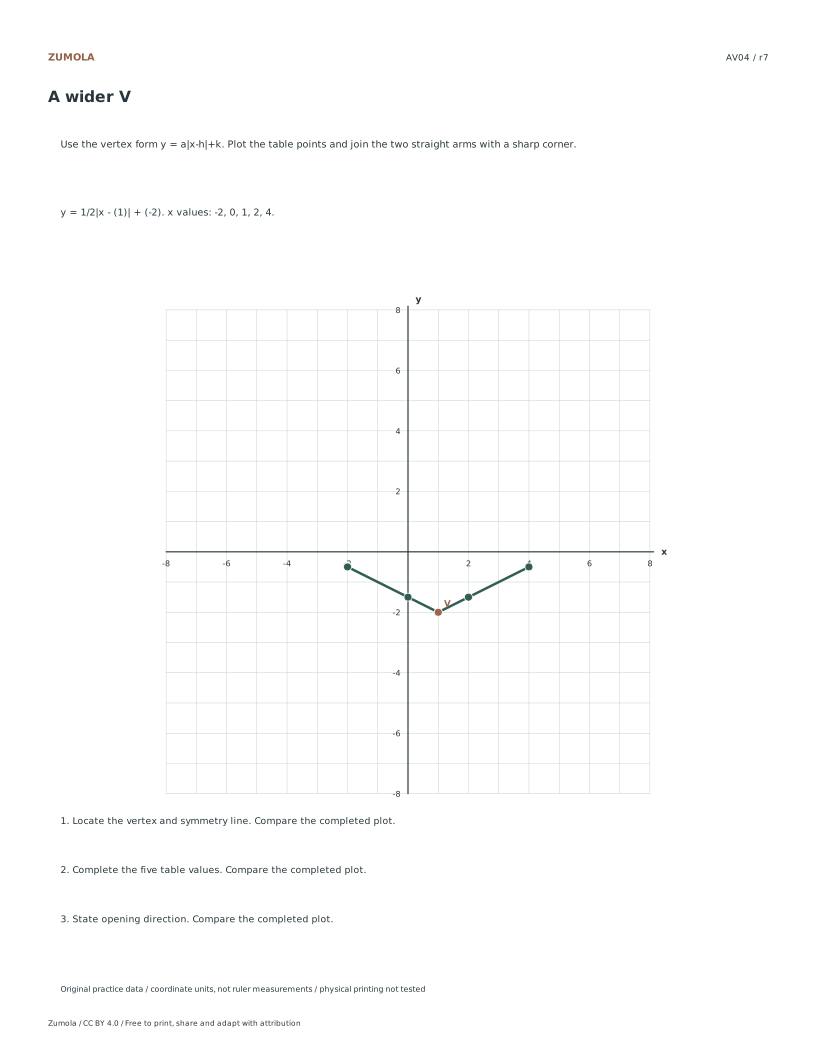
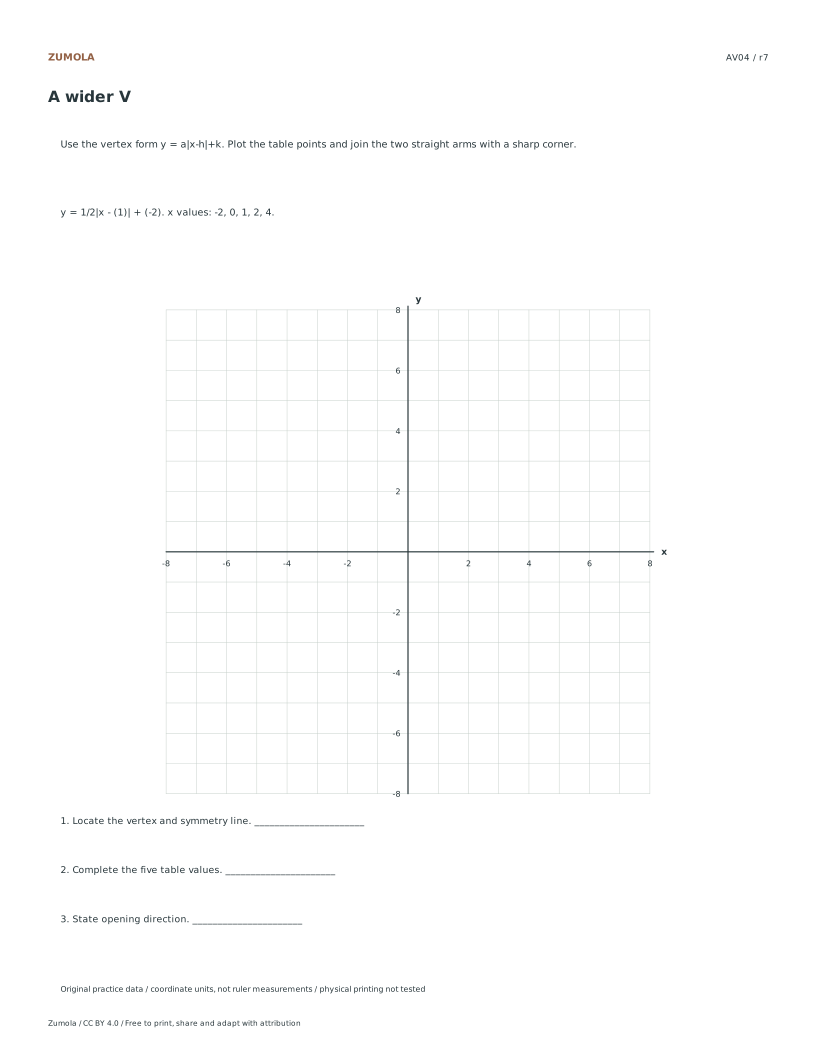
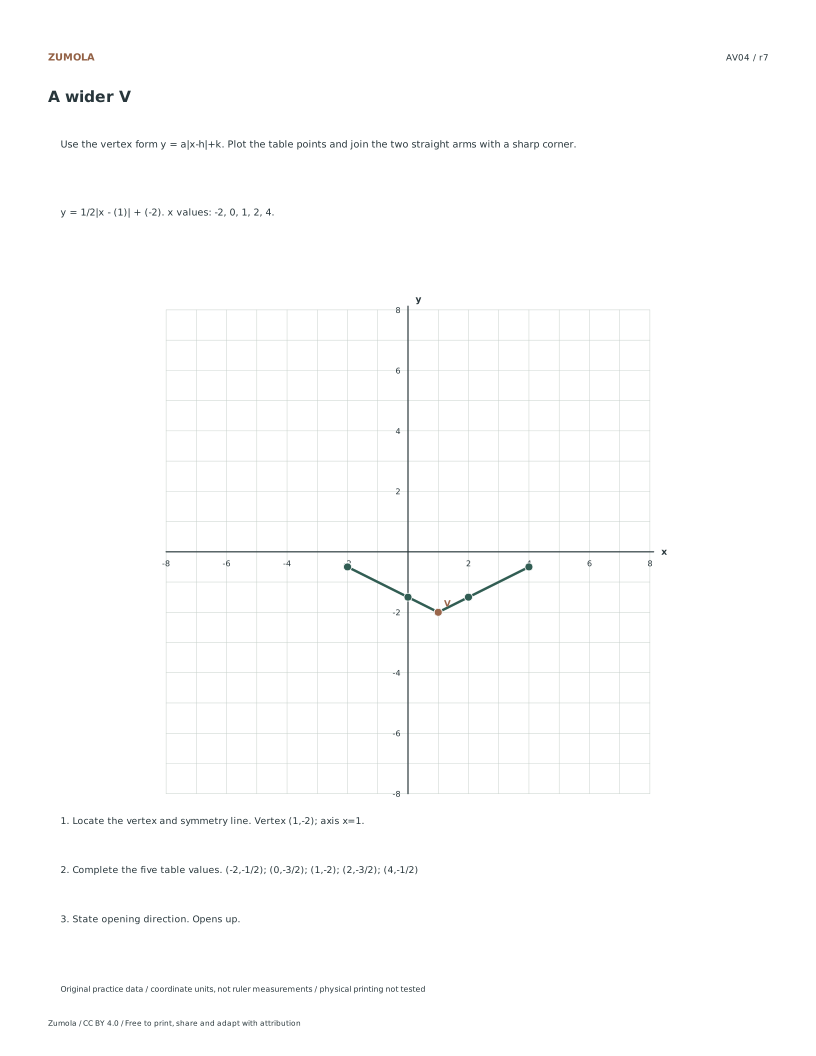
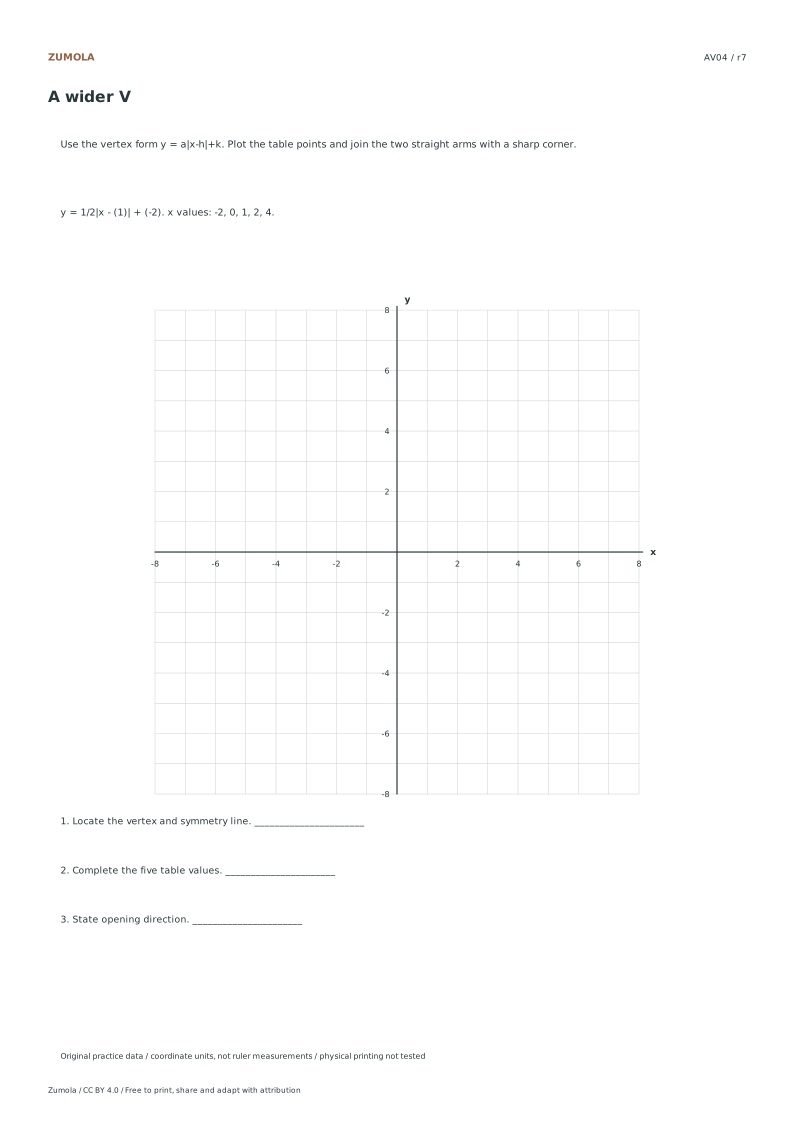
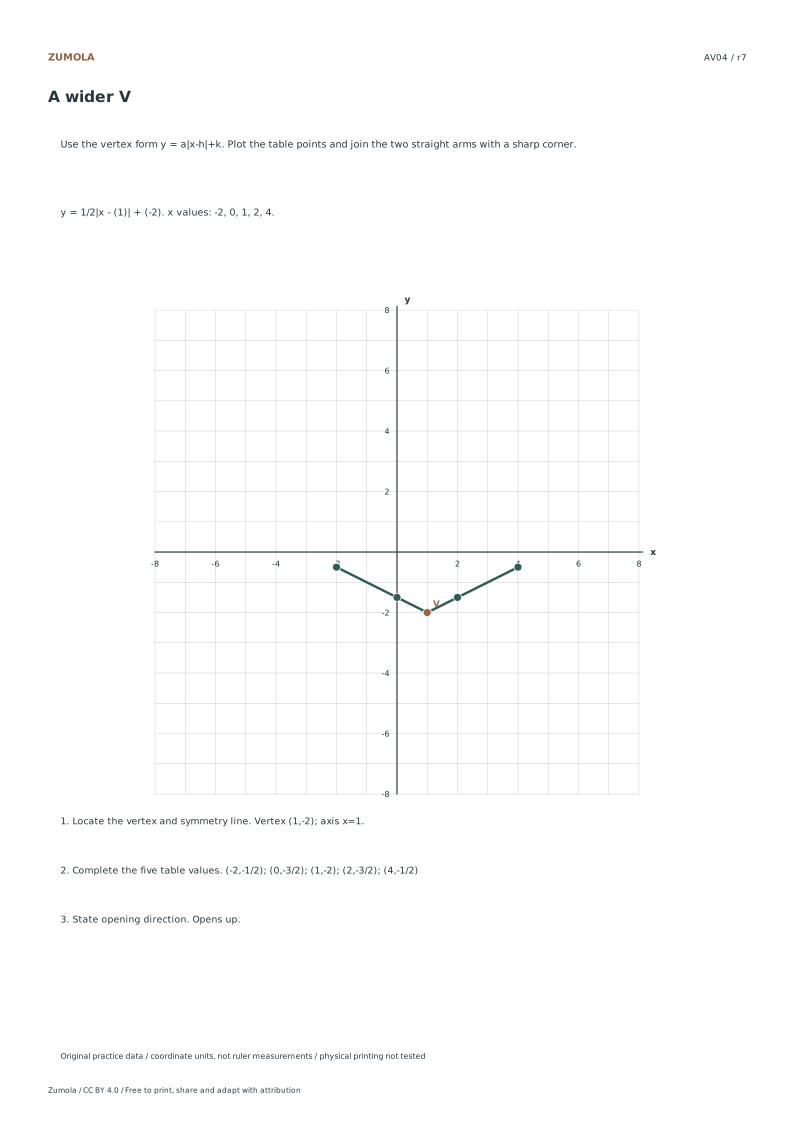
Adjust the width of the V by applying the coefficient a. For the wider V case, use a equals one half. This value stretches the graph vertically compared to the standard V. Calculate the y values using this factor. The vertex remains at one negative two. The inputs are negative two, zero, one, two, and four. Plot these calculated points. The graph will appear broader than the standard case. Do not use a physical ruler to estimate the width. Rely on the calculated coordinates. The negative sign in other cases flips the graph downward. Verify the shape matches the reference image. The scale factor directly controls the steepness of the lines.
Checks that catch common errors
Watch for
Check instead
Using a physical ruler to measure distances on the printed page to determine the vertex location.
Use the digital coordinates provided in the reference PDF to locate the vertex exactly on the grid.
Smoothing the corner at the vertex to make the graph look like a curve.
Plot a sharp corner at the vertex by connecting the straight lines directly at the calculated point.
Assuming the graph width is standard when the coefficient a is one half.
Apply the scale factor a equals one half to stretch the graph vertically, making it wider than the standard case.
Keep the labels and margins readable
Choose the PDF that matches your paper. Print at Actual size / 100% and turn off Fit, Shrink and browser headers. SVG is editable but an editor can rescale it; the PDF is the simpler print route. Physical printer, classroom and curriculum tests have not been completed.
Useful answers
Why is the vertex not the opposite sign of h?
Match the expression with x-h. In |x-2| the vertex x-coordinate is 2; in |x+2| it is -2.
Does a negative a change the vertex?
No. It changes the opening direction and makes the vertex a maximum, but h and k still locate the corner.
Should I join the V with a curve?
No. Plot the samples, then use two straight arms with the correct slopes.
Are the answer files and editable graphs free?
Yes. The individual student, reference and answer files plus collection packs are free without signup. Credit Zumola under CC BY 4.0 when sharing or adapting.
Optional Google Analytics helps us understand which free resources are useful. It is off until you allow it. Drawing tools and downloads work with either choice. Privacy details