Free graphing resources · Original practice
Graphing systems of equations.
Look for the shared solution.
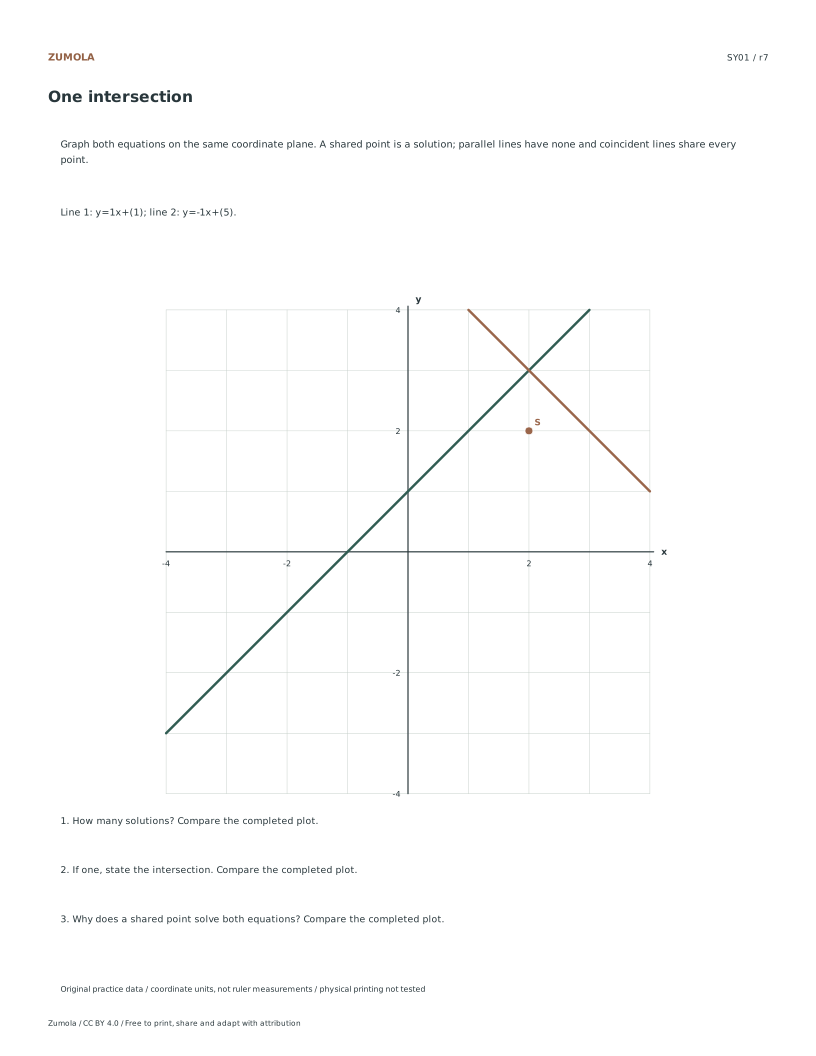
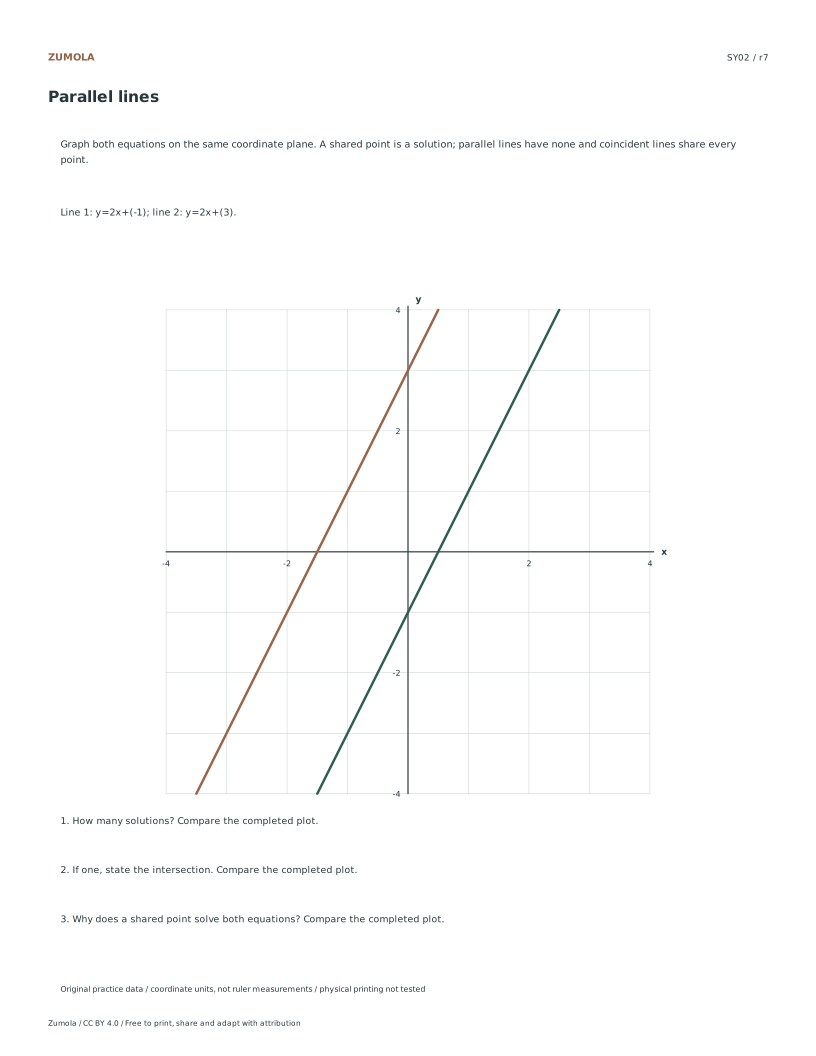
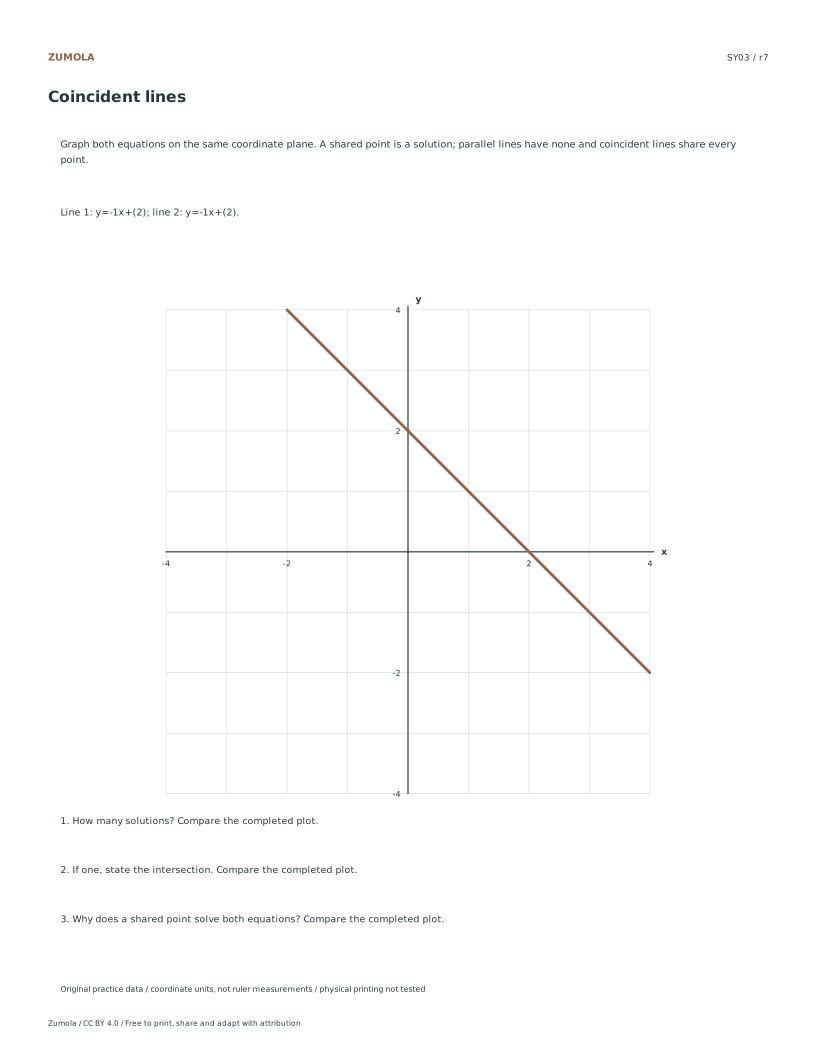
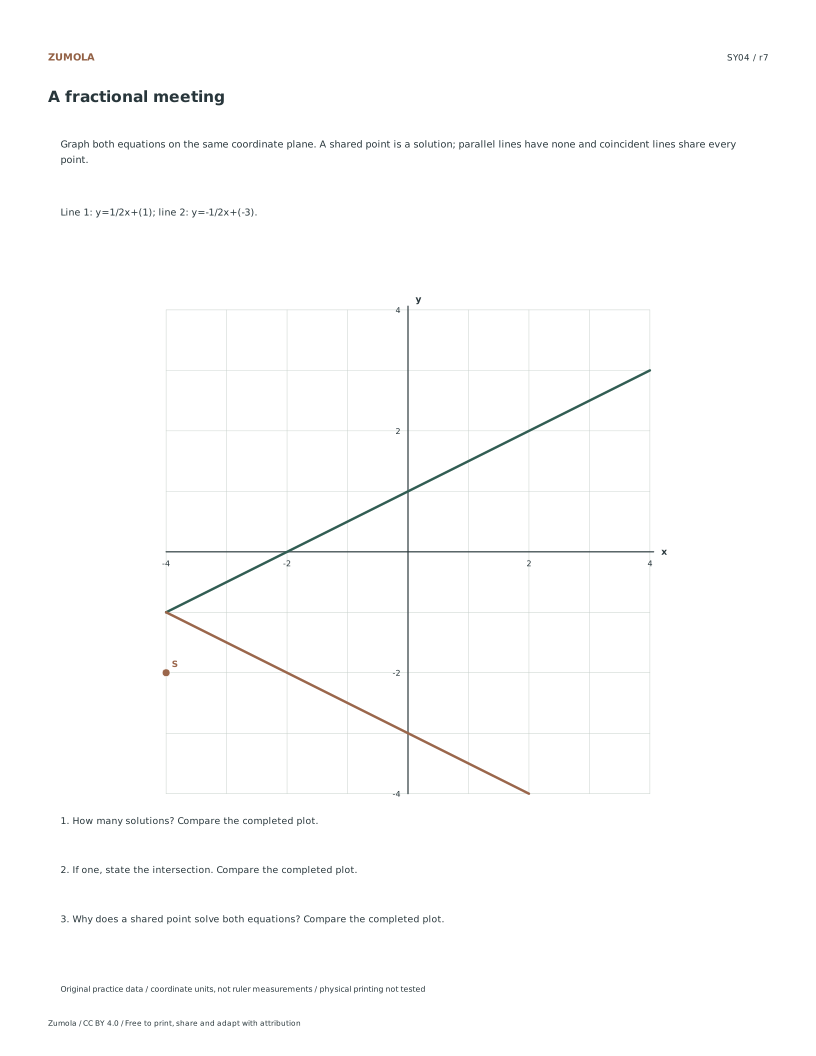
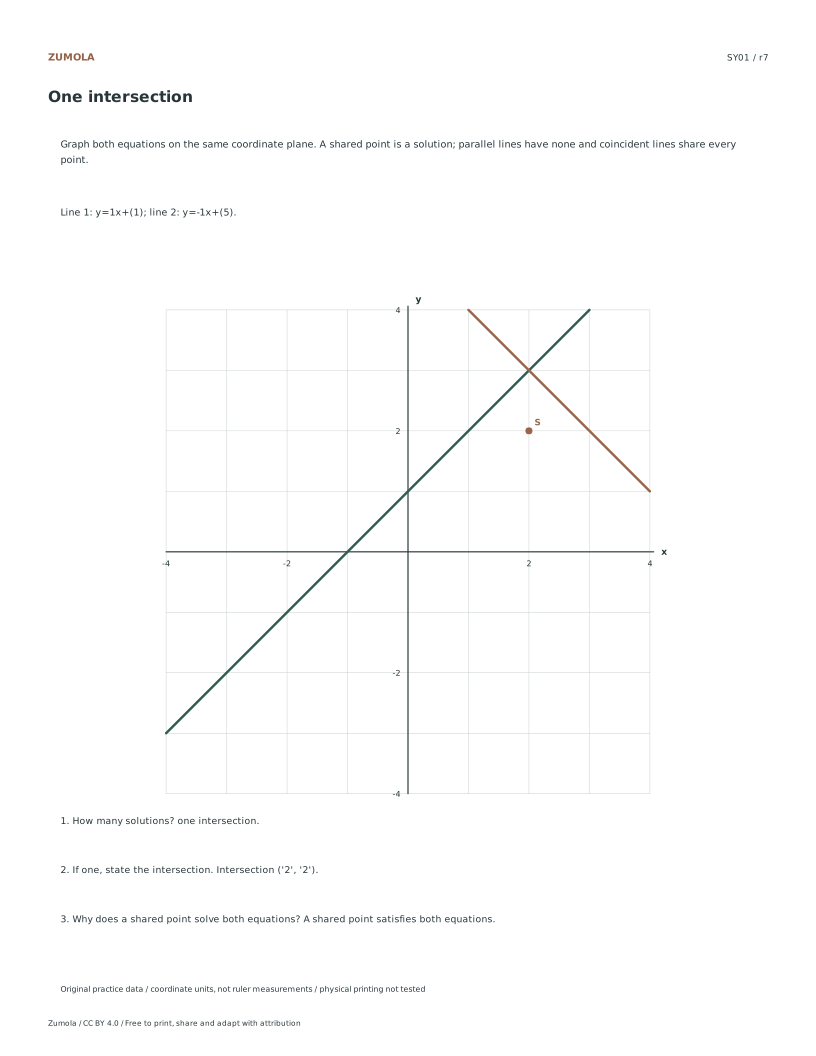
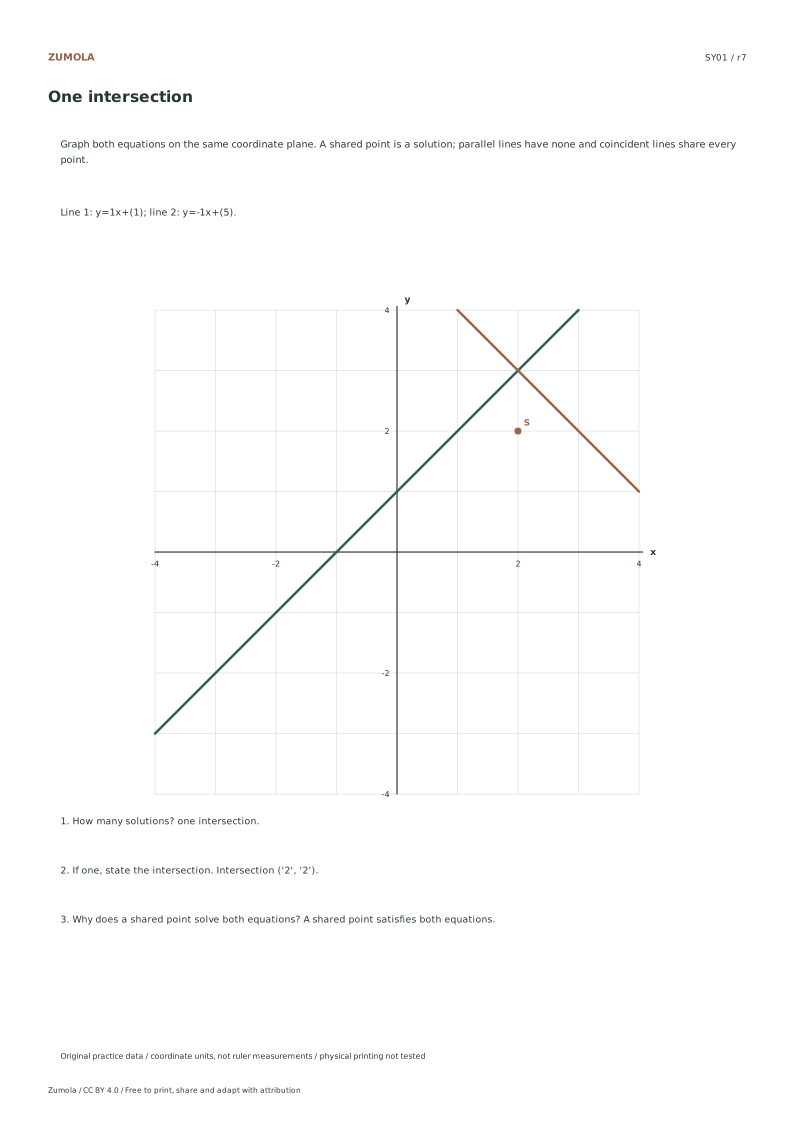
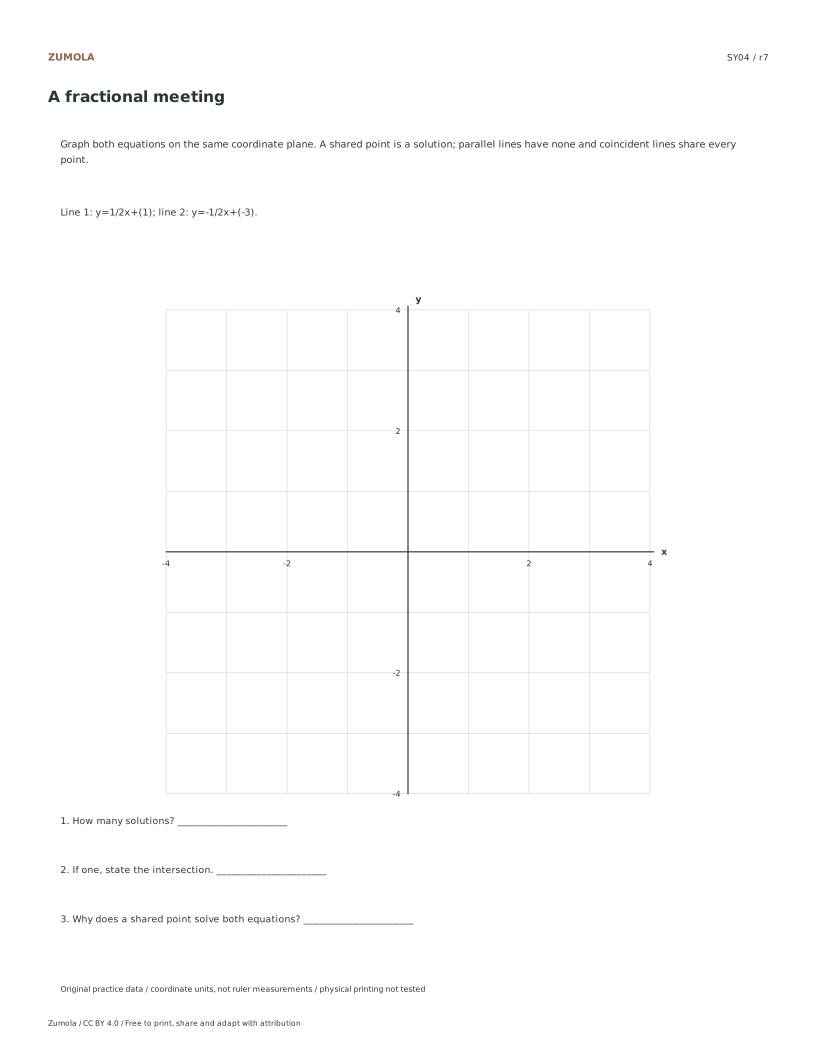
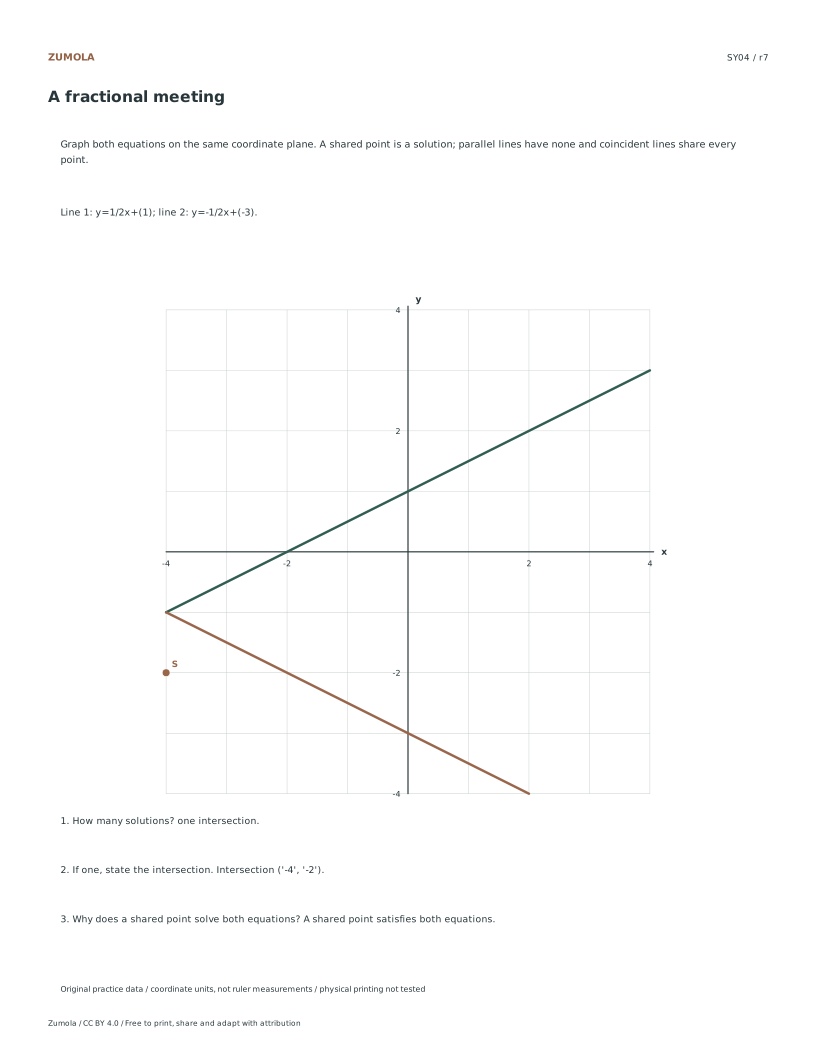
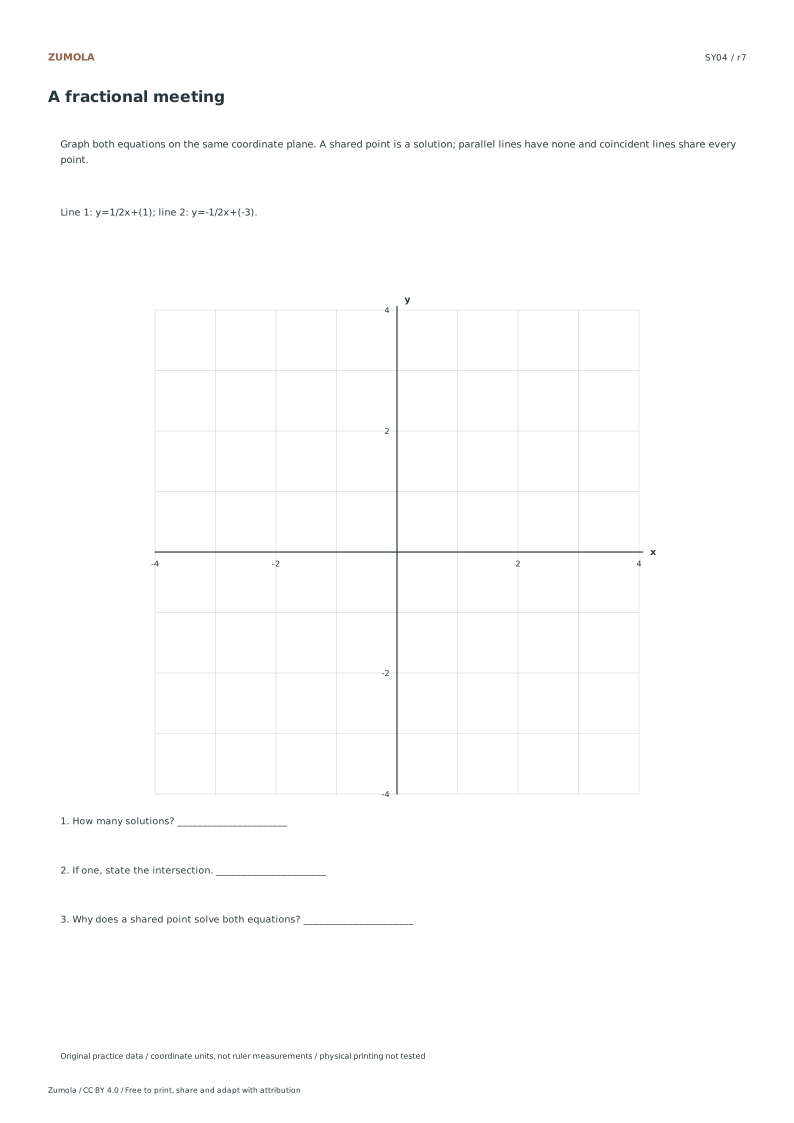
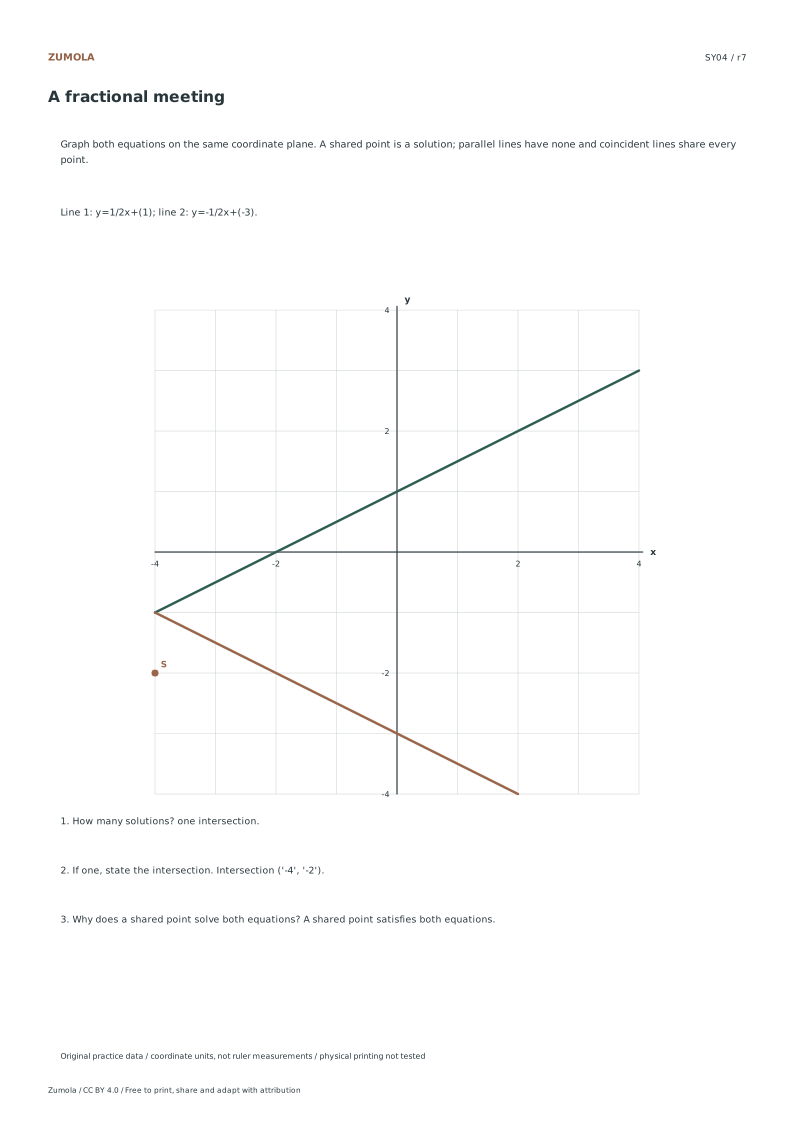
Graph four pairs of lines and classify one intersection, no solution or infinitely many solutions. State the shared ordered pair when one exists.
4 systems.
One, none or infinitely many.
More ways to practice
Predict first, then plot
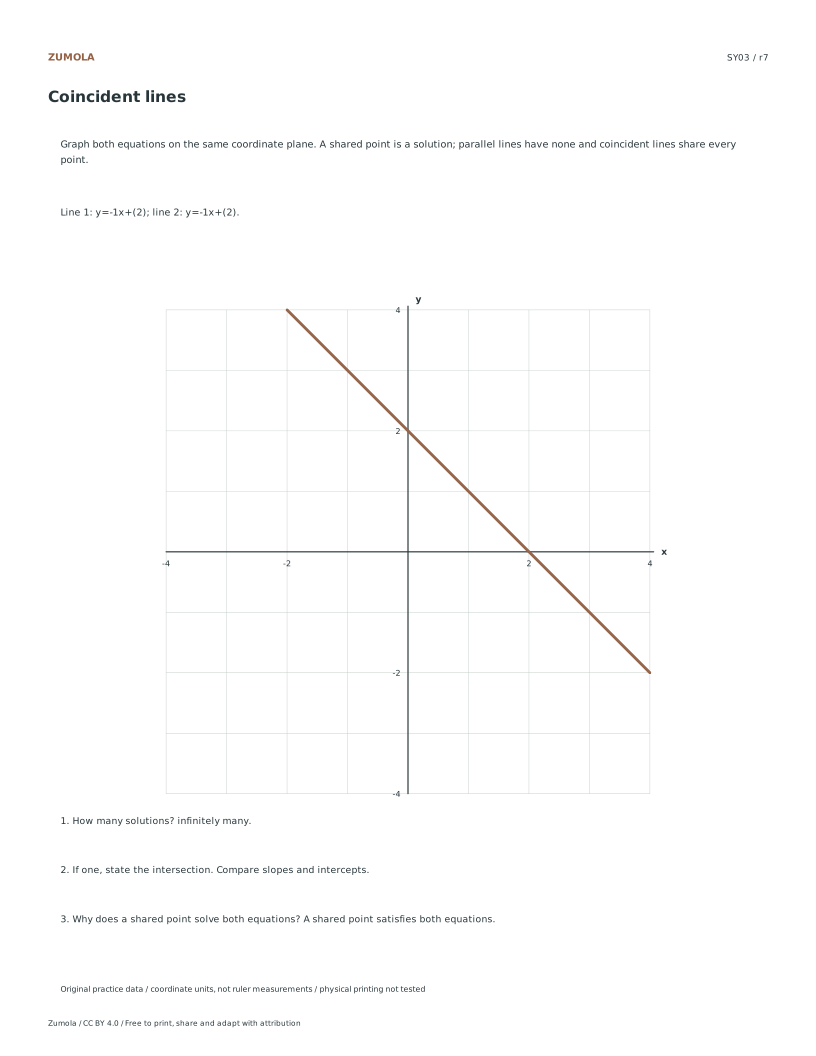
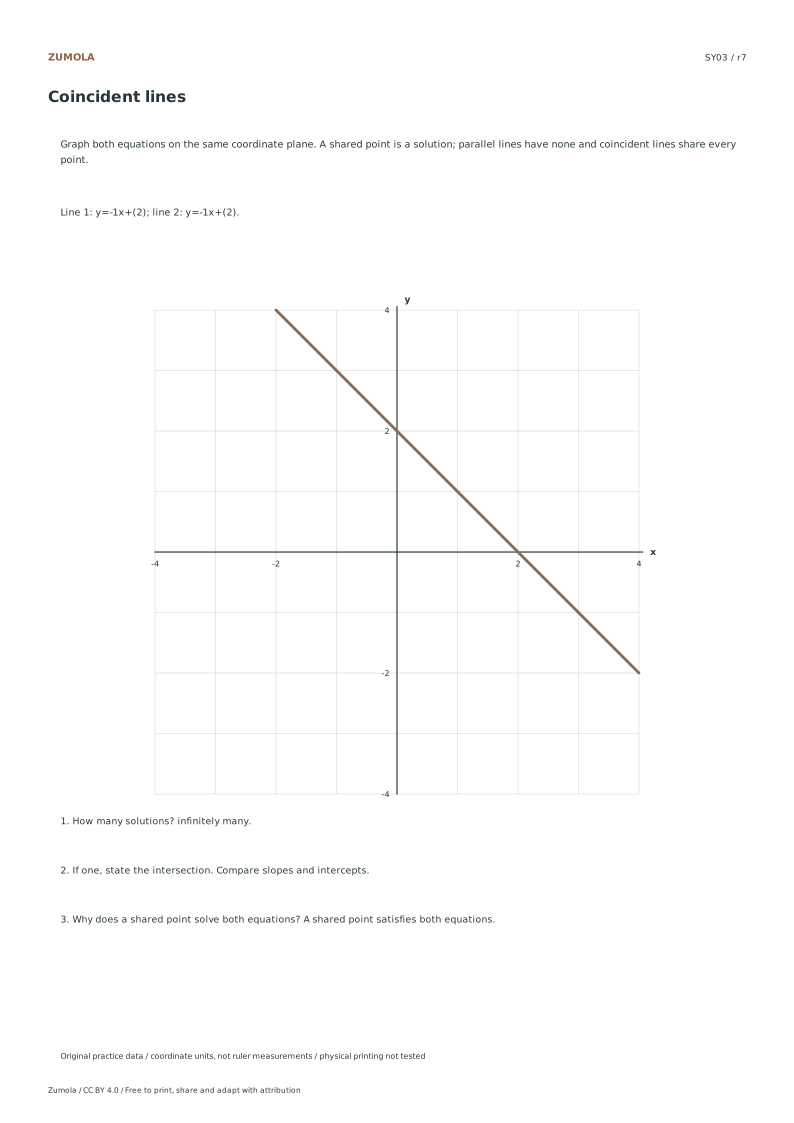
Before drawing, solve each equation for y and record the slope m and y-intercept b. Different slopes guarantee exactly one intersection. Equal slopes with different intercepts give parallel lines and no shared point. Equal slopes with the same intercept describe the same line, so every point on it satisfies both equations.
This prediction catches errors before they reach the graph. If plotted lines appear to cross but the slopes are equal, either the drawing or the equation reading is wrong. If slopes differ but the lines look parallel, check intercept placement and the scale of each axis. Write the prediction beside the graph so the drawing can be audited against it.
- Rewrite each equation as y = mx + b and record m and b.
- Compare slopes: different slopes mean one intersection; equal slopes require comparing intercepts.
- Plot each line from its y-intercept plus at least one second point found by the slope.
- Label each line with its equation.
- Read the intersection and verify it by substituting into both original equations.
A new worked case with a fractional meeting
Consider y = 2x + 1 and y = -2x + 3. The slopes 2 and -2 differ, so the lines meet exactly once. Setting the expressions equal gives 2x + 1 = -2x + 3, so 4x = 2 and x = 0.5. Substituting gives y = 2(0.5) + 1 = 2. The shared ordered pair is (0.5, 2), which sits halfway between grid lines.
Plot (0, 1) and (1, 3) for the first line, and (0, 3) and (1, 1) for the second. The crossing at (0.5, 2) is not a lattice point, so label it with the fraction or decimal rather than rounding to a nearby grid intersection. Substitute (0.5, 2) into both equations: 2(0.5) + 1 = 2 and -2(0.5) + 3 = 2. Both hold, confirming the pair.
- Solve algebraically for x before plotting when the intersection may be fractional.
- Mark the exact crossing with a fraction or decimal label, not an eyeballed grid point.
- Substitute the fractional pair into both original equations to confirm equality.
- If the graph suggests a different point, recheck slope direction and axis scale.
Visible window and domain cautions
A graph shows only the portion of each line drawn on the page. Two lines that appear not to meet may still intersect outside the visible window. Extend each line to the grid edge before concluding there is no solution, and remember that parallel lines never meet regardless of window size.
If a task restricts the domain, such as x between 0 and 5, the intersection counts only when it lies inside that interval. State the domain assumption explicitly. A crossing at x = 6 is outside a 0 to 5 domain even though the full lines intersect there.
- Extend both lines to the grid edges before classifying.
- Check whether any stated domain or range excludes the intersection.
- Record the domain assumption next to the classification.
Try this example
Classify and solve y = 3x - 2 and y = 3x + 5, then state the shared point if one exists.
Show the worked explanation
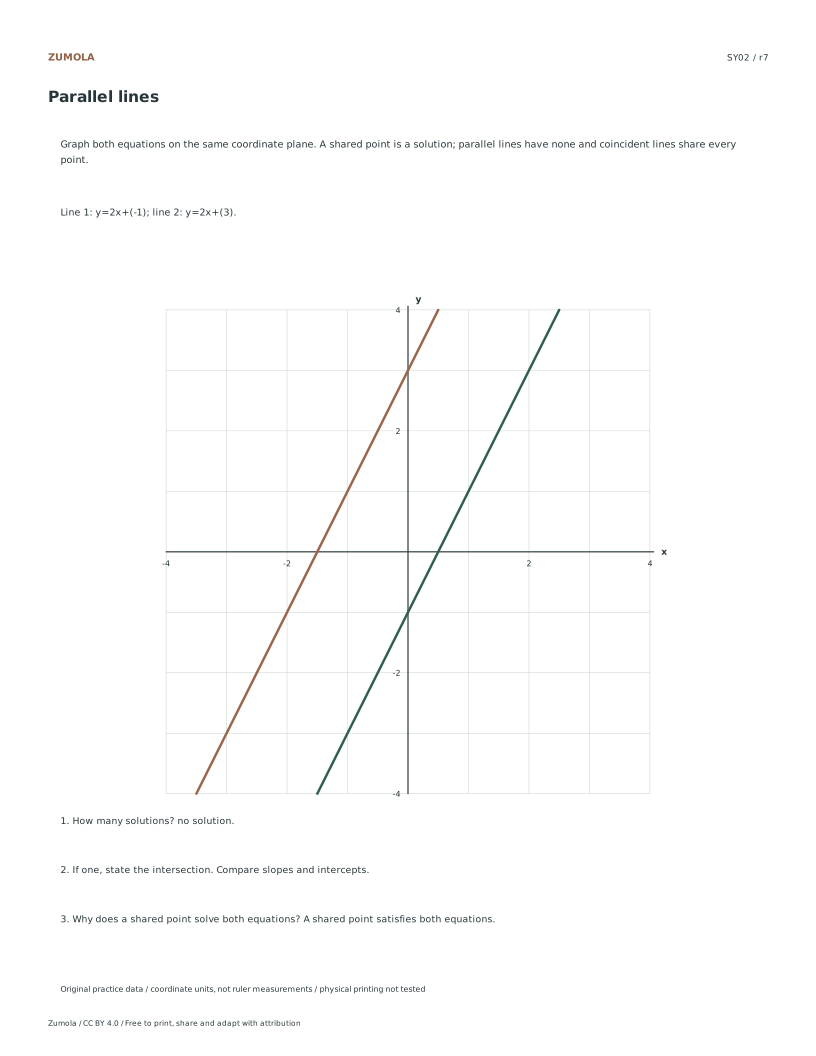
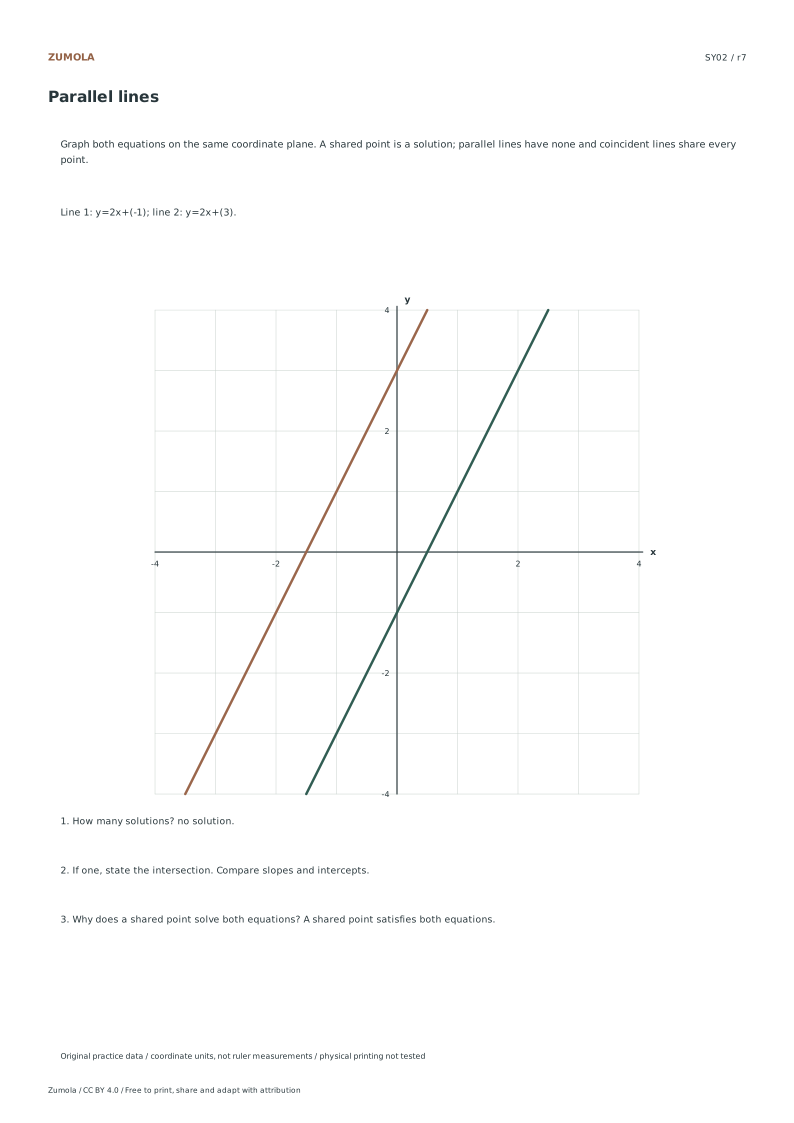
Both equations have slope 3. The intercepts are -2 and 5, which differ, so the lines are parallel and never meet. There is no solution and no shared ordered pair. A graph should show two lines rising at the same rate, separated vertically by 7 units at every x-value.
Common mistakes
- Classifying lines as parallel because they look close on a small grid. Compare slopes in slope-intercept form; equal slopes with different intercepts confirm parallel lines regardless of appearance.
- Rounding a fractional intersection to the nearest grid point. Solve algebraically for exact x and y, label the crossing with the fraction or decimal, and verify by substitution.
- Declaring no solution when the drawn segments do not meet on the page. Extend both lines to the grid boundary and compare slopes before concluding; intersections may lie outside the visible window.
Check your work
- Each equation is rewritten in slope-intercept form with slope and intercept recorded.
- The classification follows from comparing slopes and intercepts, not from appearance alone.
- Lines are plotted with at least two labeled points each and extended to the grid edges.
- Any intersection is stated exactly and verified by substitution into both original equations.
- Domain or range restrictions are stated when they affect whether the intersection counts.
Questions before you start
How can I tell one solution from infinitely many before graphing?
Rewrite both equations in slope-intercept form. Different slopes give one solution; equal slopes with equal intercepts give infinitely many; equal slopes with different intercepts give none.
What if the intersection falls between grid lines?
Solve the system algebraically to get the exact fraction or decimal, mark that position, and substitute the pair into both equations to confirm it.
Does a restricted domain change the classification?
Yes. The lines may intersect outside the stated domain, so the system has no valid solution within that interval even though the full lines cross somewhere.