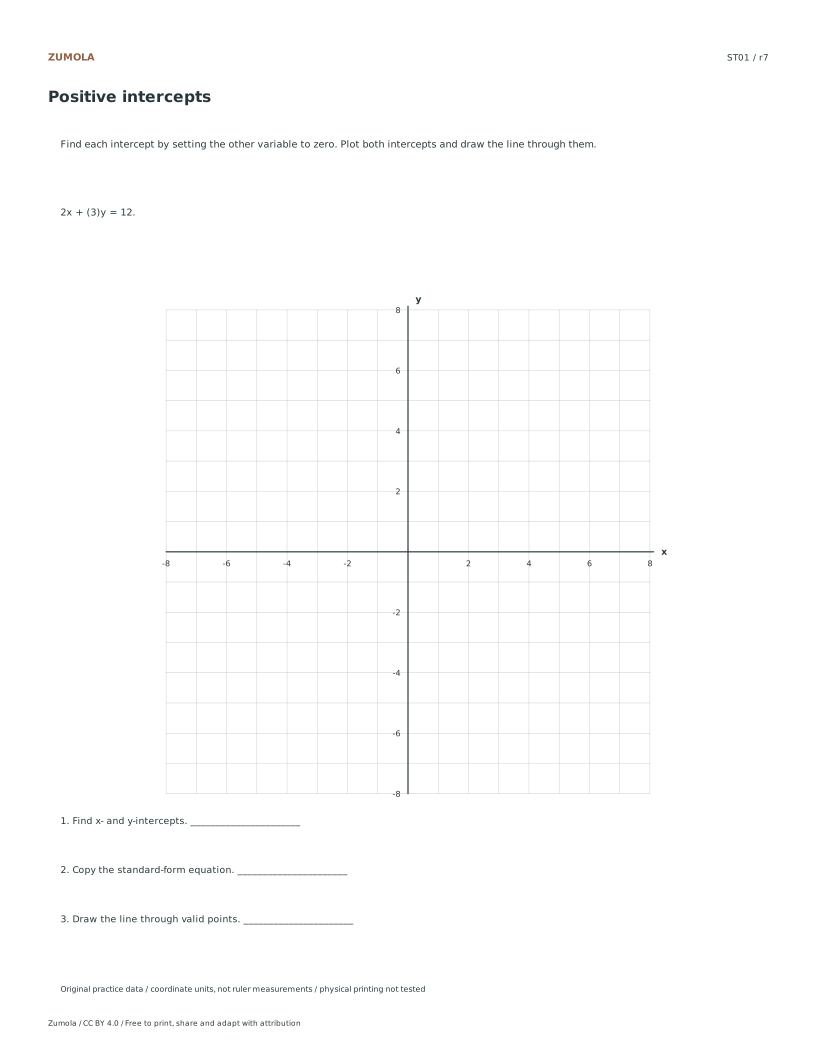
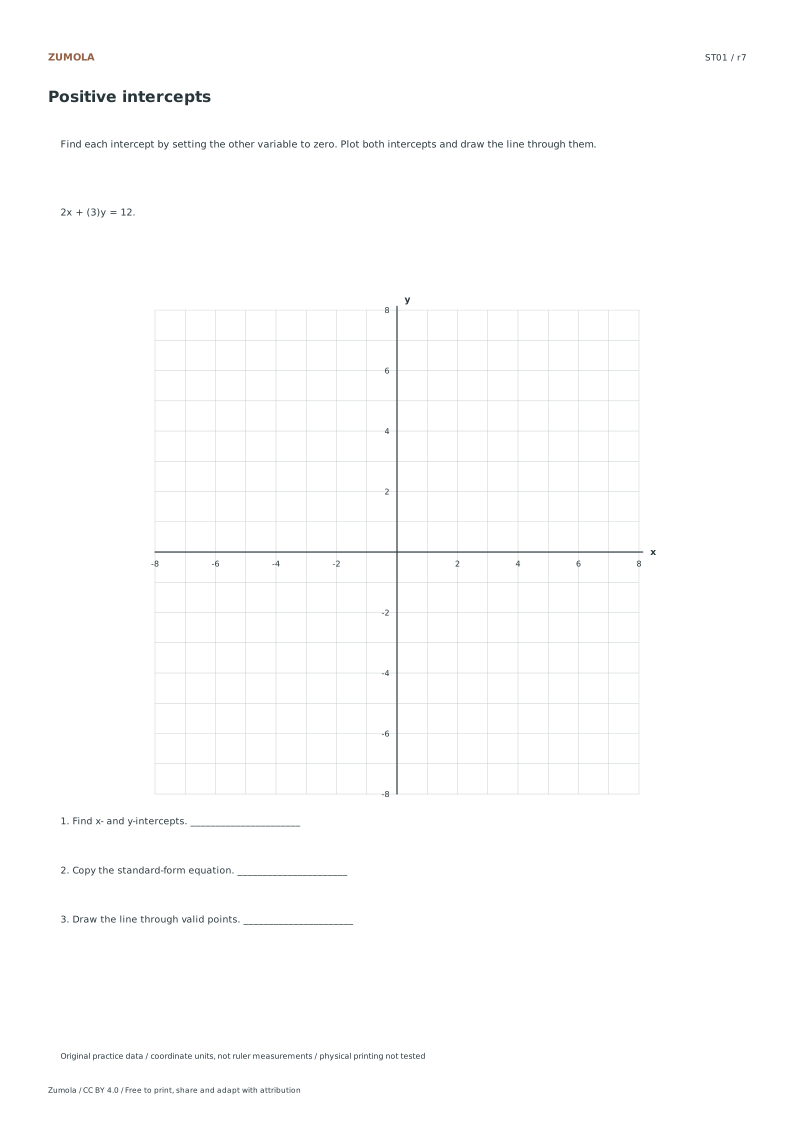
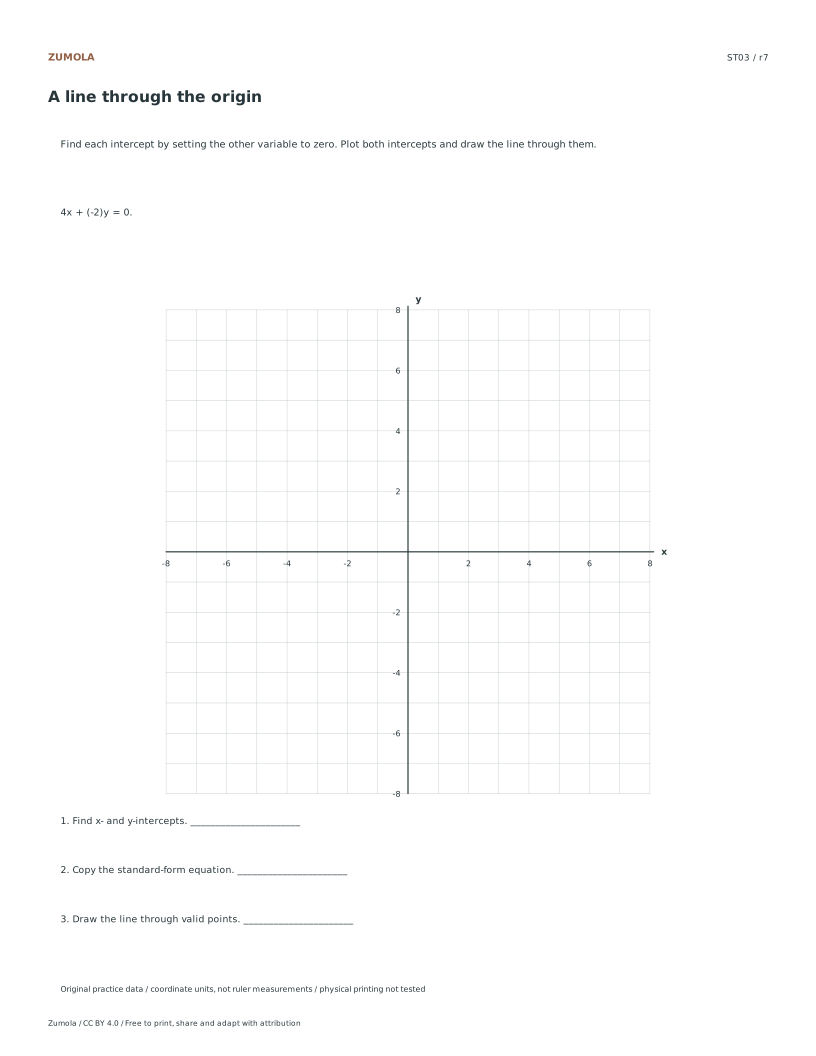
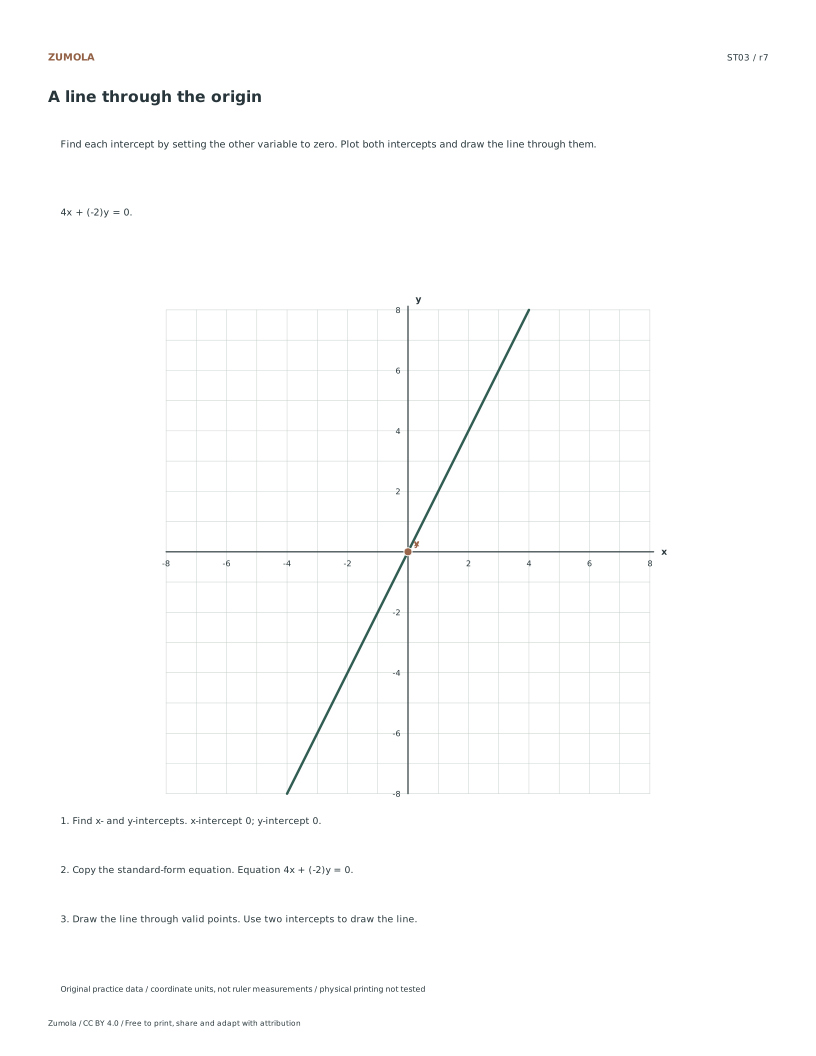
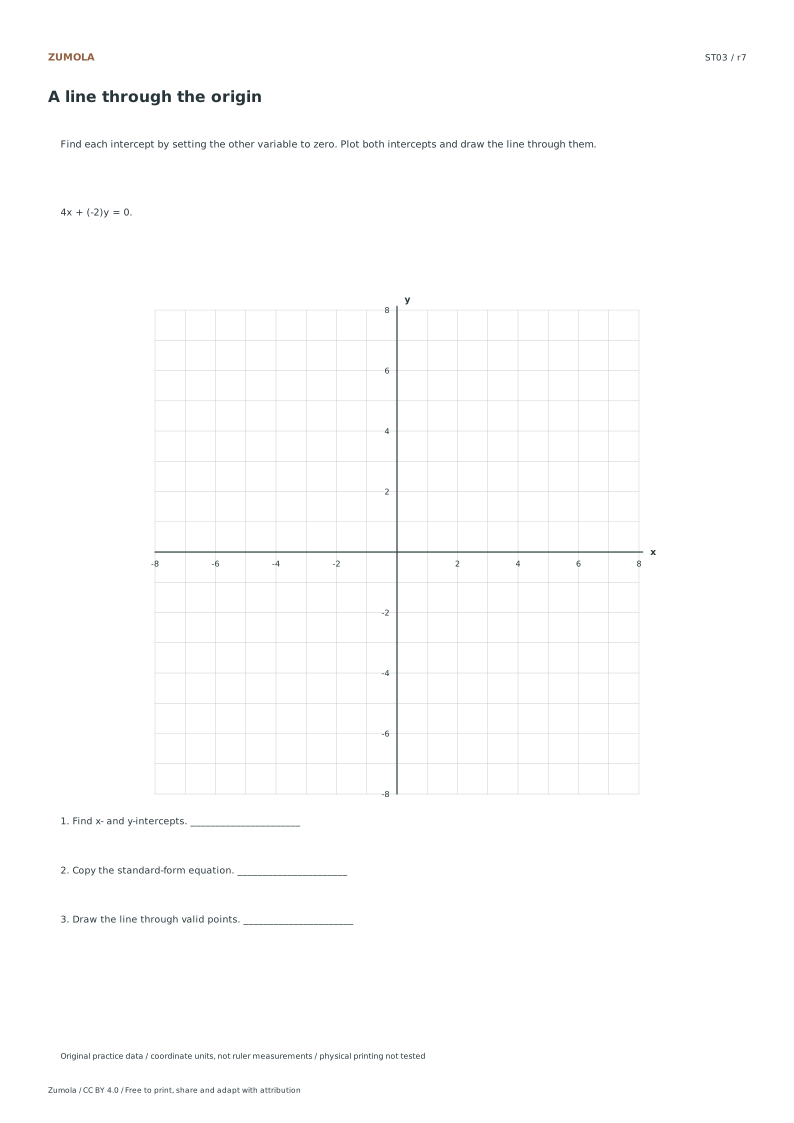
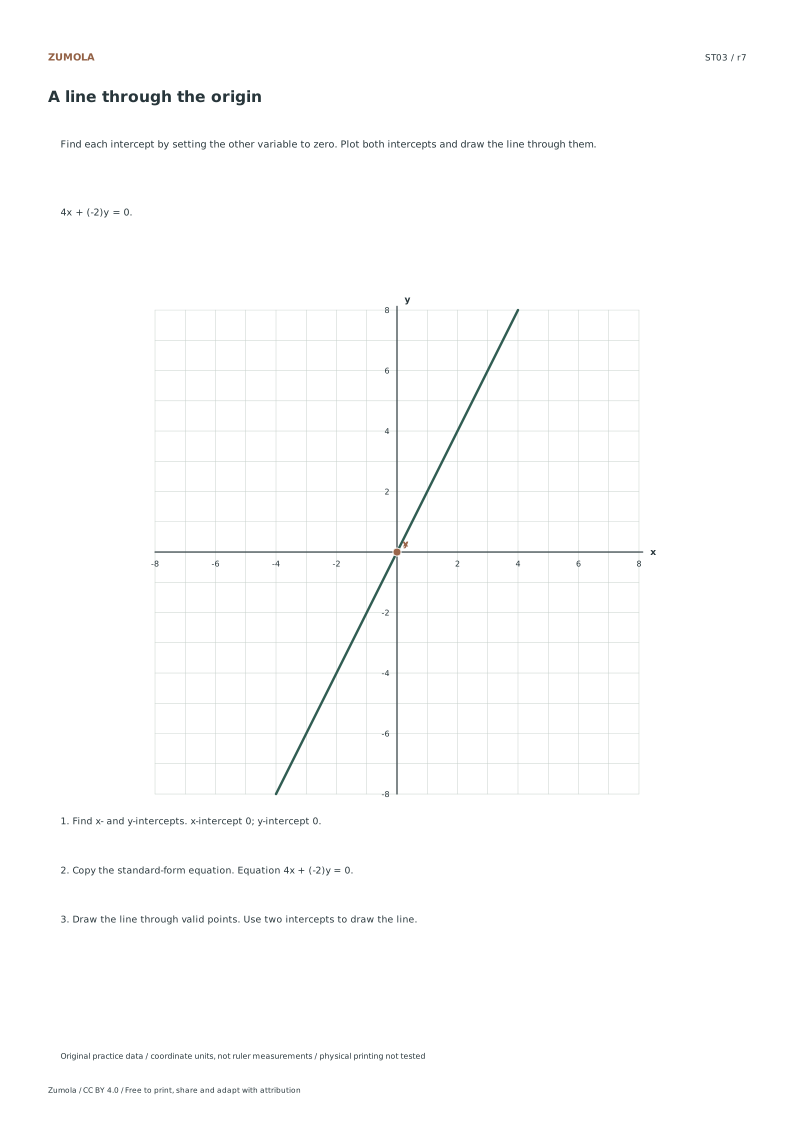
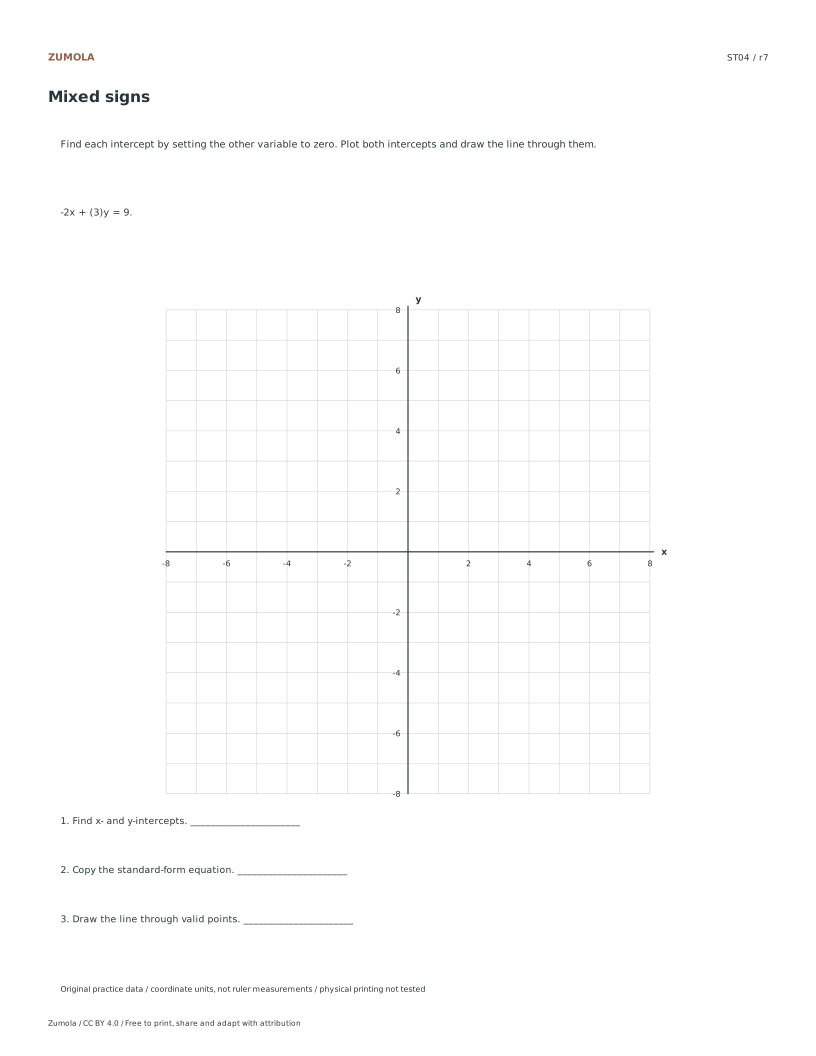
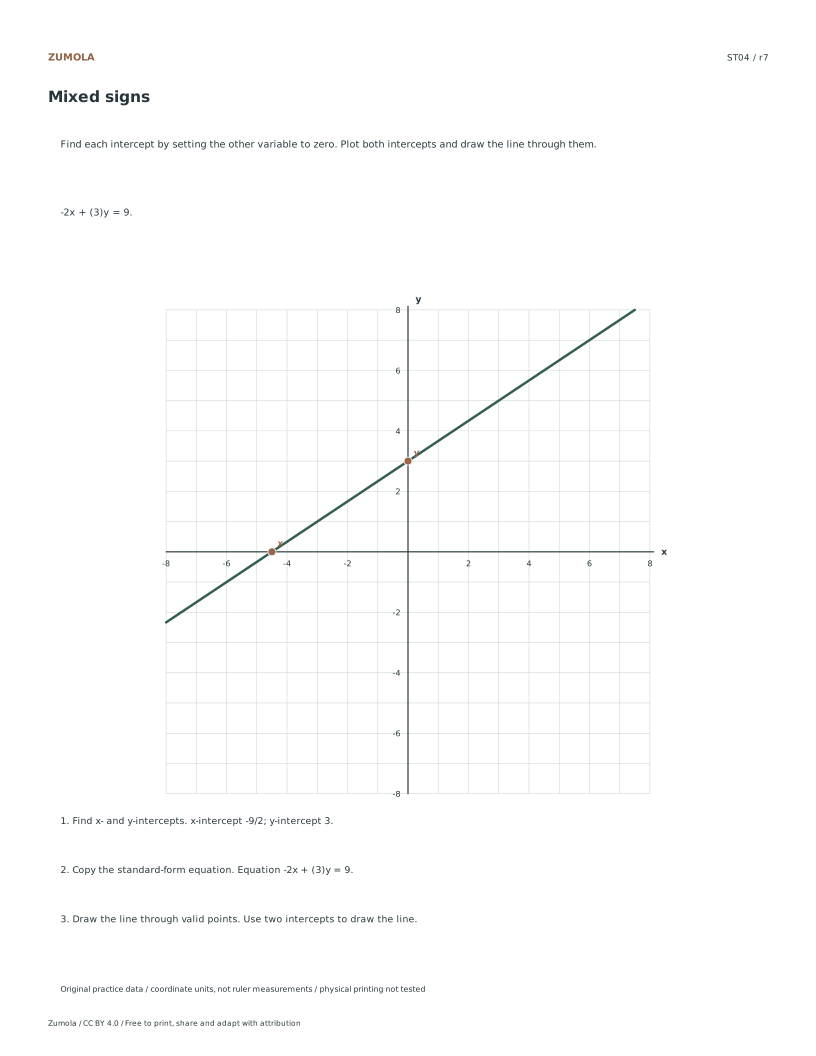
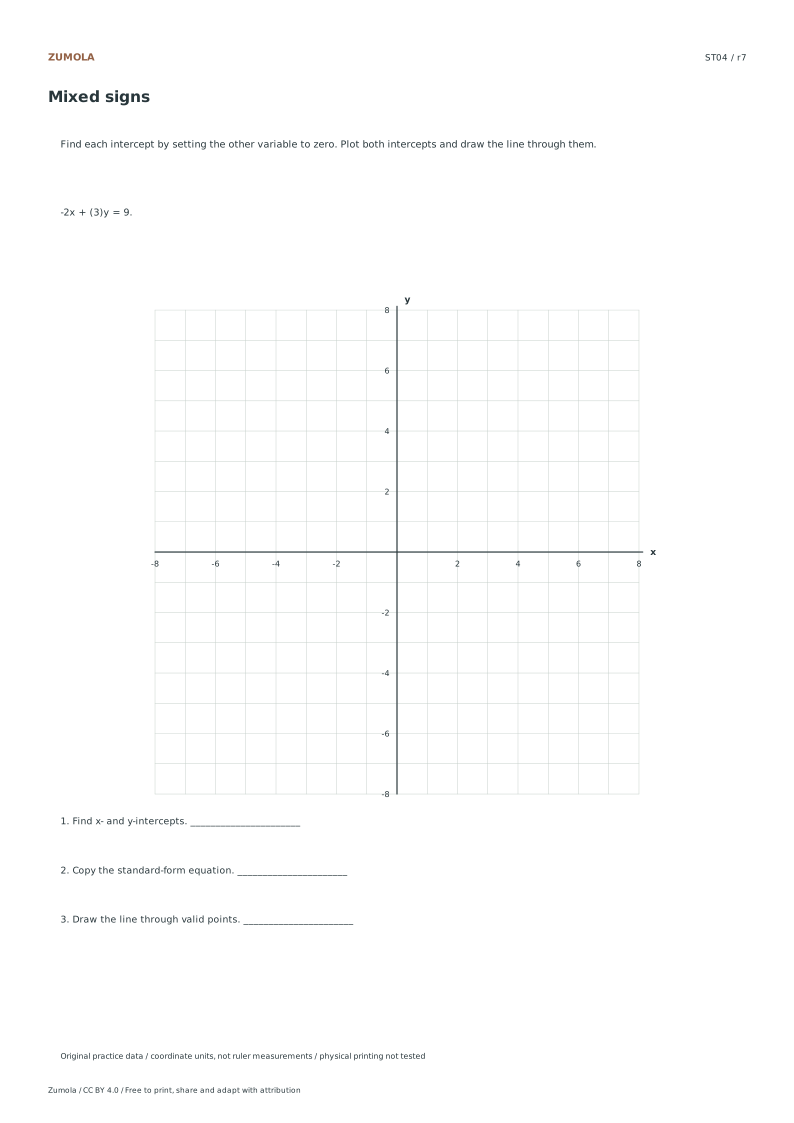
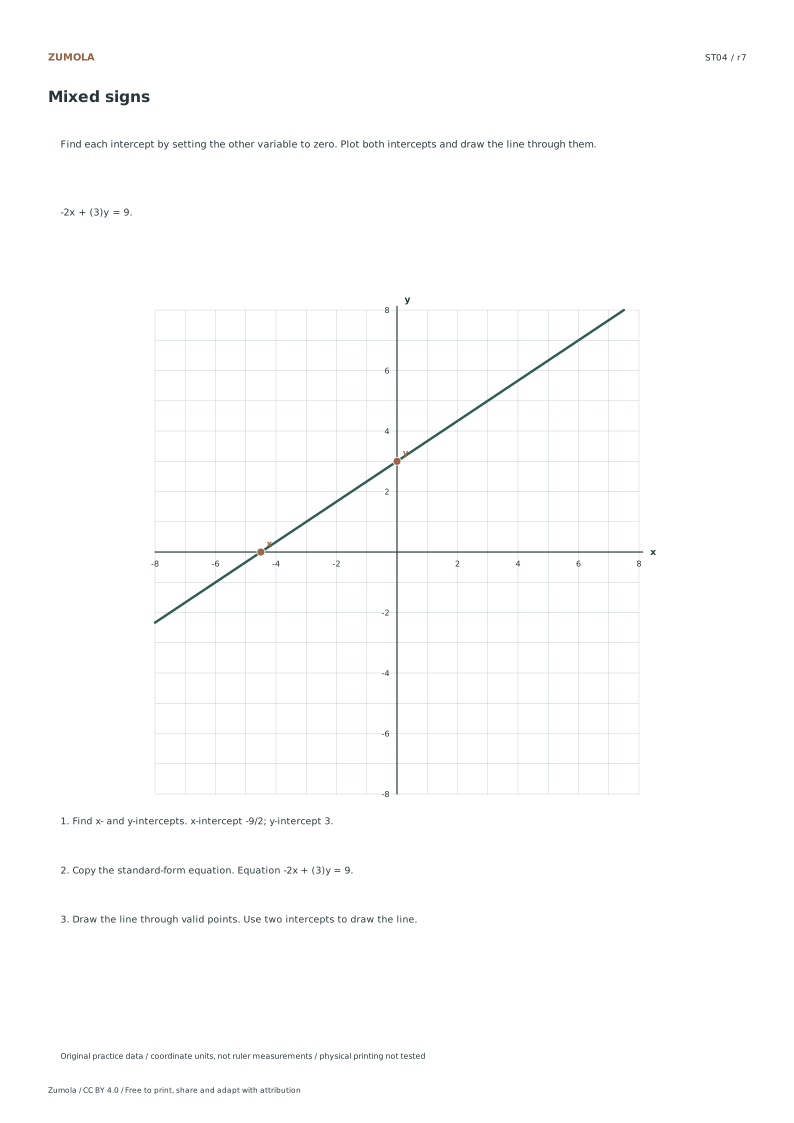
Graph four lines from standard-form equations by finding x- and y-intercepts. Keep zero and negative intercepts as valid coordinates.
Choose Letter or A4, then download a student sheet first. Keep the separate reference or answer file closed until you have attempted the case. Every worksheet, SVG and answer is free without signup.
Choose your paper and download
Download paper size
Every worksheet and answer is free. No signup.
Free original resourceST01
Positive intercepts
Original worksheet collection. Letter or A4 PDF and editable SVG.
All examples use original fictional data and coordinate units. They are practice material, not measured classroom results, published questions or evidence about real people.
Check the first case
ST01: Positive intercepts
Check
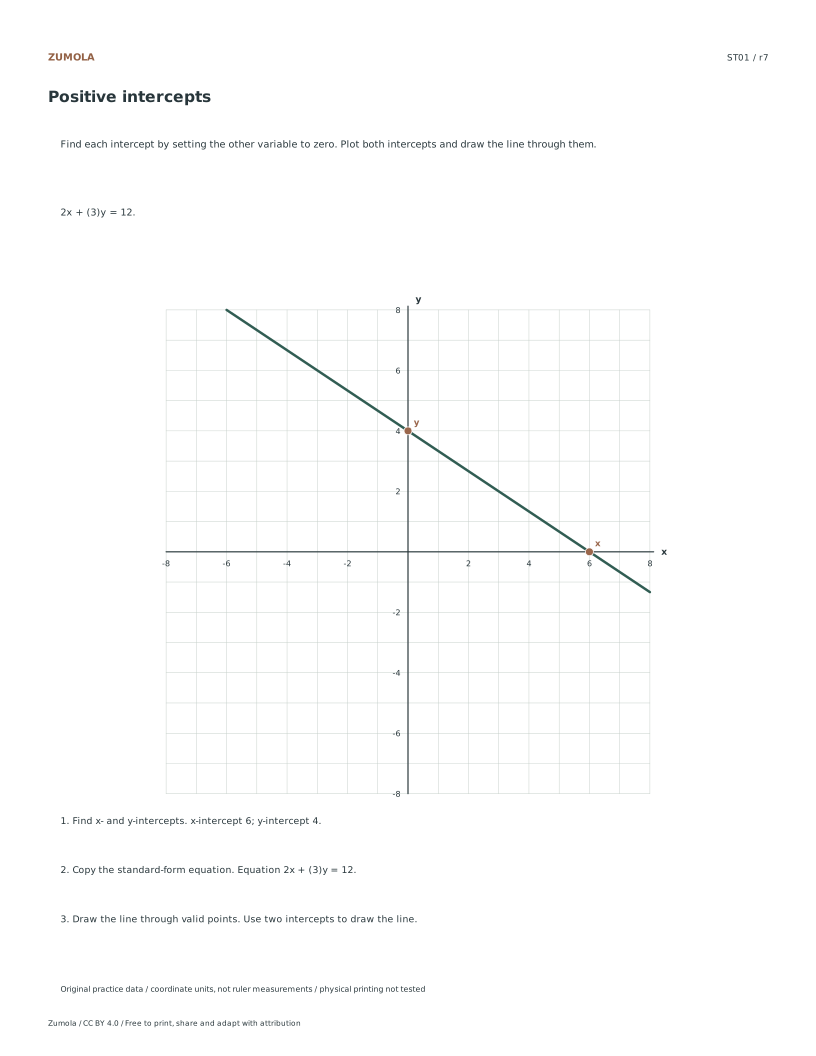
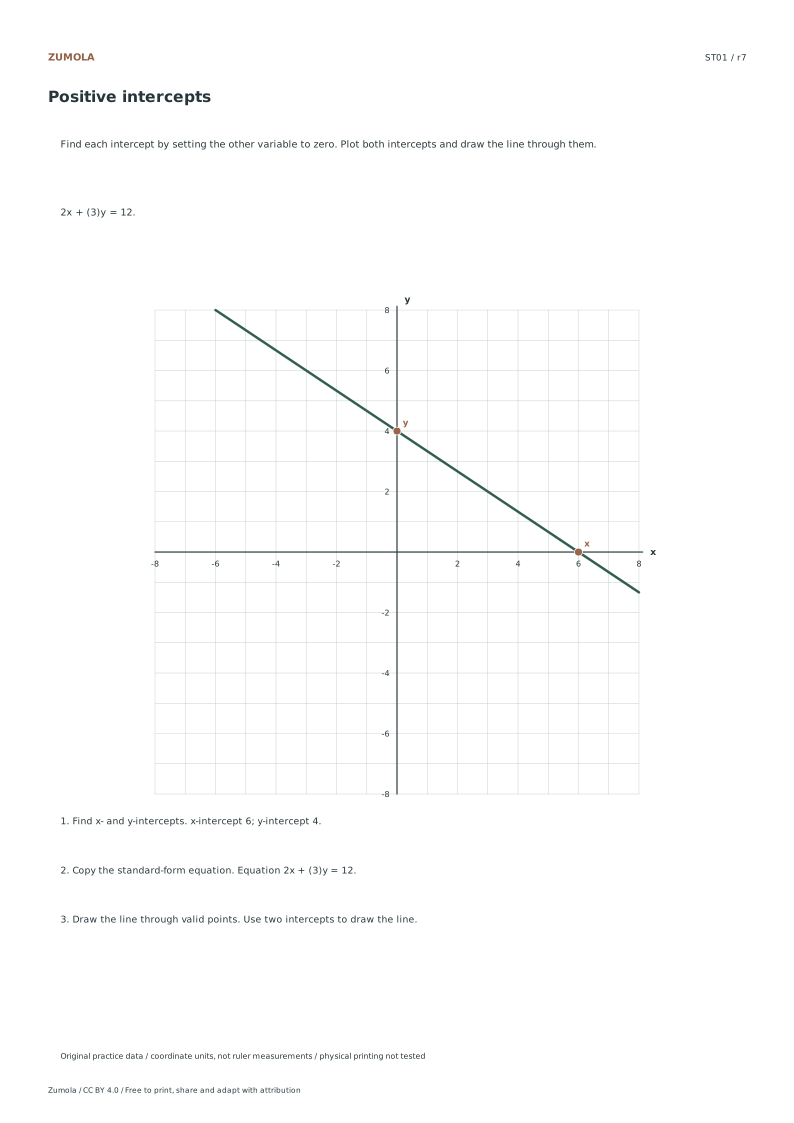
Worked result
1
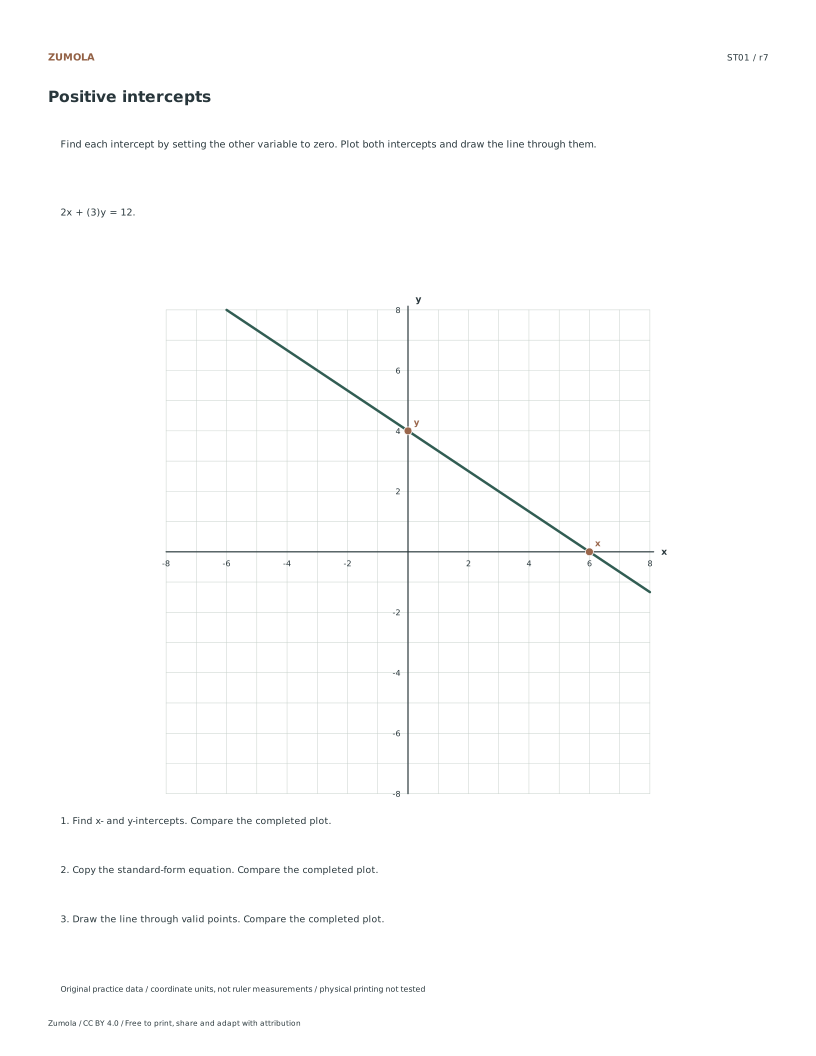
x-intercept 6; y-intercept 4.
2
Equation 2x + (3)y = 12.
3
Use two intercepts to draw the line.
The first case shows the checking pattern. Individual answer files contain the completed graph and result for every case.
Work through the graph
Calculating the X-Intercept
Begin by identifying the specific linear equation provided in the resource, such as the example with coefficients two and three equaling twelve. To locate the x-intercept, substitute zero for the variable y in the equation. Solve the resulting arithmetic expression to determine the numerical value of x. This calculated value represents the horizontal coordinate where the line crosses the axis. Record this number precisely as it will serve as one of the two anchor points needed for drawing. Ensure you use the exact equation supplied in the listed file rather than estimating from any visual representation of the line.
Calculating the Y-Intercept
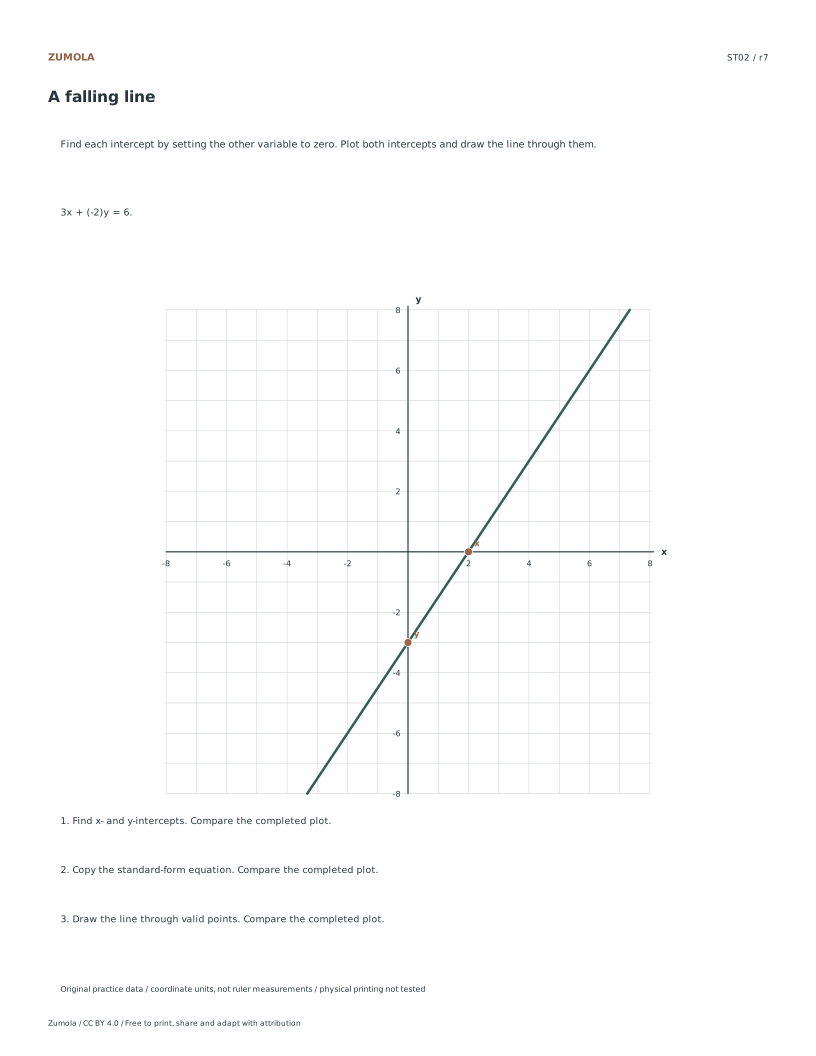
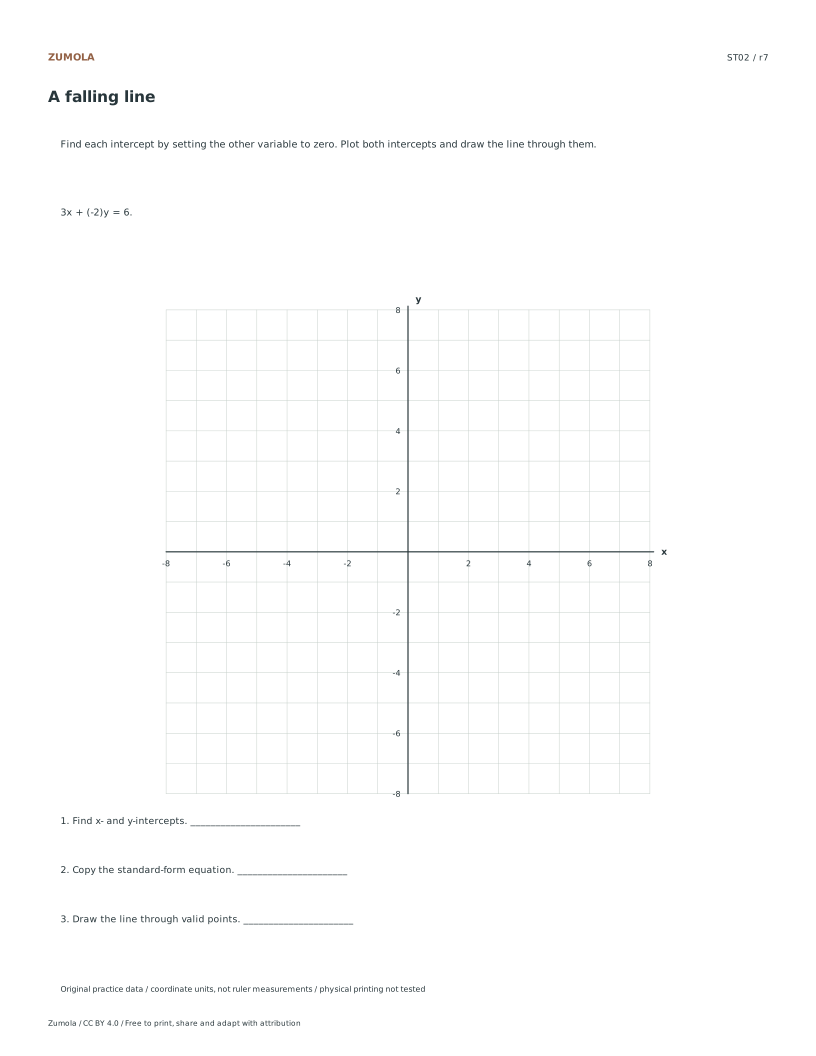
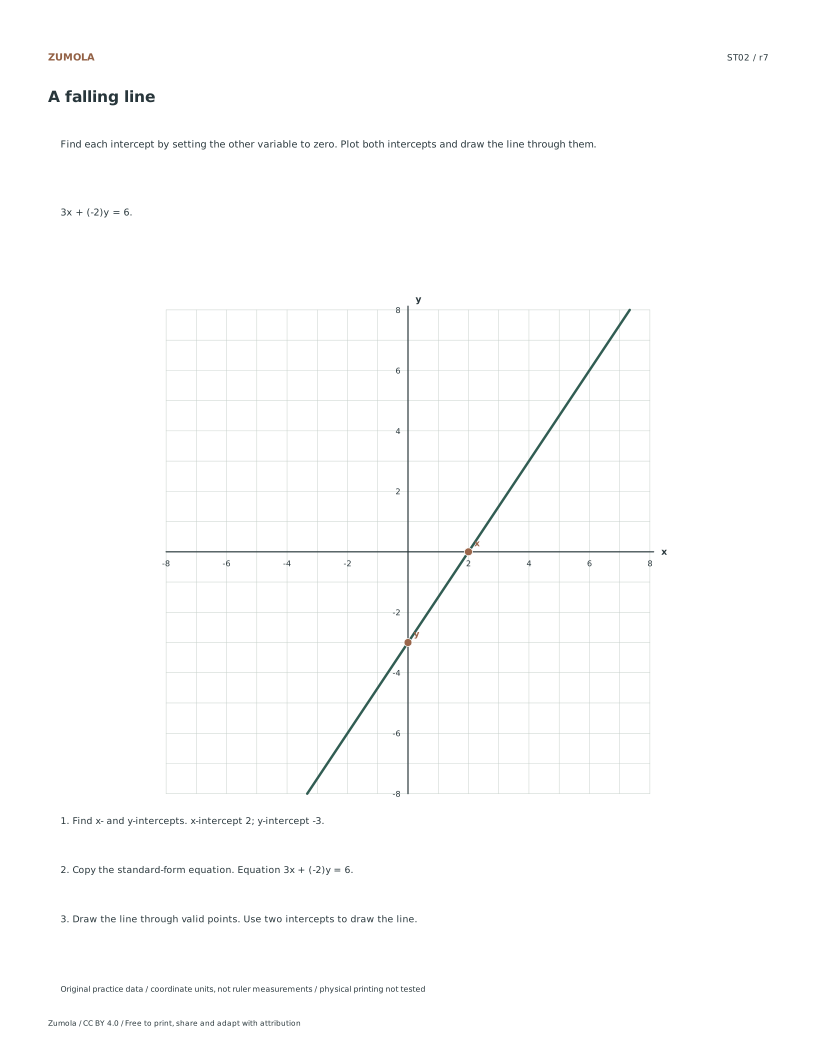
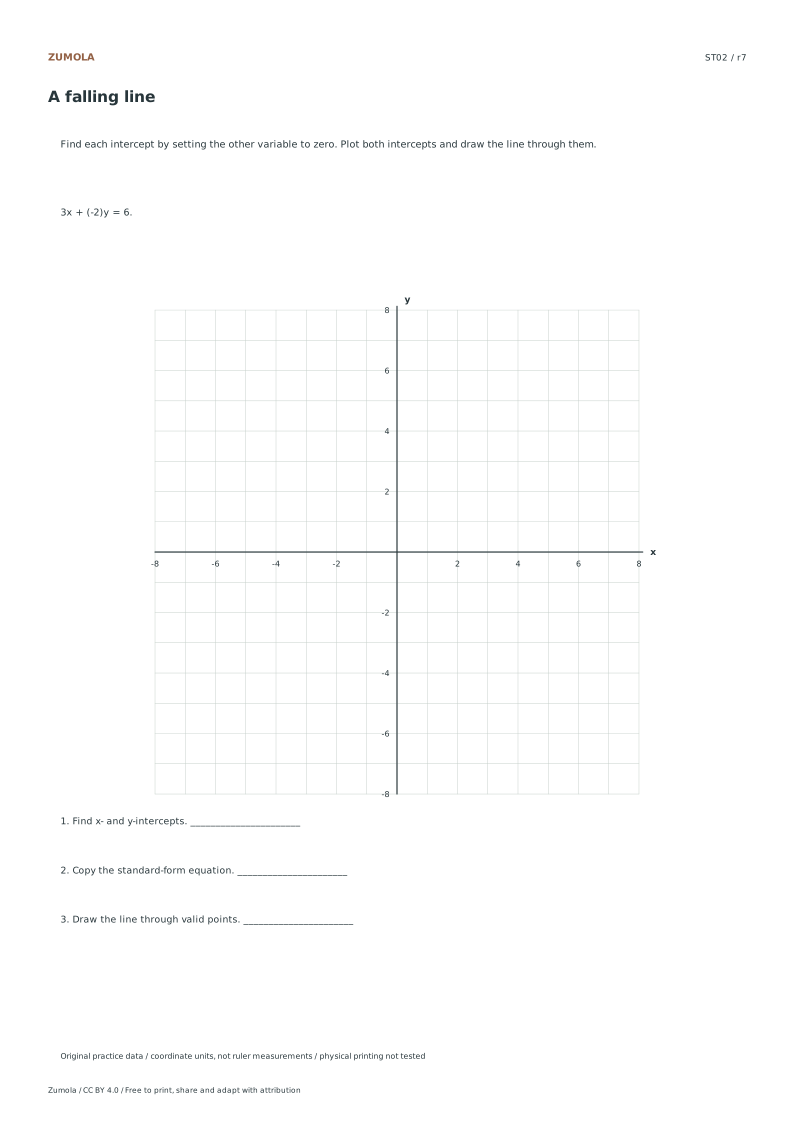
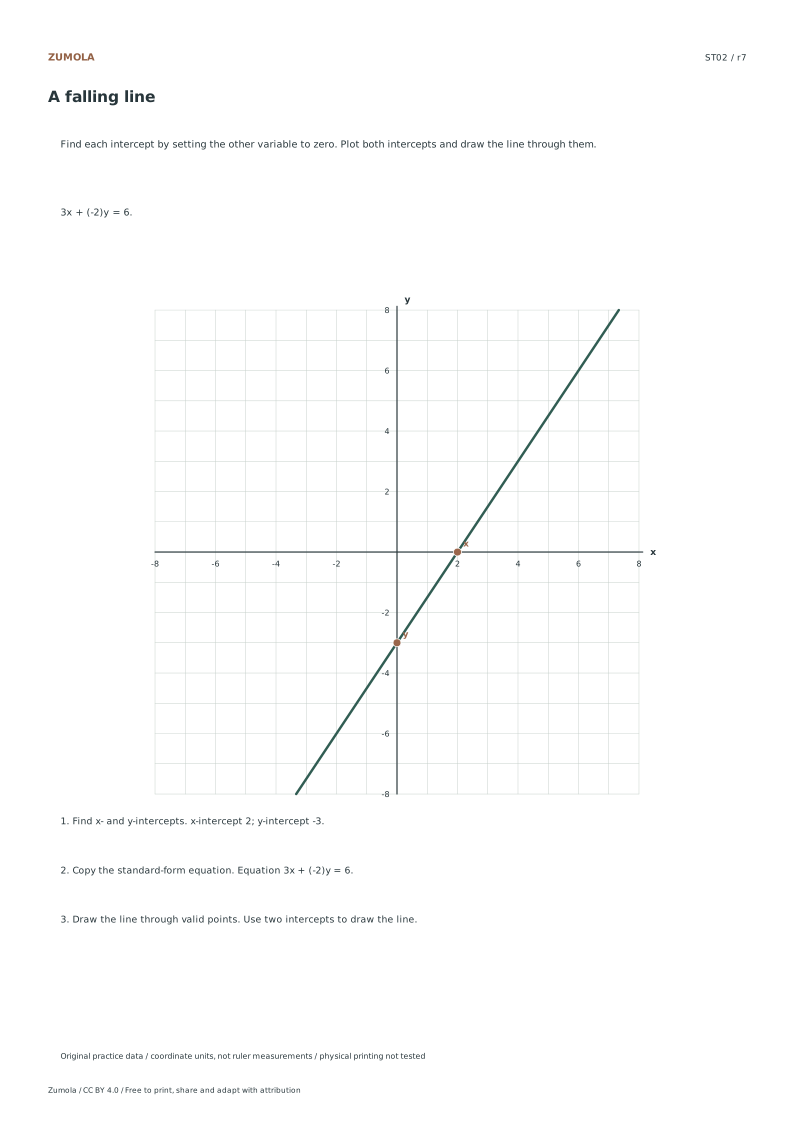
Next, determine the vertical crossing point by setting the variable x to zero within the same linear equation. For instance, in the case where coefficients are three and negative two equaling six, substitute zero for x and solve for y. The resulting value is the y-intercept coordinate. This step is critical because it provides the second anchor point required to define the line's position on the grid. Remember that a zero intercept is a valid result, particularly in cases where the line passes through the origin. Use the supplied values to calculate this coordinate accurately without relying on visual estimation.
Drawing the Line Through Points
With both intercept coordinates calculated, locate these two points on the provided listed coordinate grid. Plot the x-intercept on the horizontal axis and the y-intercept on the vertical axis. Use a straightedge to connect these two distinct points, extending the line across the grid. The accuracy of the drawn line depends entirely on the precision of the calculated intercepts derived from the exact equation. Do not adjust the line to match a perceived appearance; instead, trust the mathematical coordinates determined by the coefficients. This method ensures the graphical representation aligns perfectly with the algebraic definition provided in the original fictional practice material.
Checks that catch common errors
Watch for
Check instead
Estimating the line's position by looking at the printed graph rather than calculating the intercepts from the equation coefficients.
Always calculate the x and y intercepts by substituting zero for the opposite variable in the exact equation provided, then plot those specific coordinates.
Assuming a line must cross both axes at non-zero values and discarding a result where the intercept is zero.
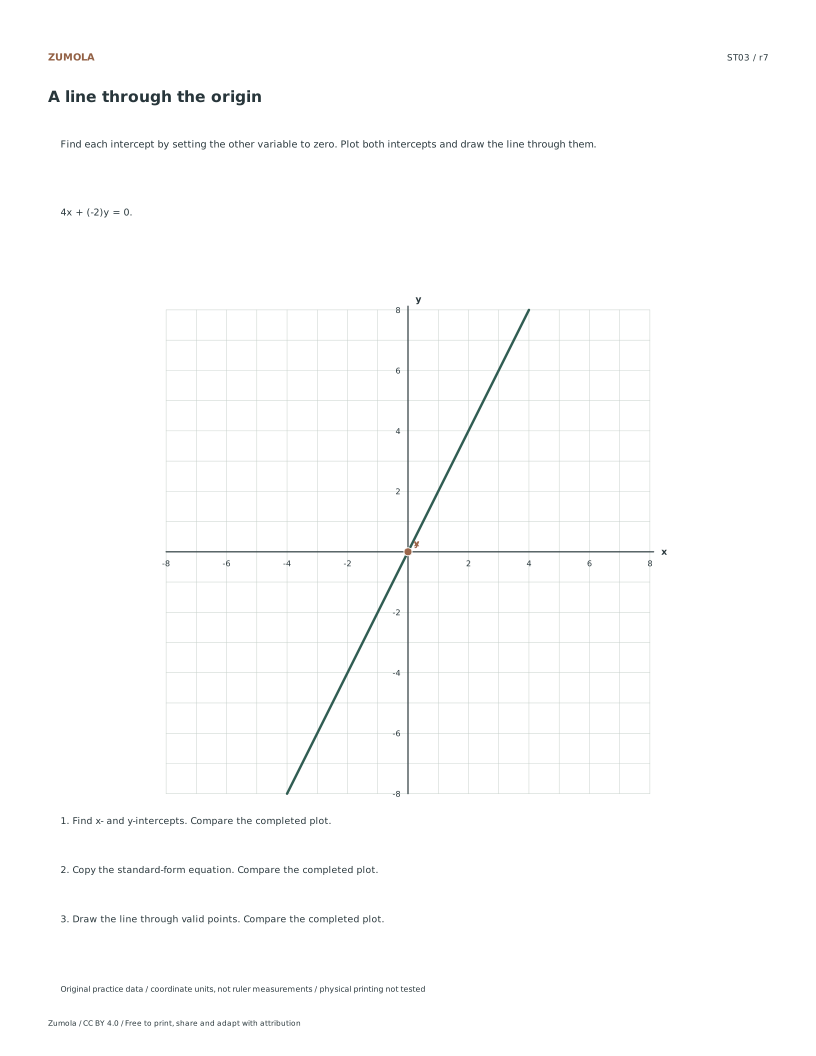
Recognize that a zero intercept is valid, especially when the constant term is zero, indicating the line passes through the origin as seen in specific cases.
Ignoring negative coefficients in the equation, leading to incorrect signs for the calculated intercept coordinates.
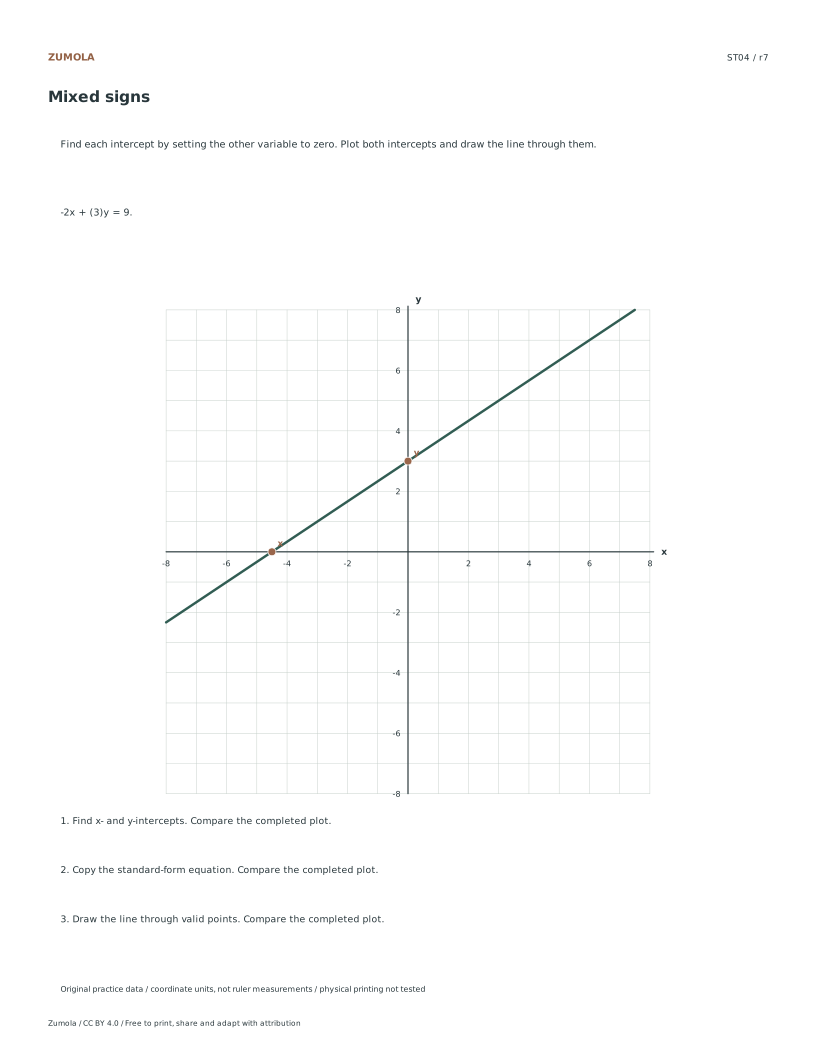
Carefully apply the negative signs from the supplied coefficients A and B when solving for the intercepts to ensure the plotted points are in the correct quadrants.
Keep the labels and margins readable
Choose the PDF that matches your paper. Print at Actual size / 100% and turn off Fit, Shrink and browser headers. SVG is editable but an editor can rescale it; the PDF is the simpler print route. Physical printer, classroom and curriculum tests have not been completed.
Useful answers
How do I find an x-intercept?
Set y to zero and solve for x. For a y-intercept, set x to zero and solve for y.
Can an intercept be zero?
Yes. A line through the origin can have both intercepts at (0,0).
What if the coefficient is negative?
Keep the sign when solving. A negative intercept is a valid coordinate result.
Are the answer files and editable graphs free?
Yes. The individual student, reference and answer files plus collection packs are free without signup. Credit Zumola under CC BY 4.0 when sharing or adapting.
Optional Google Analytics helps us understand which free resources are useful. It is off until you allow it. Drawing tools and downloads work with either choice. Privacy details