Free graphing resources · Original practice
Graphing absolute value functions.
Find the corner, then the arms.
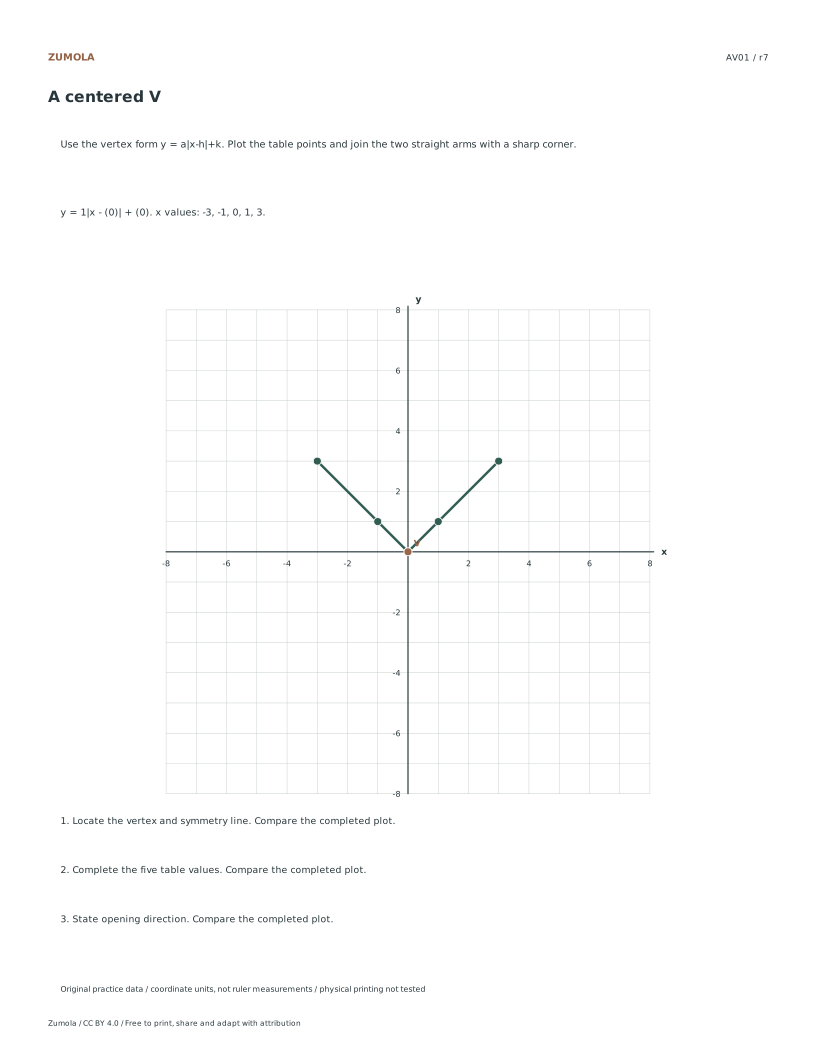
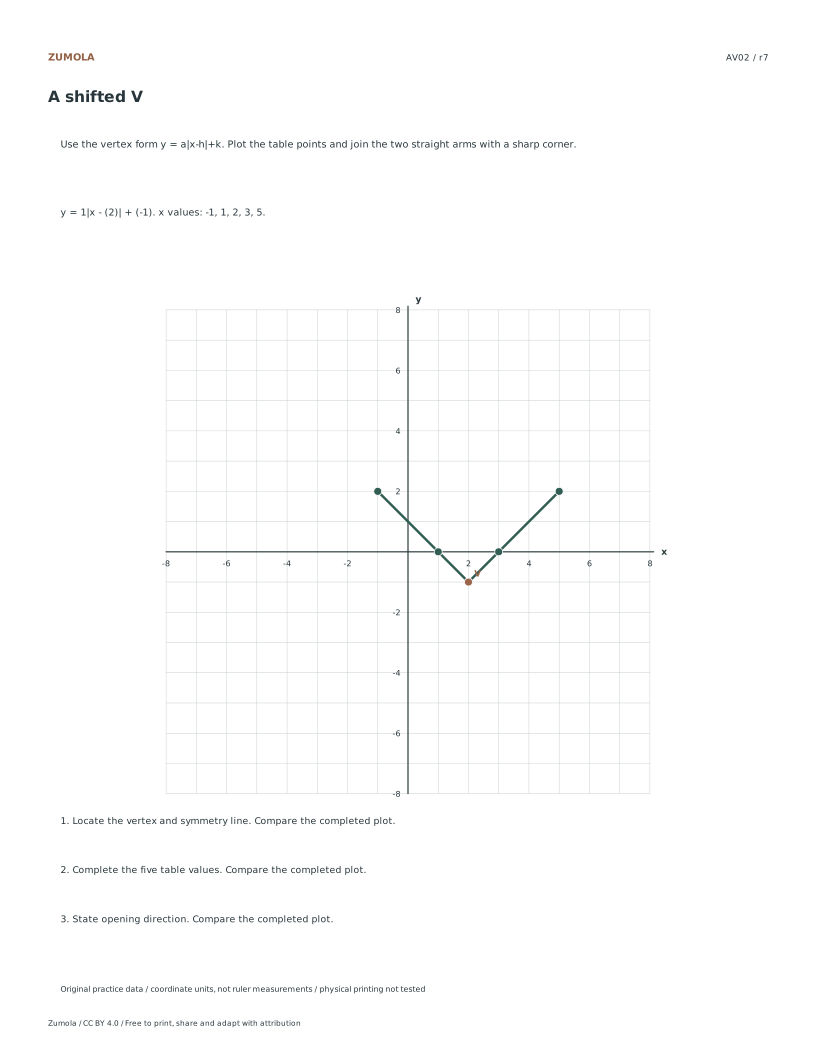
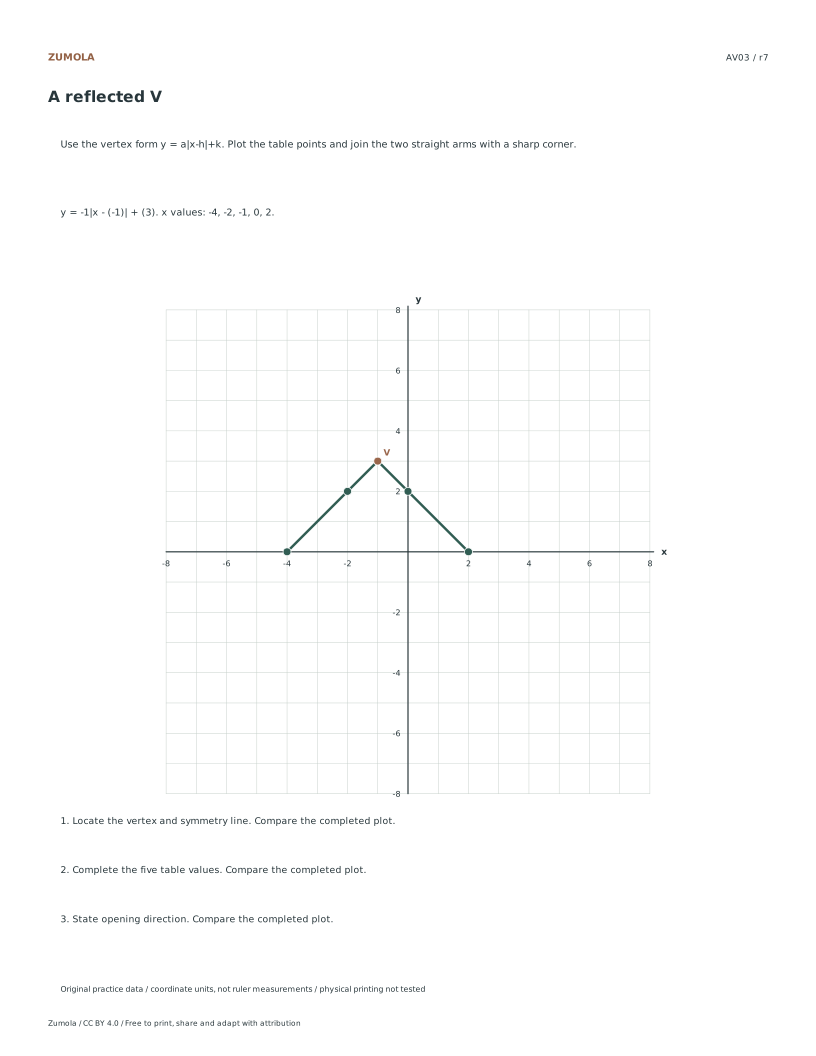
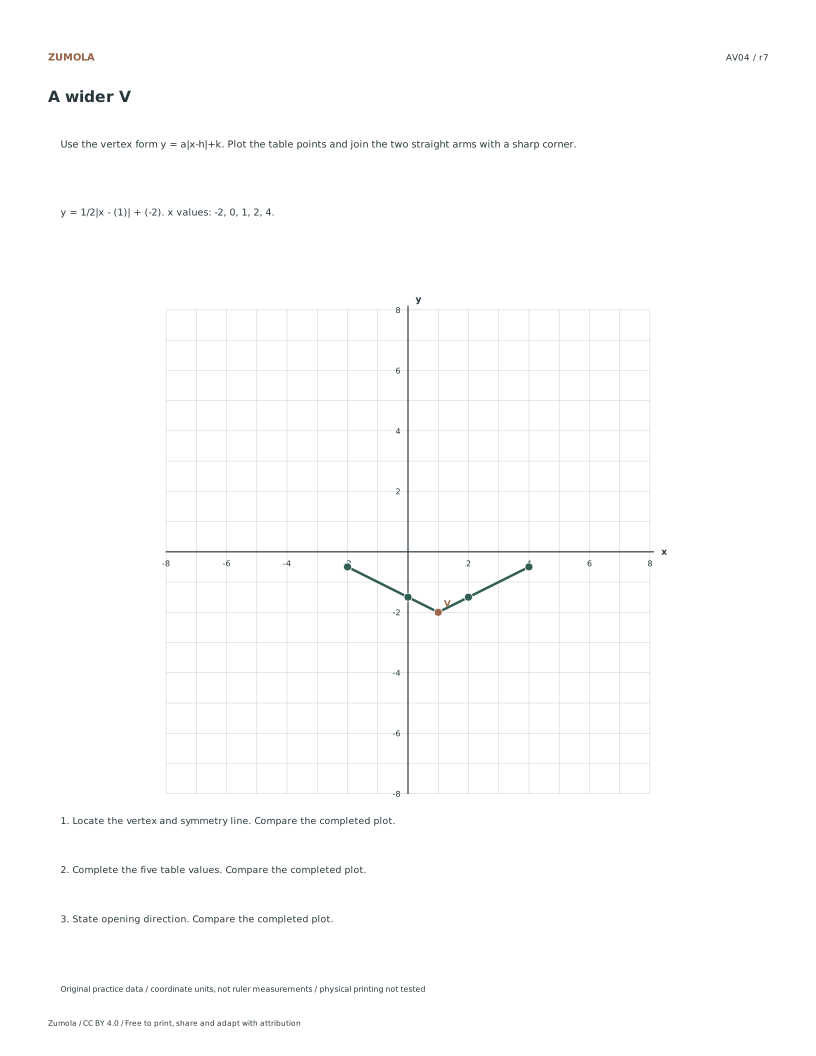
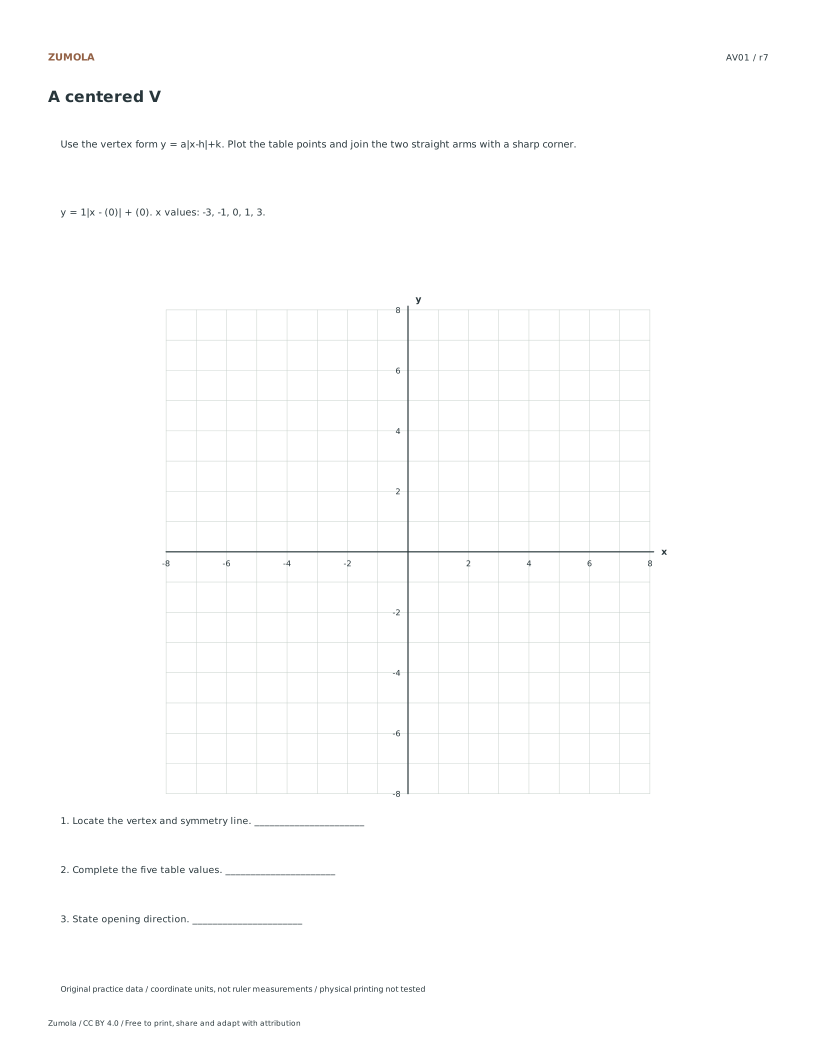
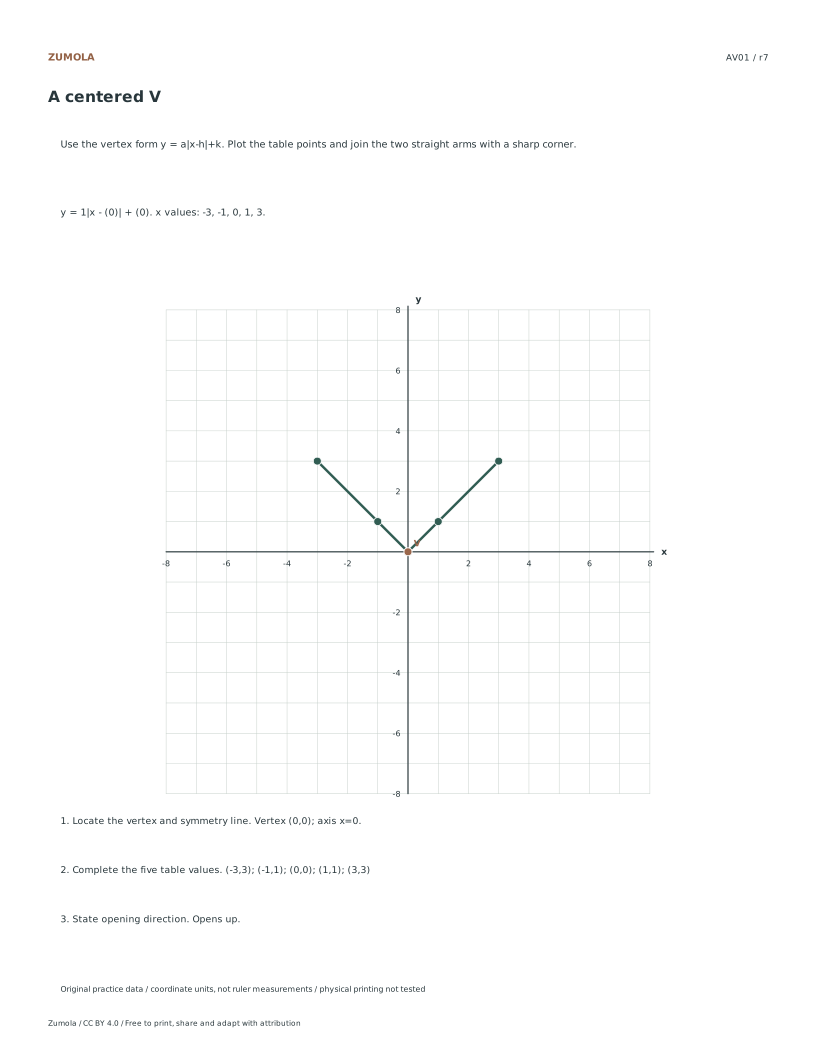
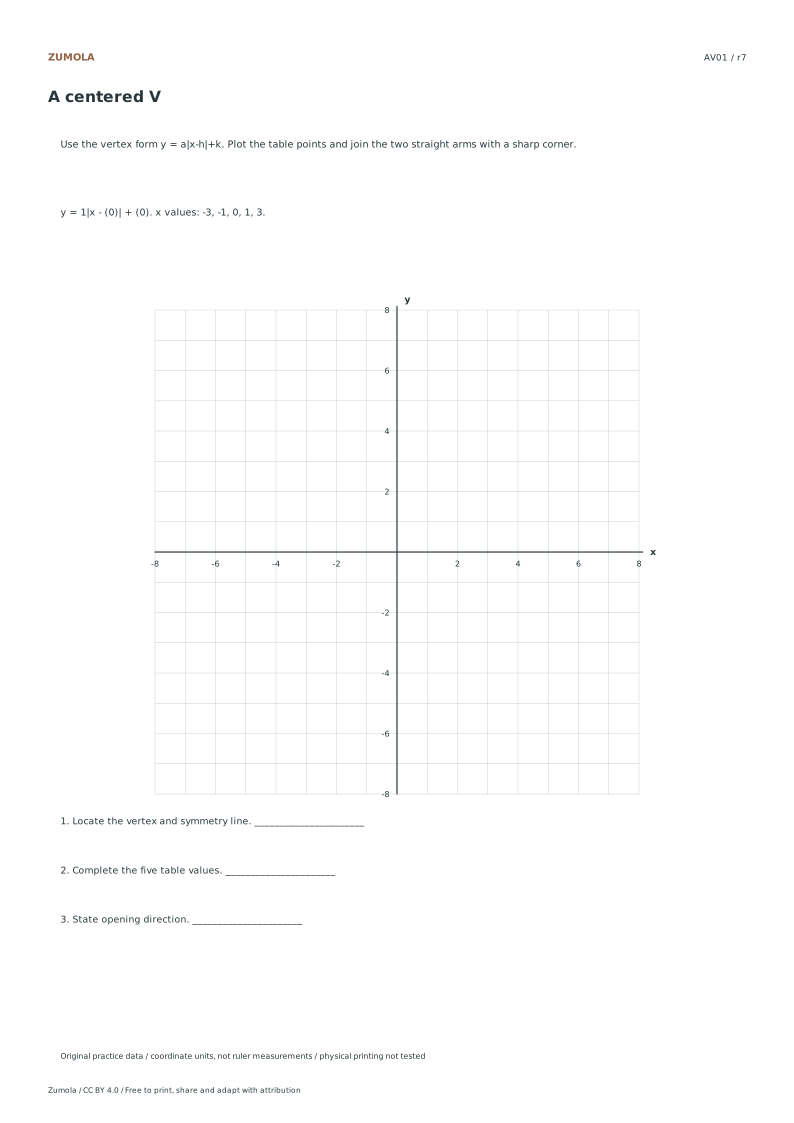
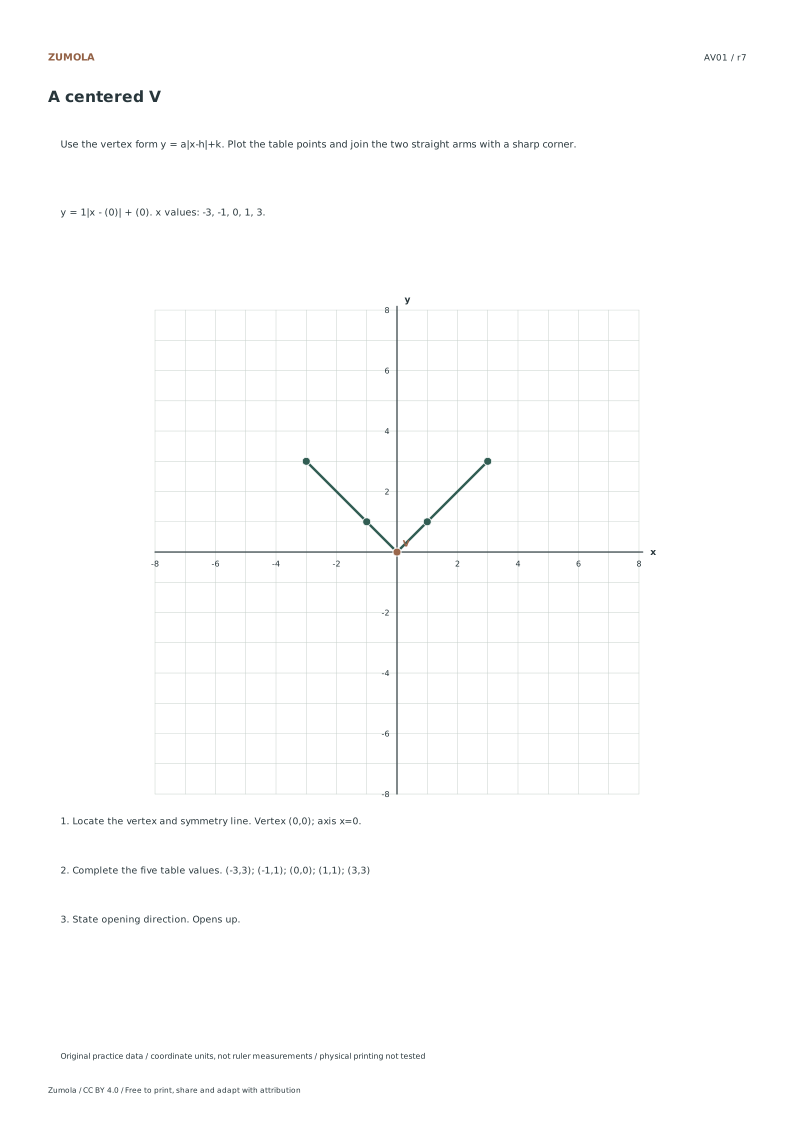
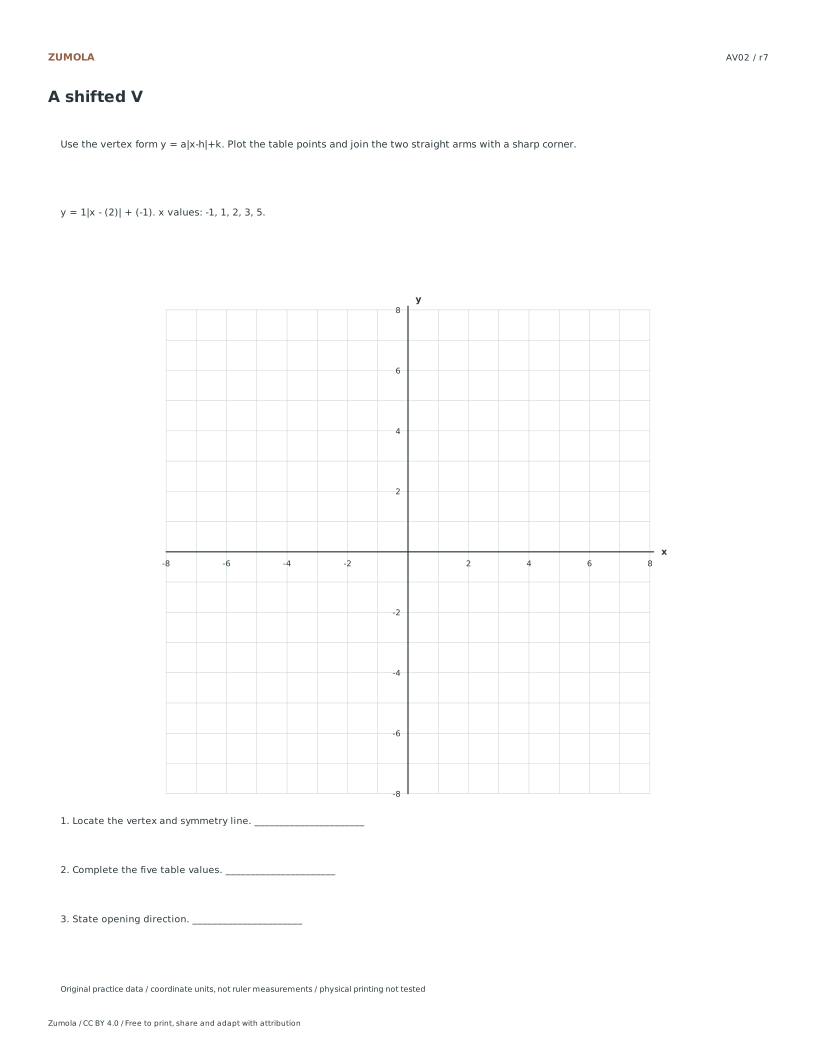
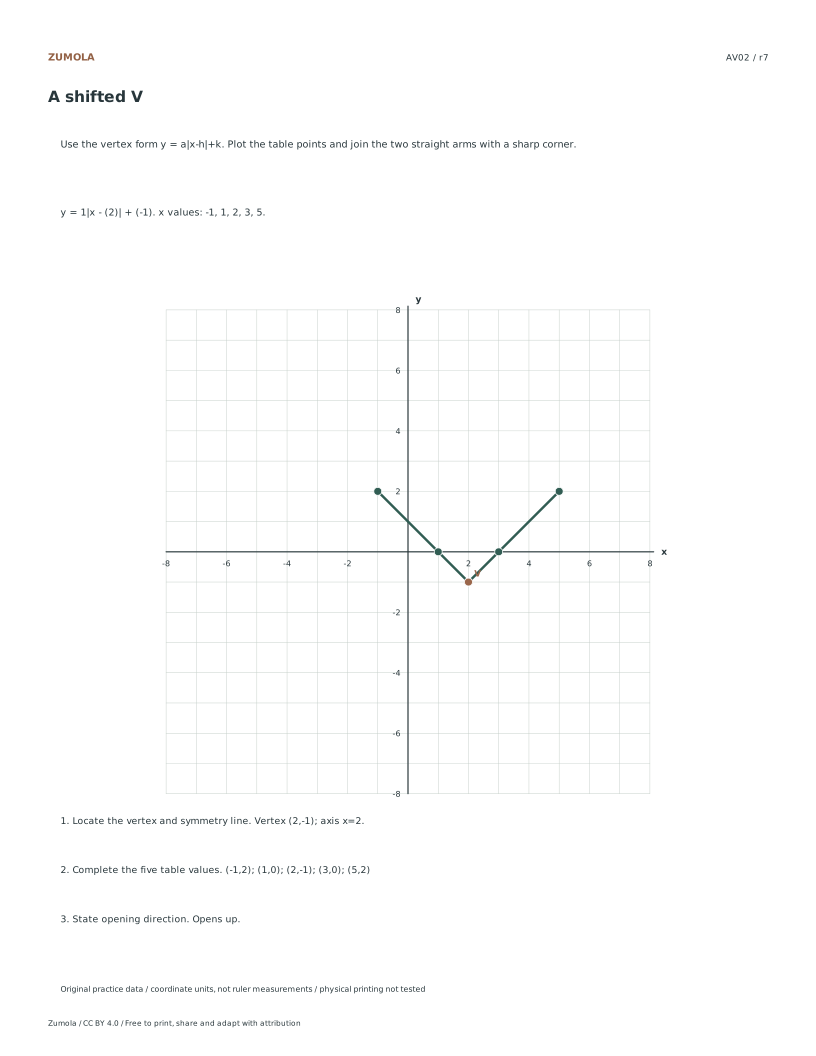
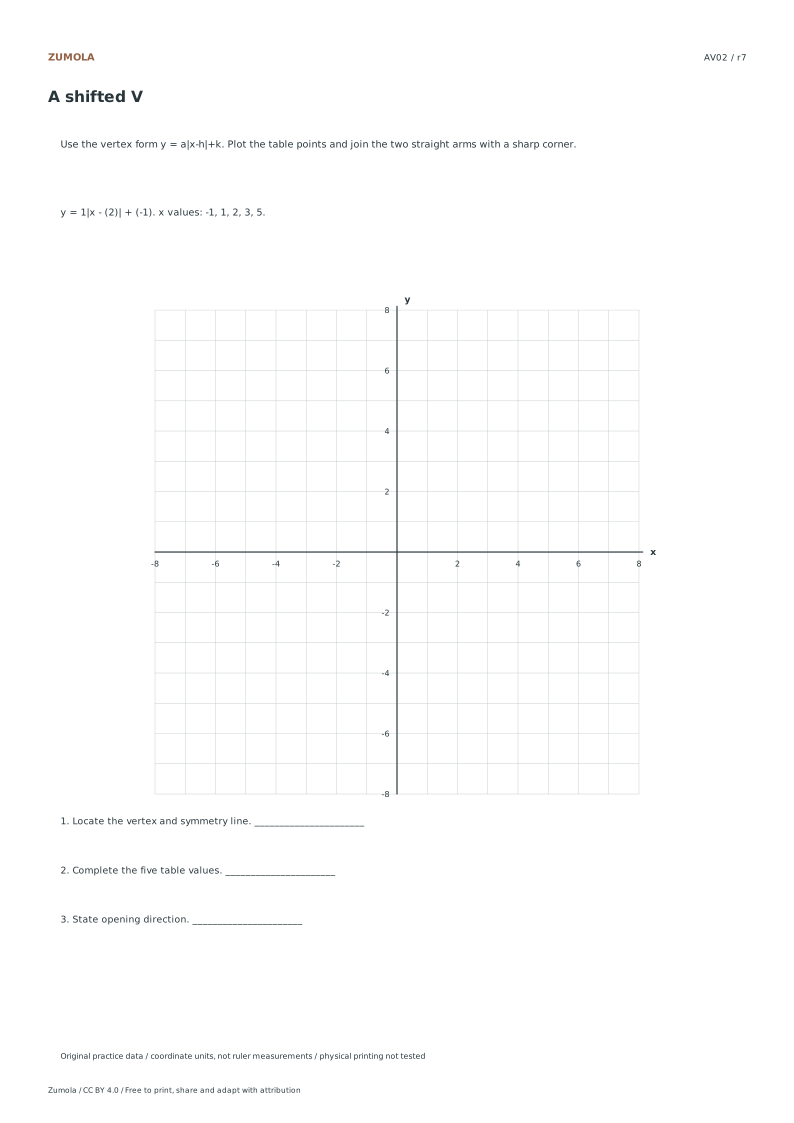
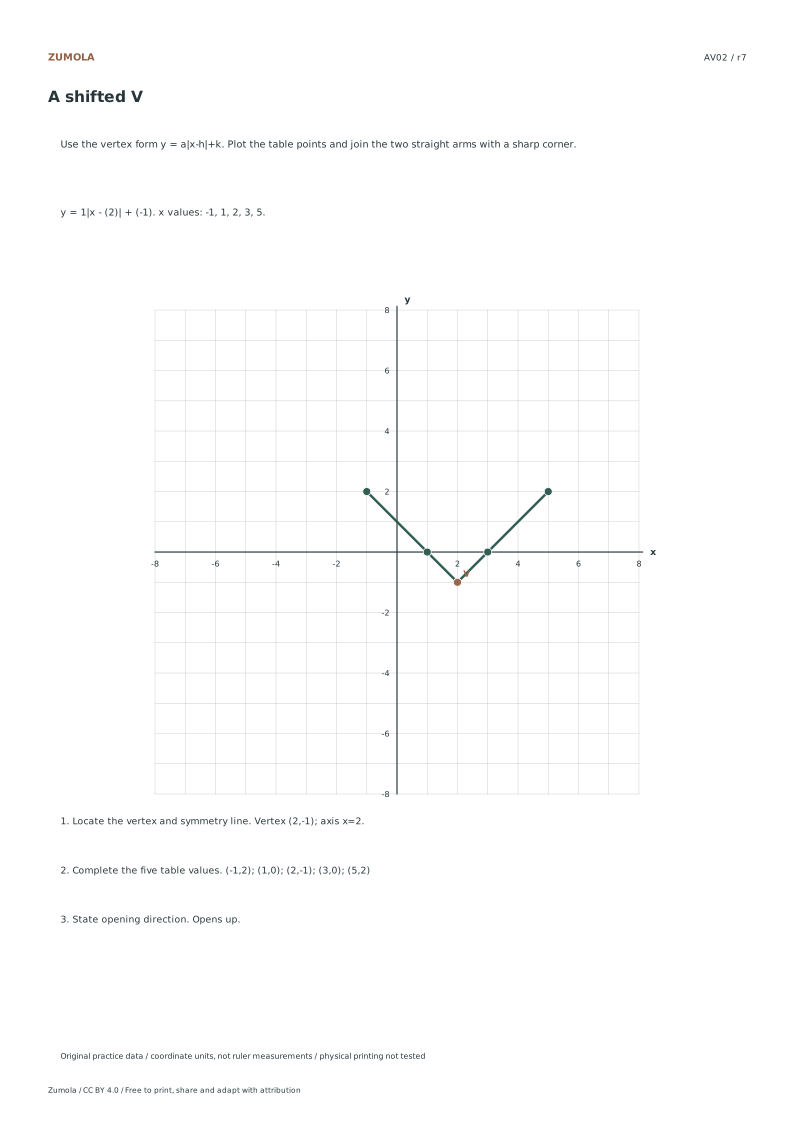
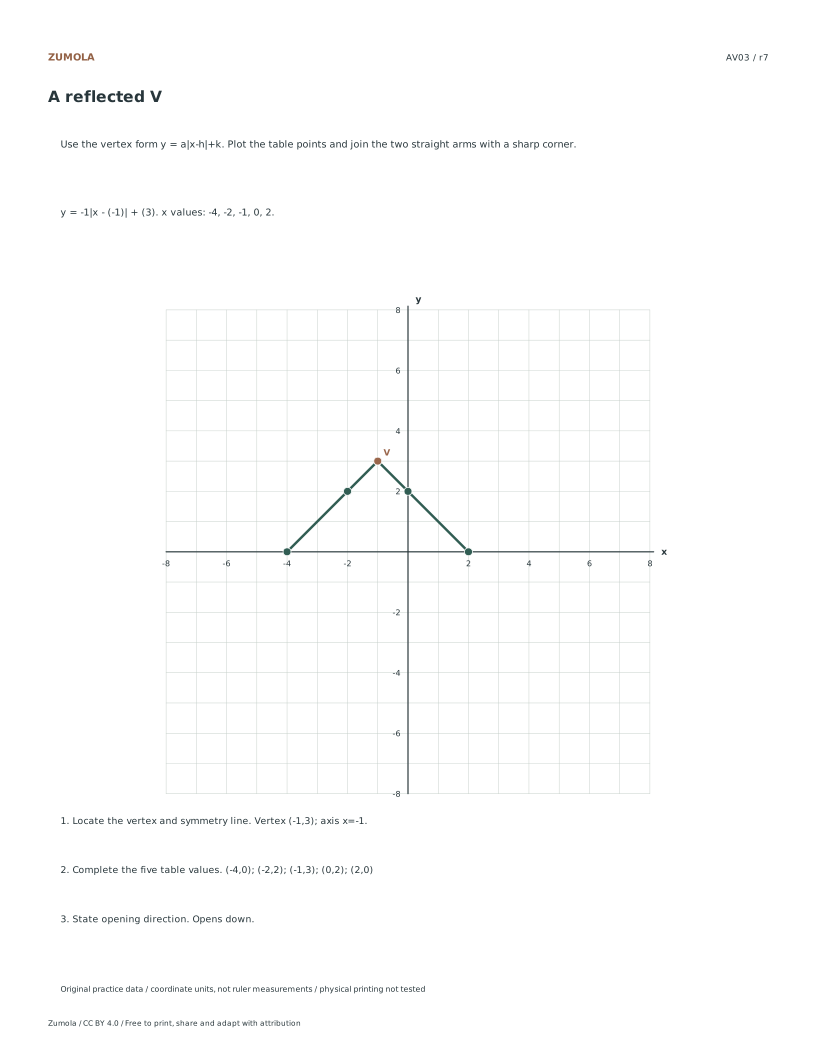
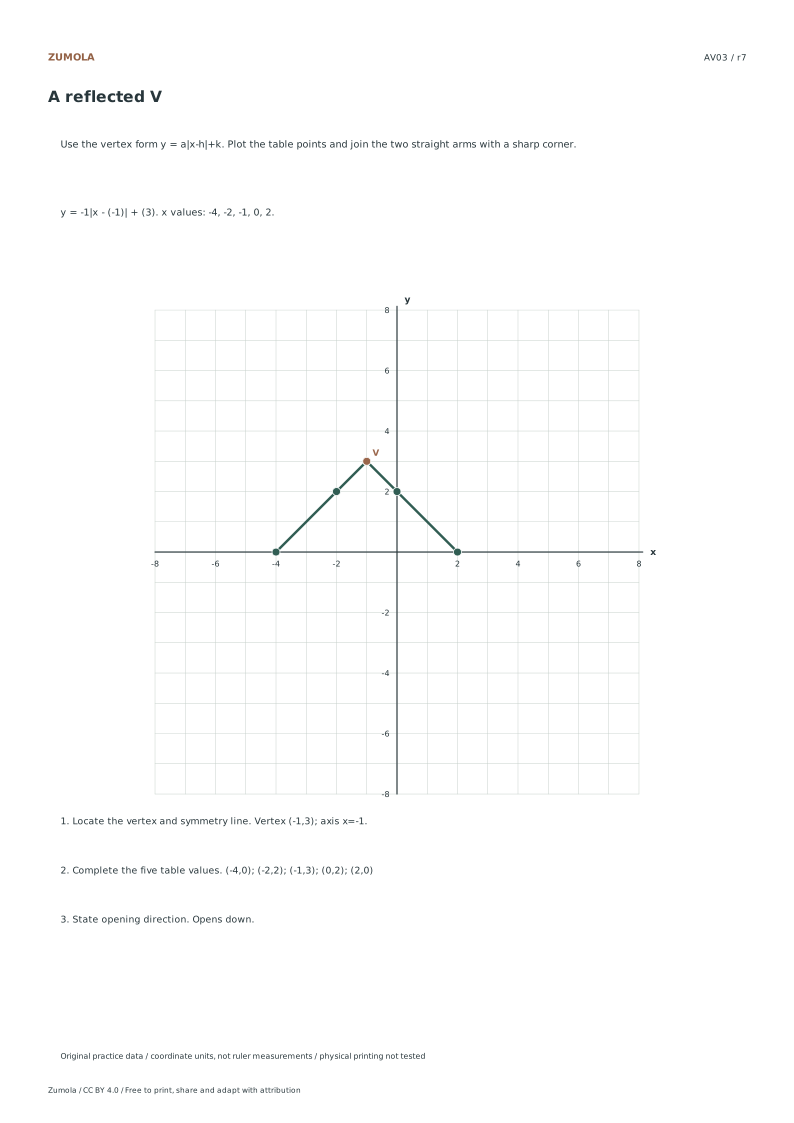
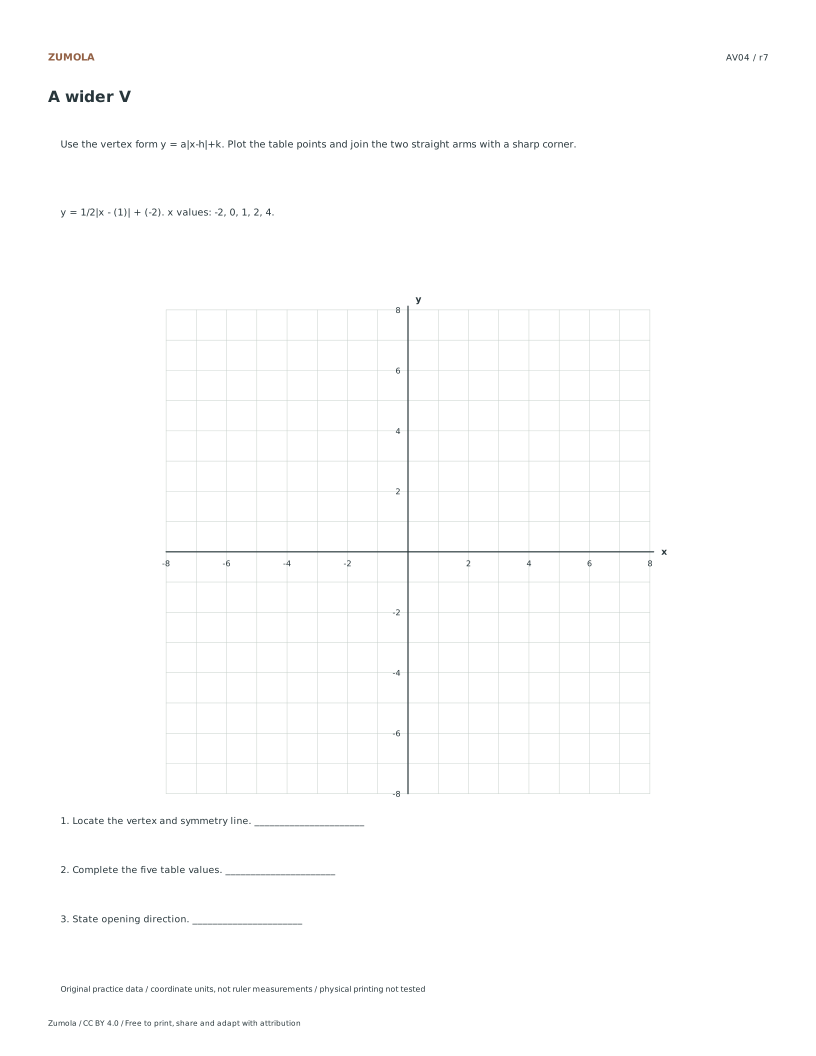
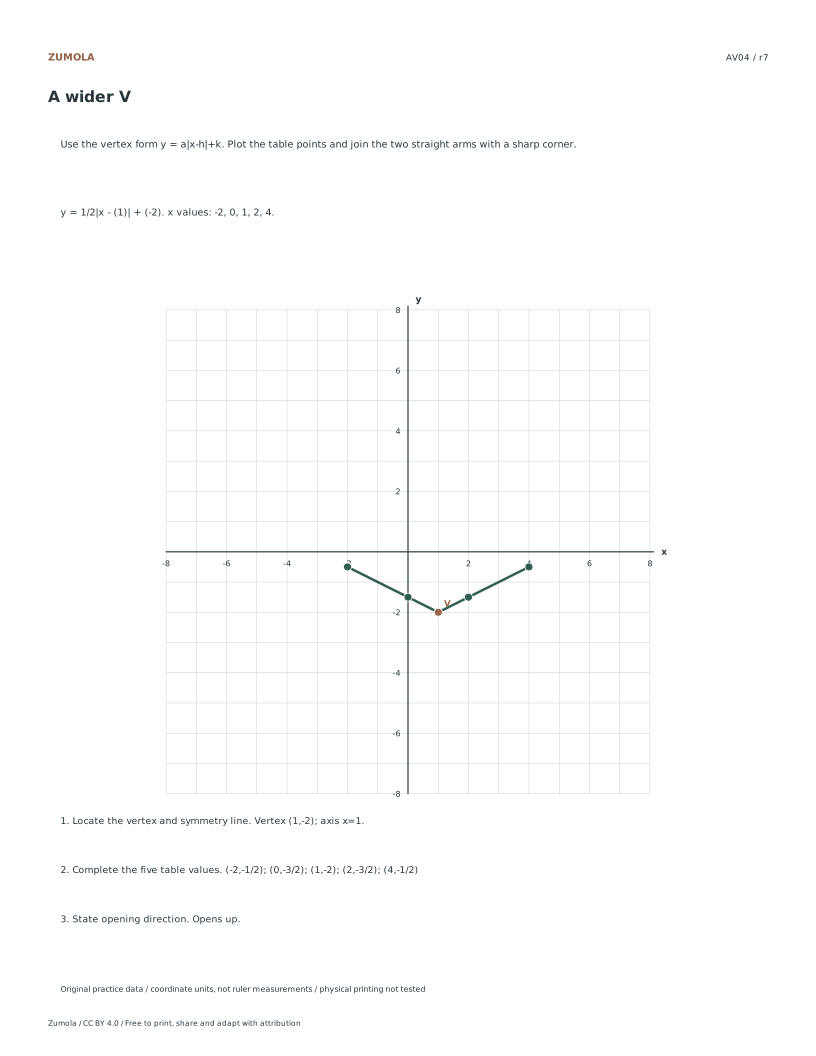
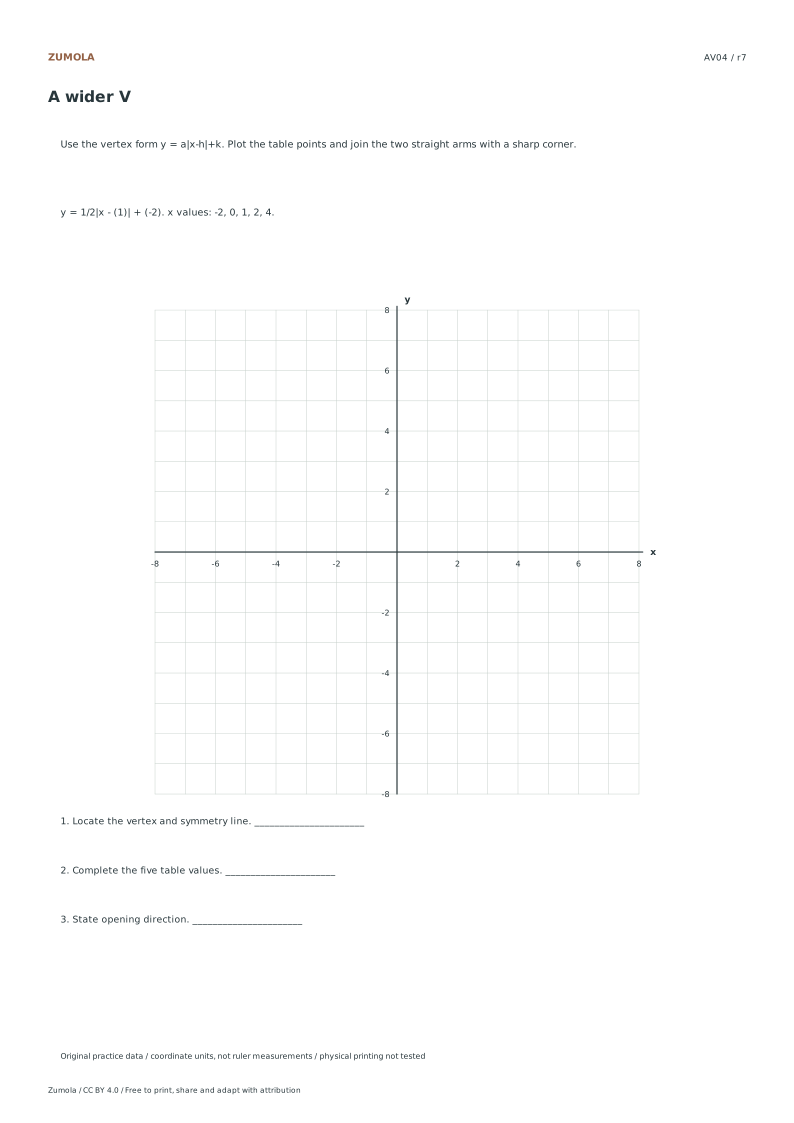
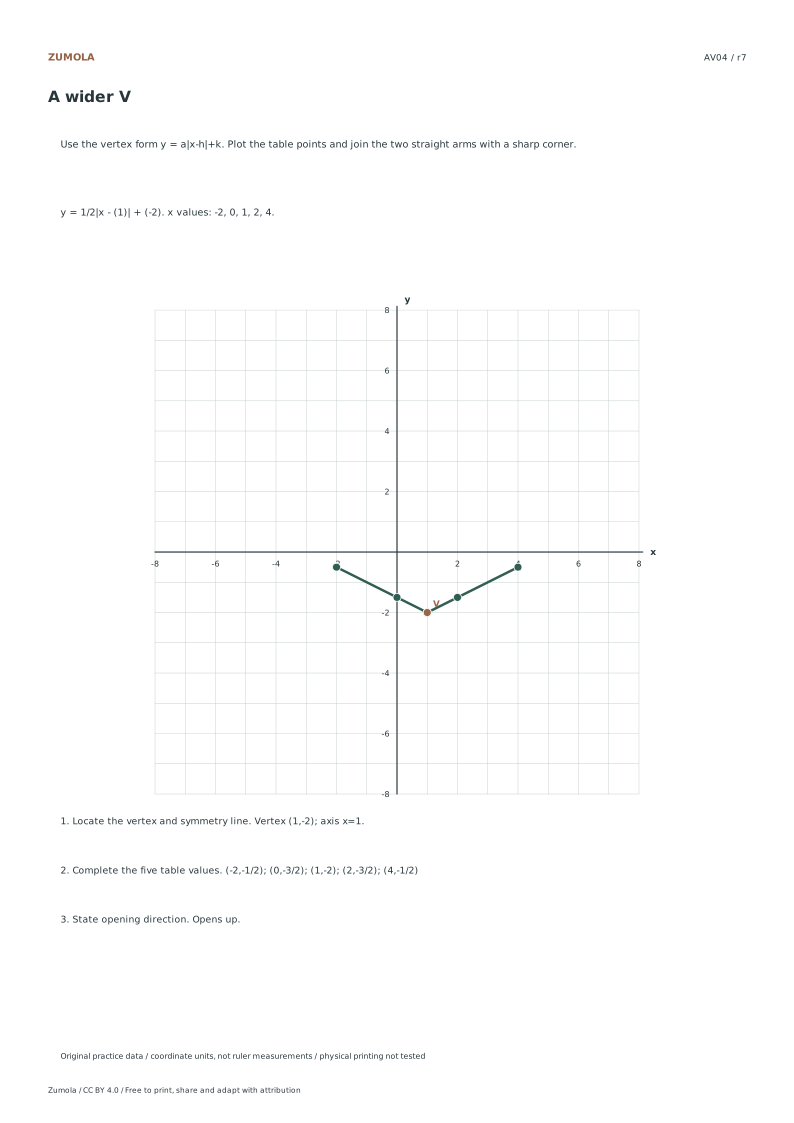
Plot four functions in y=a|x-h|+k. Identify each vertex and symmetry line, calculate sample values and compare upward, downward and wider V shapes.
4 absolute-value cases.
Vertex + table + answer.
More ways to practice
Endpoint and inequality boundary checks
For any absolute value graph y = a|x - h| + k, the vertex is at (h, k). The two linear pieces have slopes a and -a. When graphing an inequality such as y < a|x - h| + k, first graph the boundary y = a|x - h| + k. Use a dashed boundary if the inequality is strict (< or >) and a solid boundary if it includes equality (≤ or ≥). Then test one point not on the boundary to decide which region to shade.
A common error is shading the wrong side because the test point lies on the boundary or because the inequality symbol was misread. Choose a test point clearly inside one region, such as the vertex shifted vertically by one unit, and substitute it into the original inequality. If the statement is true, shade that region; if false, shade the other side.
Also check the domain and range. The domain of any absolute value function of this form is all real numbers. The range depends on the sign of a: if a > 0, the range is y ≥ k; if a < 0, the range is y ≤ k. For inequalities, the shaded region may extend beyond these bounds, so state the boundary's range separately from the shaded set.
- Identify h, k, and a from the equation; plot the vertex (h, k).
- Use the slope a to plot one point to the right of the vertex, and -a to plot one point to the left.
- Draw the V-shaped boundary with a dashed line for strict inequalities or a solid line for inclusive inequalities.
- Choose a test point not on the boundary and substitute it into the inequality.
- Shade the region where the inequality is true, and label the boundary equation.
New worked example: inequality with a shifted vertex
Consider the inequality y ≤ 2|x - 1| - 3. The boundary is y = 2|x - 1| - 3, with vertex (1, -3) and slopes 2 and -2. Because the inequality includes equality (≤), draw a solid V. To decide shading, test the point (1, 0), which is above the vertex. Substitute: 0 ≤ 2|1 - 1| - 3 = -3, which is false. Therefore shade the region below the V, not above it.
Verify with another point: (0, -1). Left side: -1. Right side: 2|0 - 1| - 3 = 2(1) - 3 = -1. The statement -1 ≤ -1 is true, so (0, -1) lies on the boundary and should be included. A point just below the boundary, such as (0, -2), gives -2 ≤ -1, true, confirming the shaded region is below.
This example also exposes a frequent mistake: assuming the shaded region is always above the V. The test point method prevents that error. Record the test point and its substitution on the worksheet so the reasoning can be checked independently.
- Write the boundary equation and identify vertex (1, -3).
- Plot the vertex and use slope 2 to reach (2, -1) and slope -2 to reach (0, -1).
- Draw a solid V through these points.
- Test (1, 0): 0 ≤ -3 is false, so shade below the V.
- Confirm with (0, -2): -2 ≤ -1 is true, so the lower region is correct.
Diagnostic checks for independent verification
After graphing, verify three independent features: the vertex coordinates, one point on each branch, and the direction of opening. For y = a|x - h| + k, the vertex must satisfy the equation exactly. Substitute x = h and confirm y = k. Then choose x = h + 1 and x = h - 1; both substitutions give y = a|1| + k = k + a, so the two points are symmetric about x = h and their y-value is k + a. If a is negative, this value is below k, which confirms the downward opening.
Check intercepts only when they exist. The y-intercept is found by setting x = 0: y = a| -h| + k = a|h| + k. The x-intercepts require solving a|x - h| + k = 0, which has solutions only if -k/a ≥ 0. If no real solution exists, state that the graph has no x-intercept rather than forcing one.
Finally, confirm that the graph is a function: it must pass the vertical line test. Absolute value graphs of this form always do, but inequality regions may not represent functions. Label the boundary and shaded region clearly so the reader can distinguish the function from the solution set.
- Substitute x = h into the equation and confirm the output is k.
- Plot points at x = h + 1 and x = h - 1; check they are symmetric about x = h and both equal k + a.
- Calculate the y-intercept by substituting x = 0.
- Solve for x-intercepts only if the equation yields real values; otherwise state none.
- For inequalities, verify shading with at least one test point and label the boundary type.
Try this example
Graph the inequality y > |x + 2| - 1 and determine the shaded region.
Show the worked explanation
The boundary is y = |x + 2| - 1, with vertex (-2, -1) and slopes 1 and -1. Since the inequality is strict (>), draw a dashed V. Test the point (-2, 0): 0 > |0| - 1 = -1 is true, so shade above the V. Check (-2, -2): -2 > -1 is false, confirming the region below is excluded. The boundary is not part of the solution.
Common mistakes
- Shading above the V for y ≤ a|x - h| + k without testing a point. Substitute a test point such as (h, k + 1) into the inequality; shade the side where the statement is true.
- Drawing a solid boundary for a strict inequality (< or >). Use a dashed line for strict inequalities and a solid line only when equality is included (≤ or ≥).
- Assuming every absolute value graph has two x-intercepts. Solve a|x - h| + k = 0; if -k/a is negative, there are no real x-intercepts, so state that explicitly.
Check your work
- Vertex is correctly identified and plotted at (h, k).
- Slopes of both branches match a and -a, with symmetric points shown.
- Boundary line style matches the inequality: dashed for strict, solid for inclusive.
- At least one test point is substituted and the shading decision is justified.
- Intercepts are calculated only when real and labeled accurately.
- Domain and range are stated correctly for the boundary function.
Questions before you start
How do I know which side to shade for an absolute value inequality?
Graph the boundary first, then test one point not on the boundary. If the test point makes the inequality true, shade the region containing that point; otherwise shade the other region.
Can an absolute value graph have no x-intercepts?
Yes. For y = a|x - h| + k, x-intercepts exist only when -k/a is greater than or equal to zero. If it is negative, the graph does not cross the x-axis.
What is the range of y = -2|x + 1| + 4?
Because a = -2 is negative, the graph opens downward with vertex (-1, 4). The range is y ≤ 4.