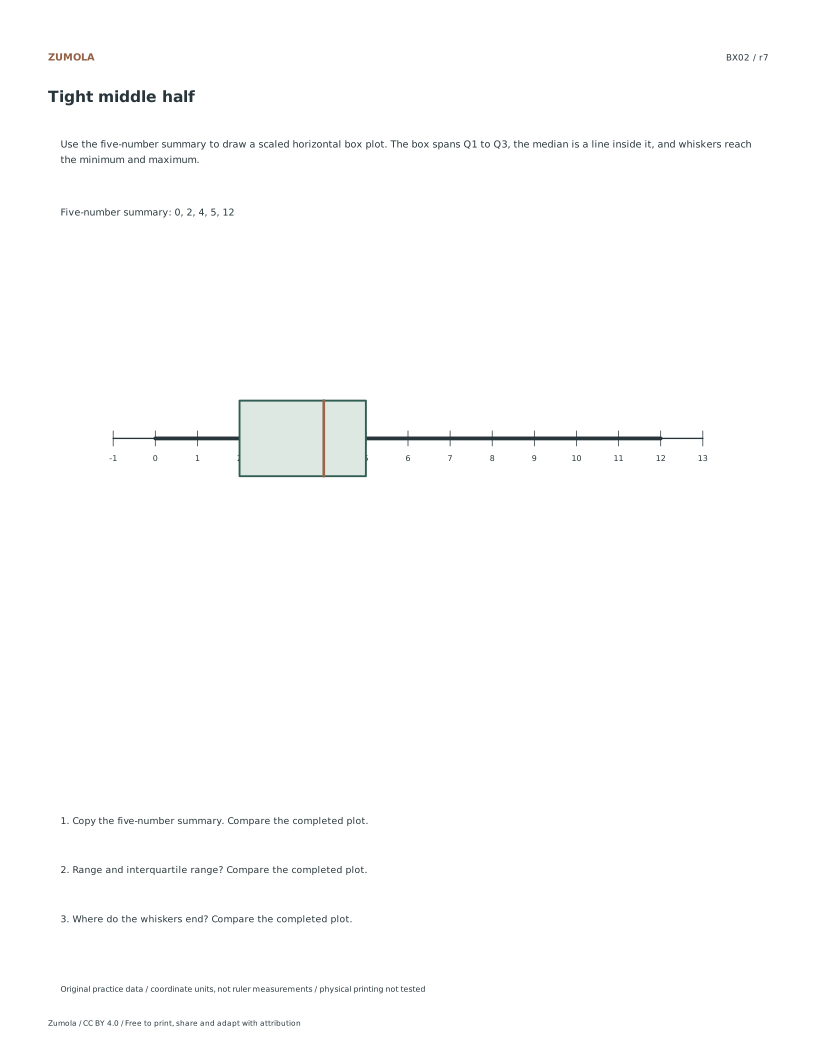
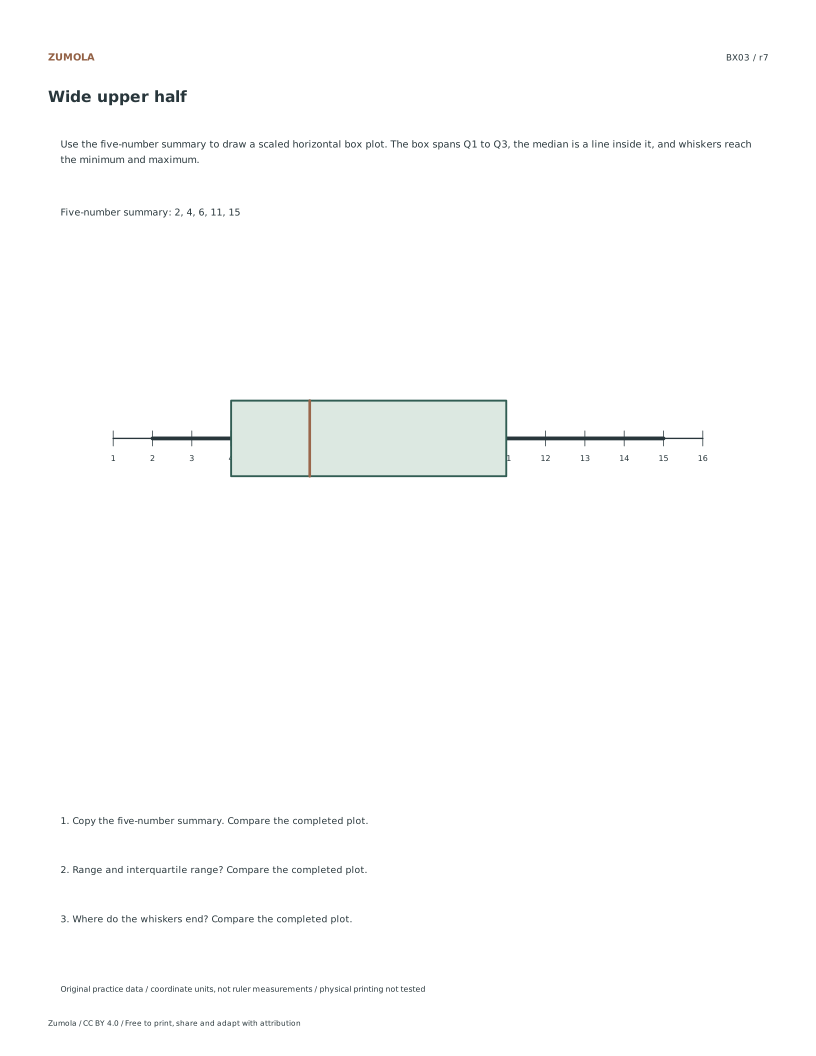
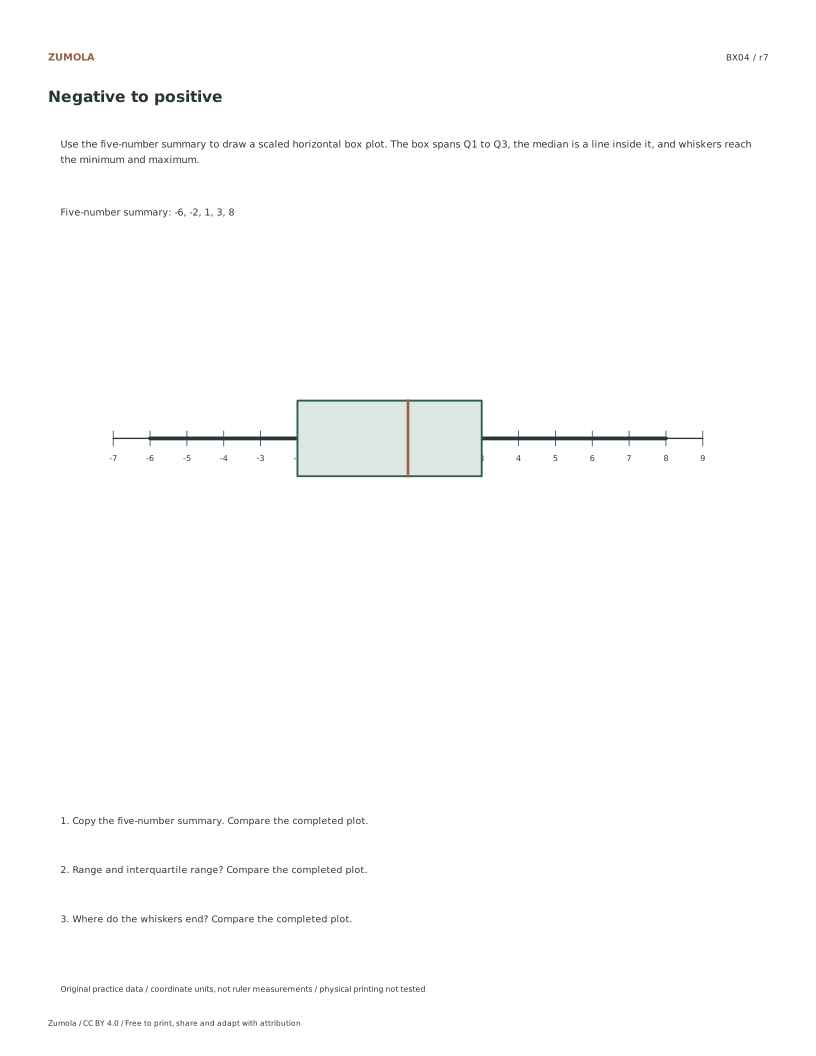
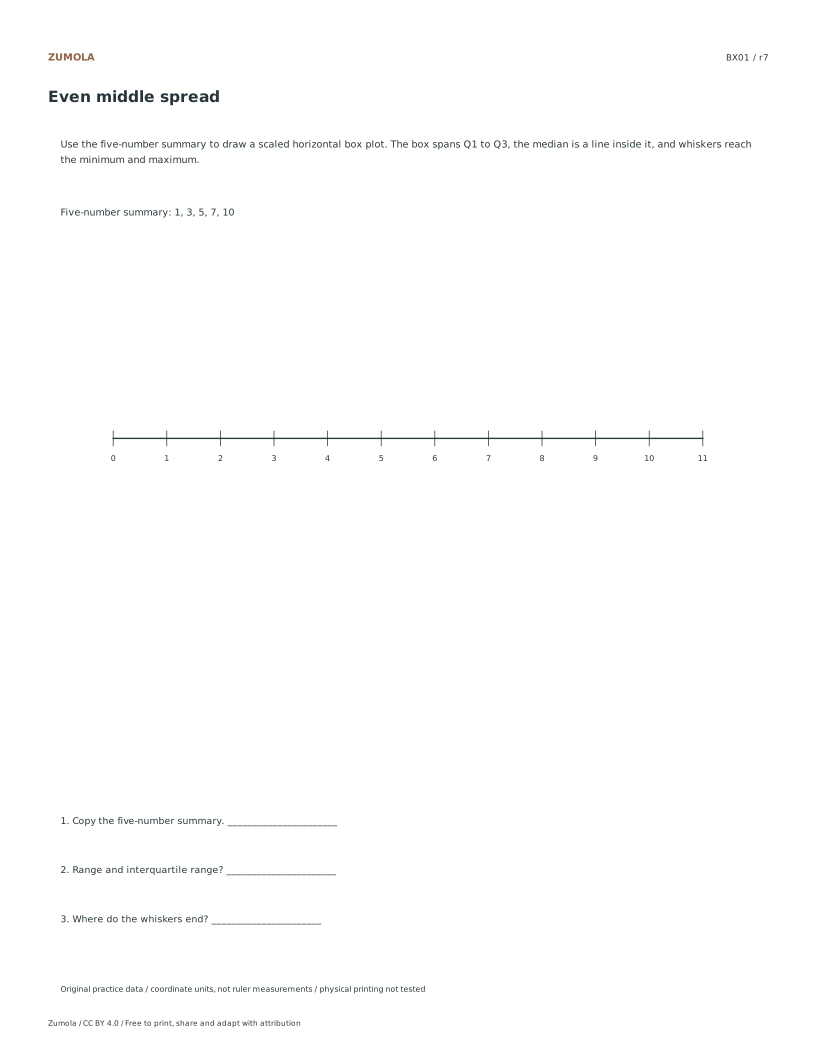
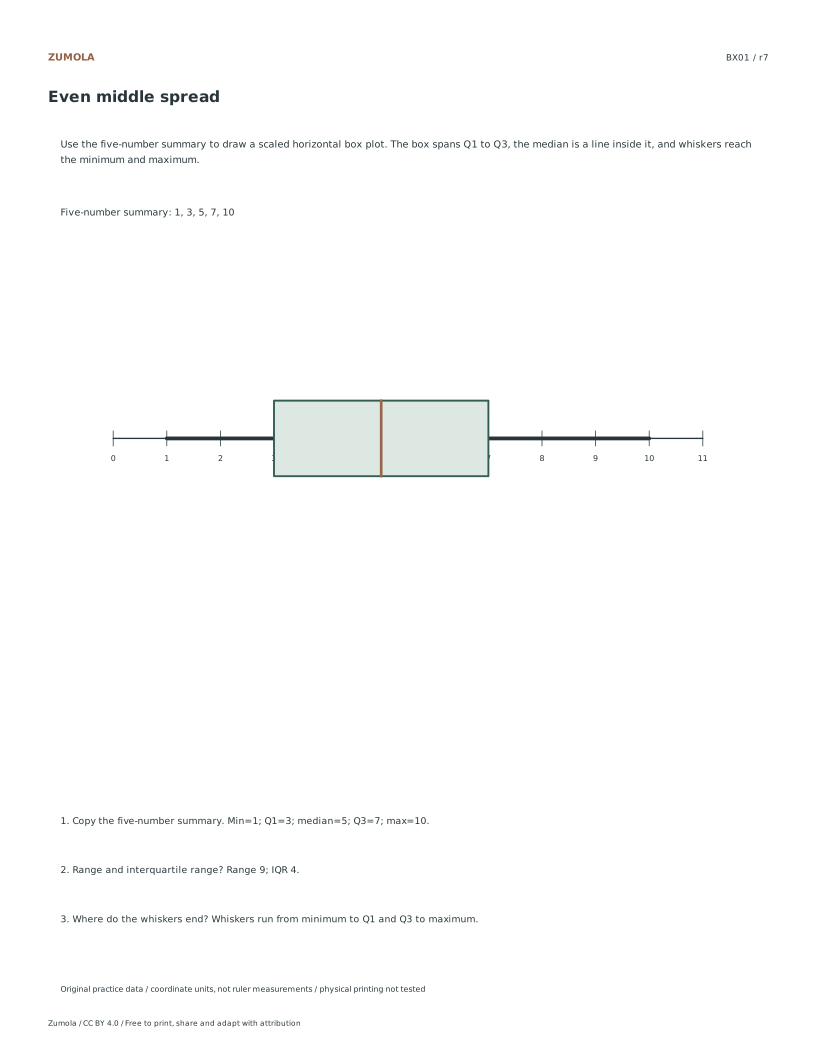
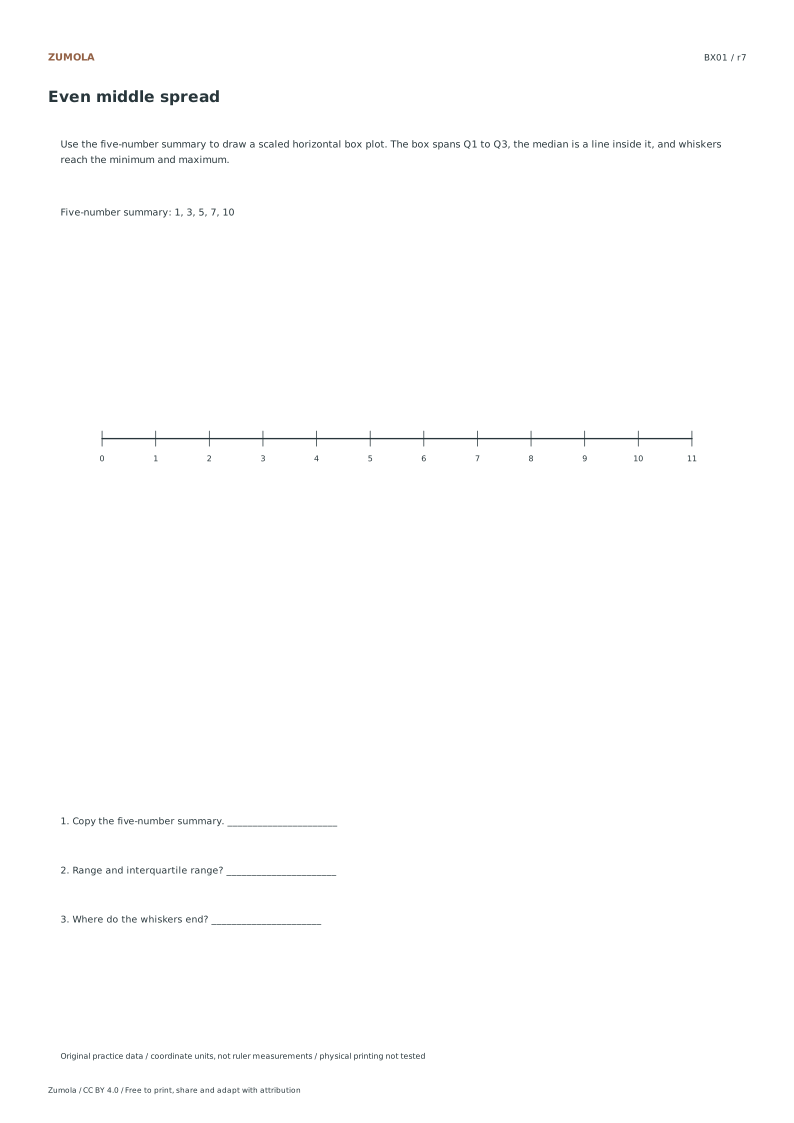
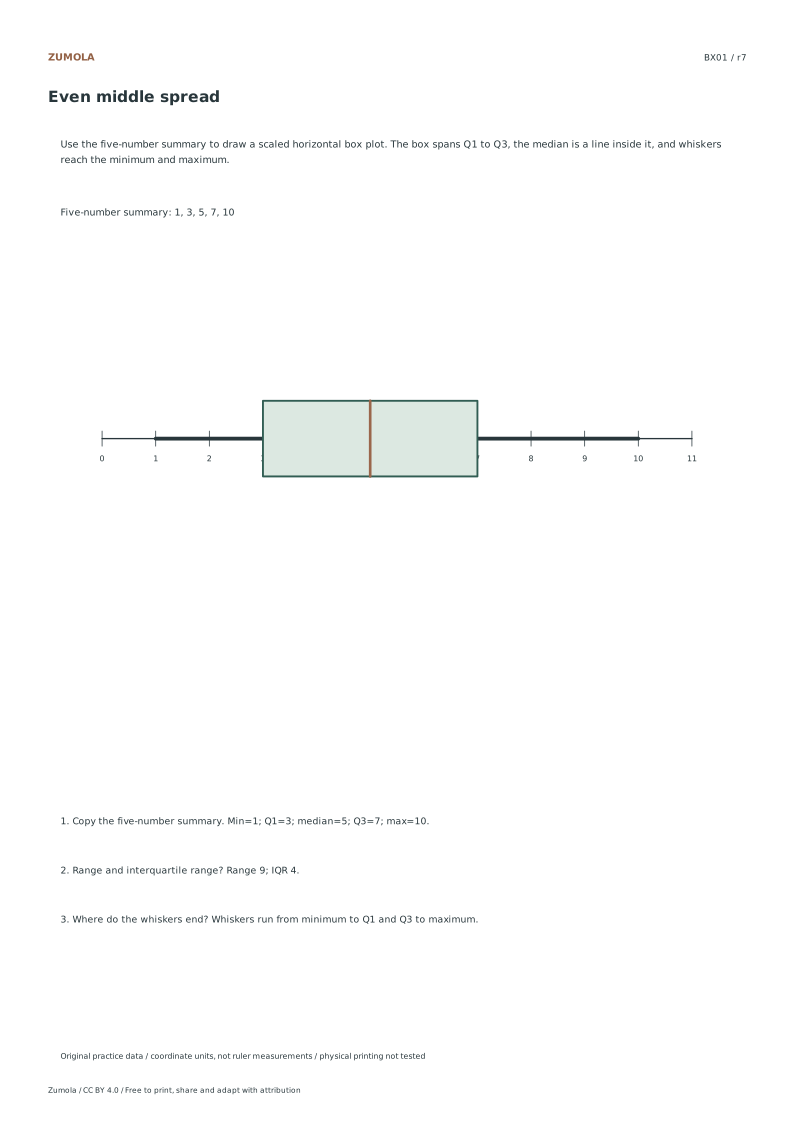
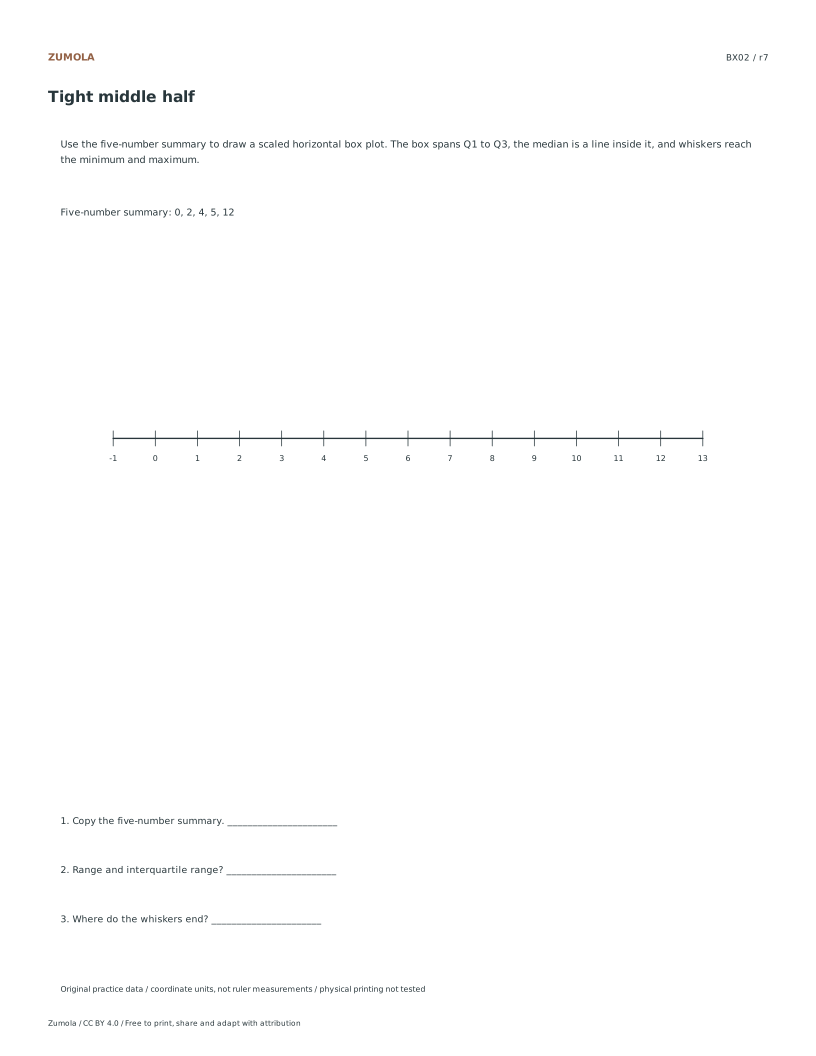
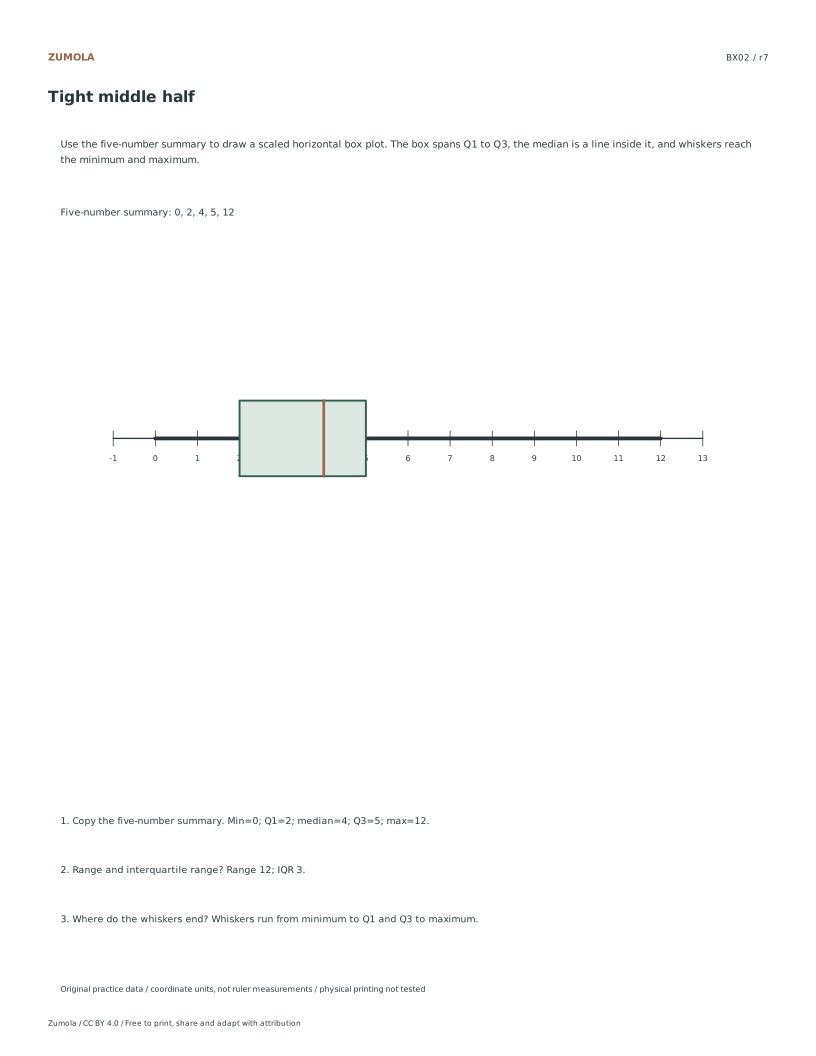
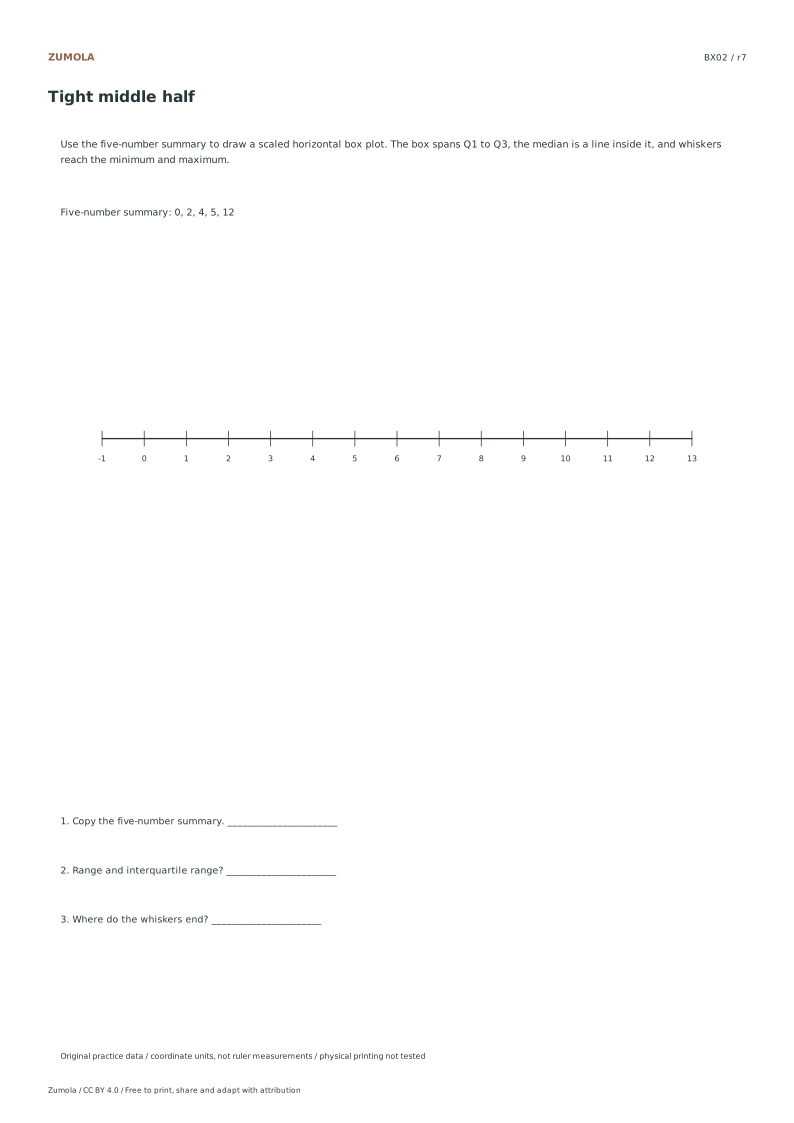
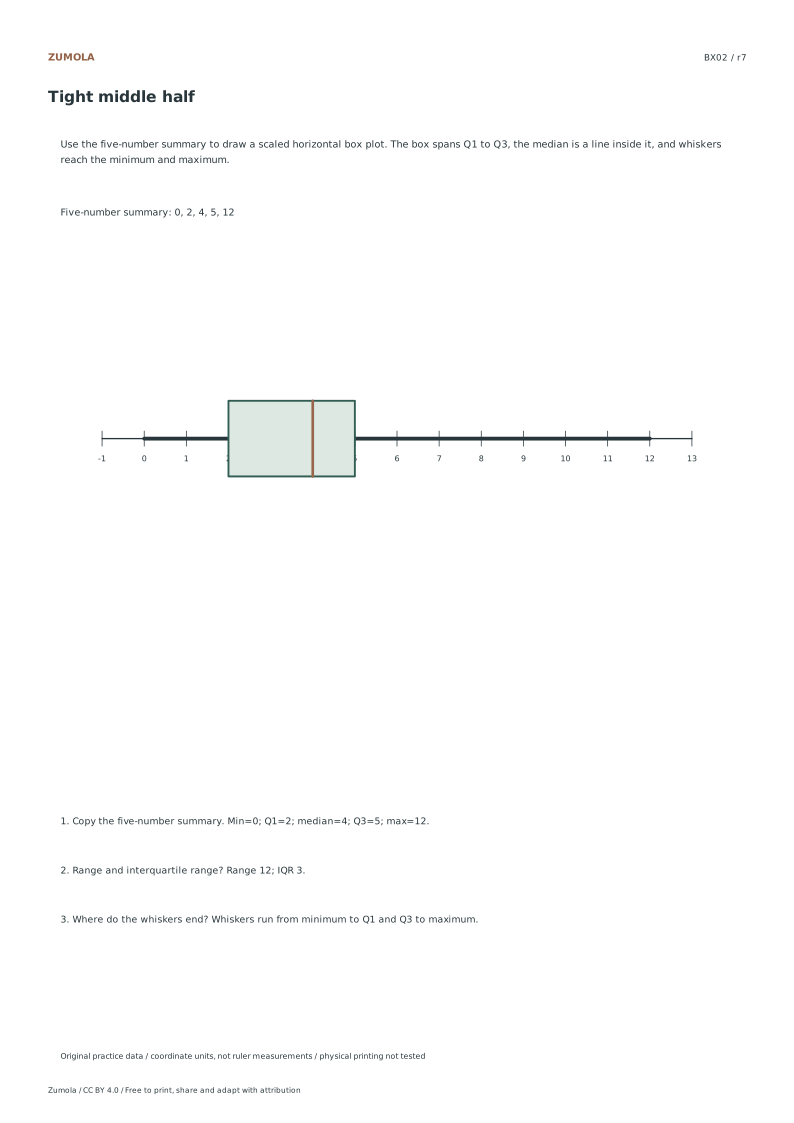
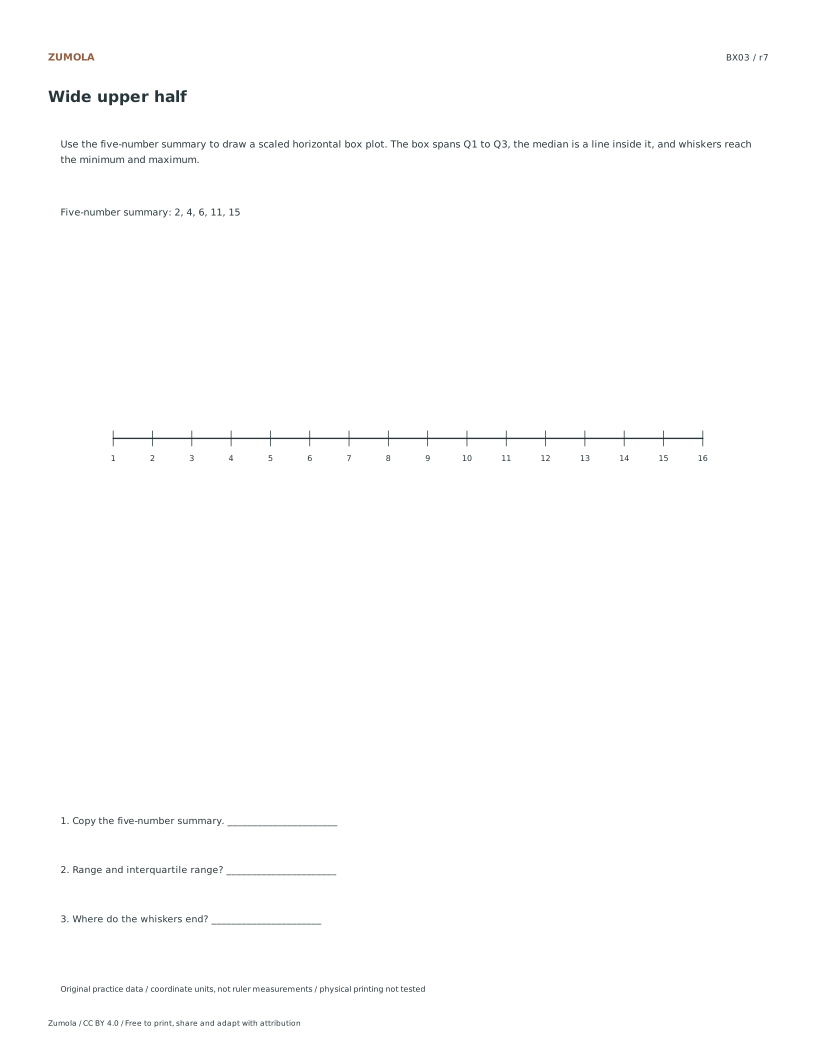
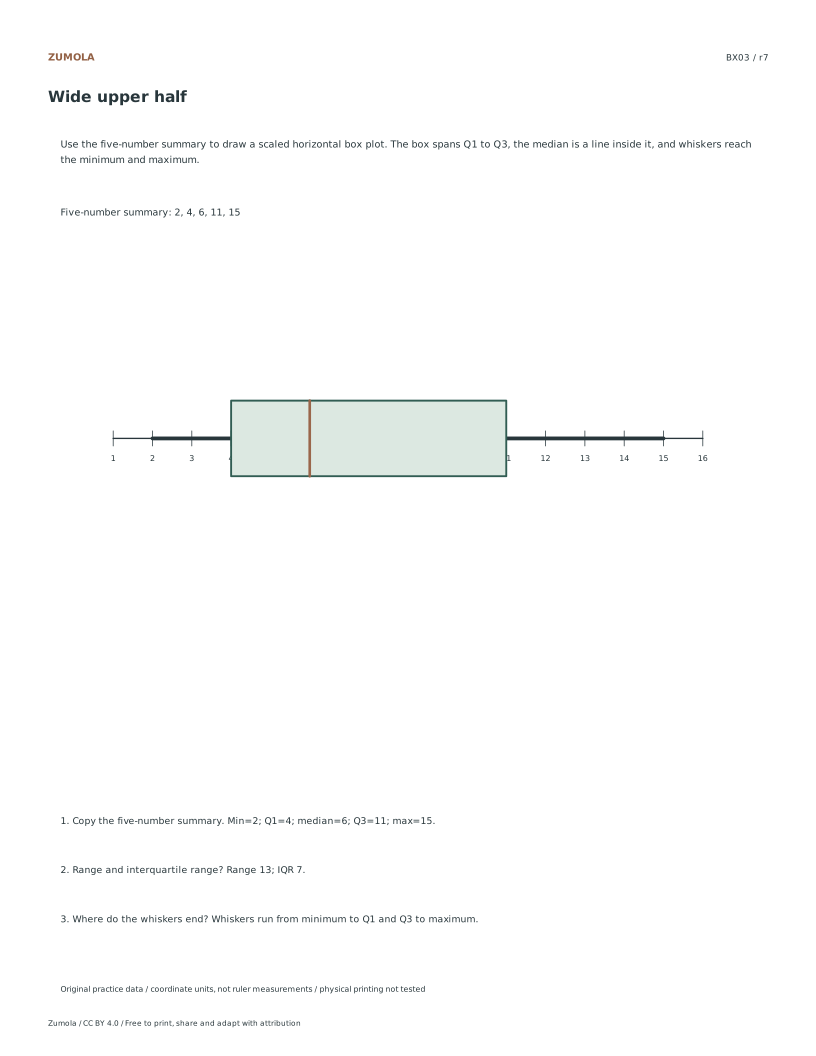
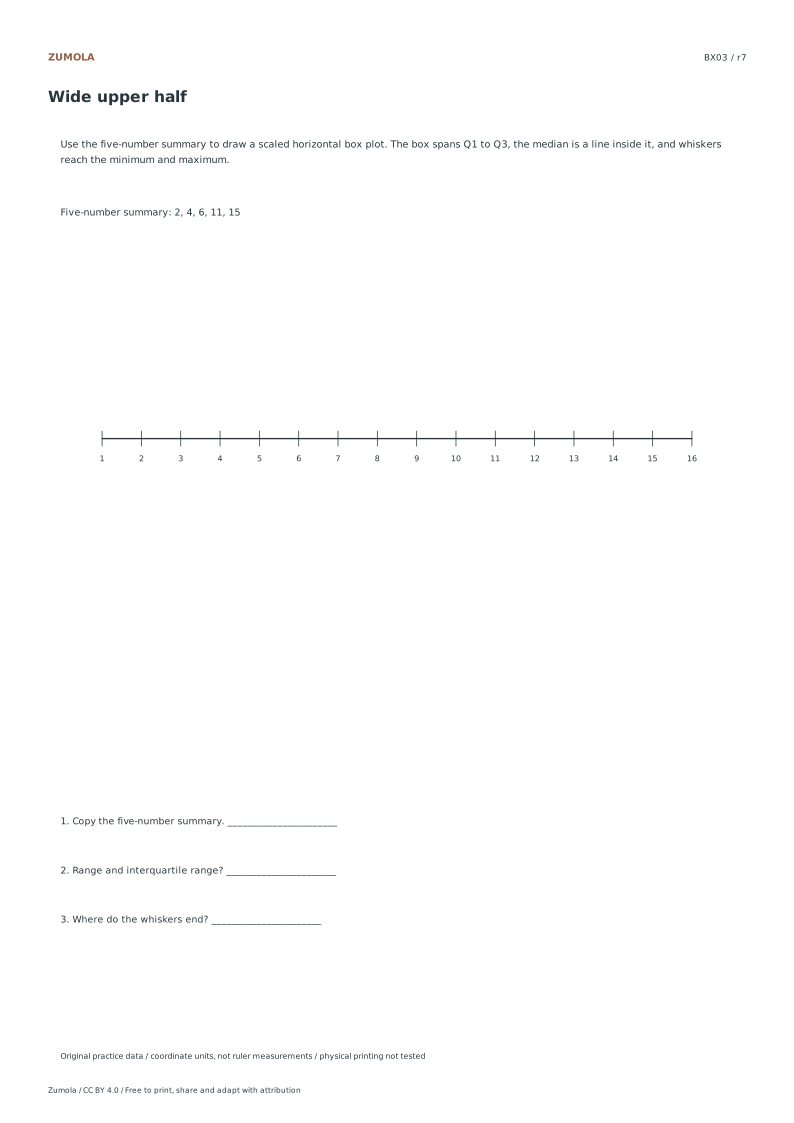
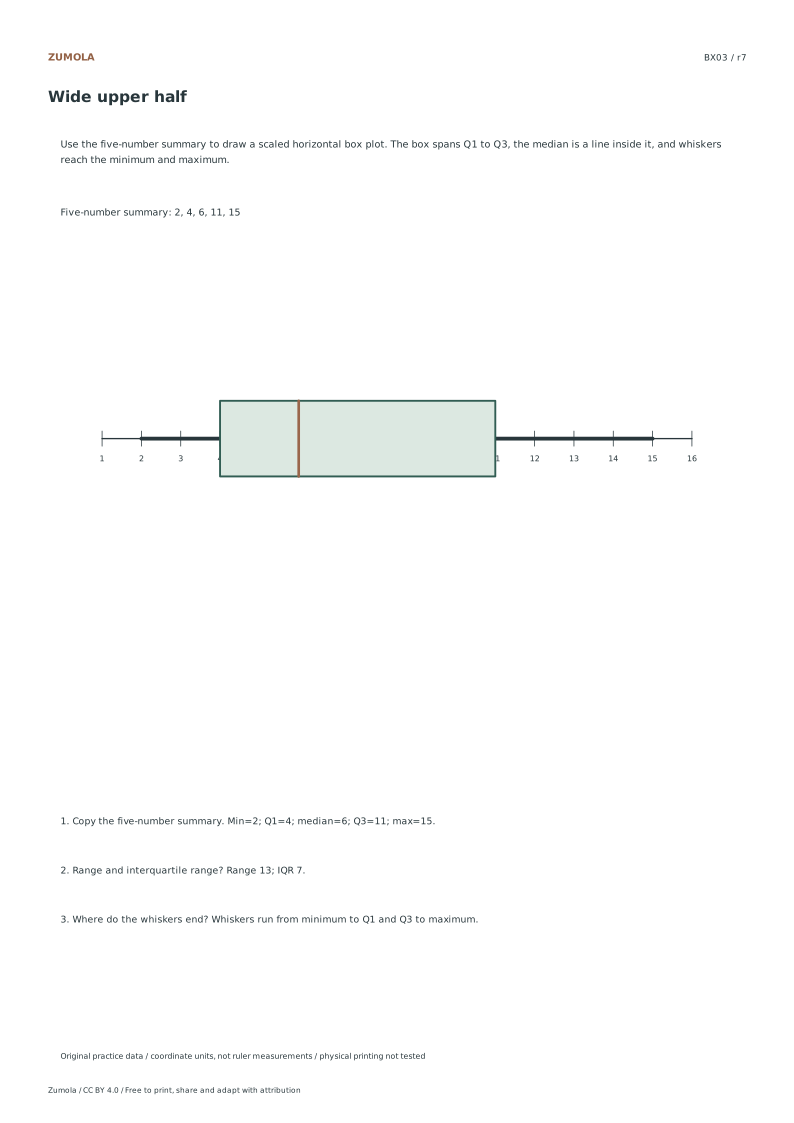
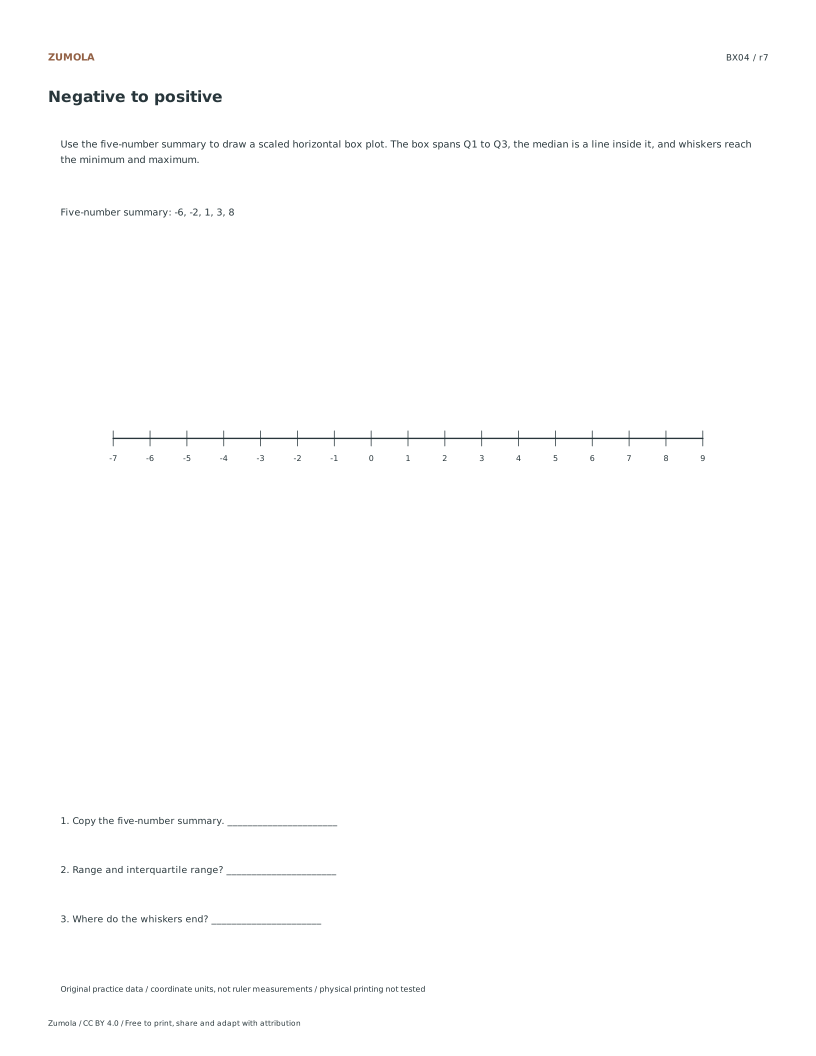
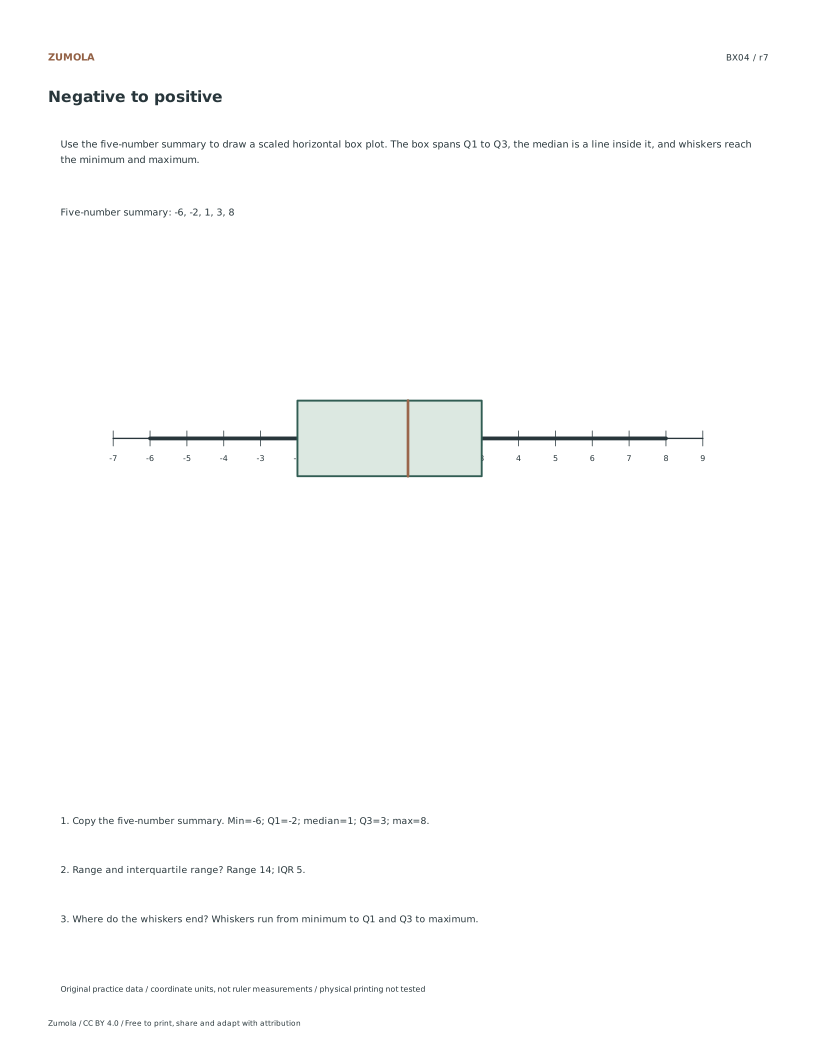
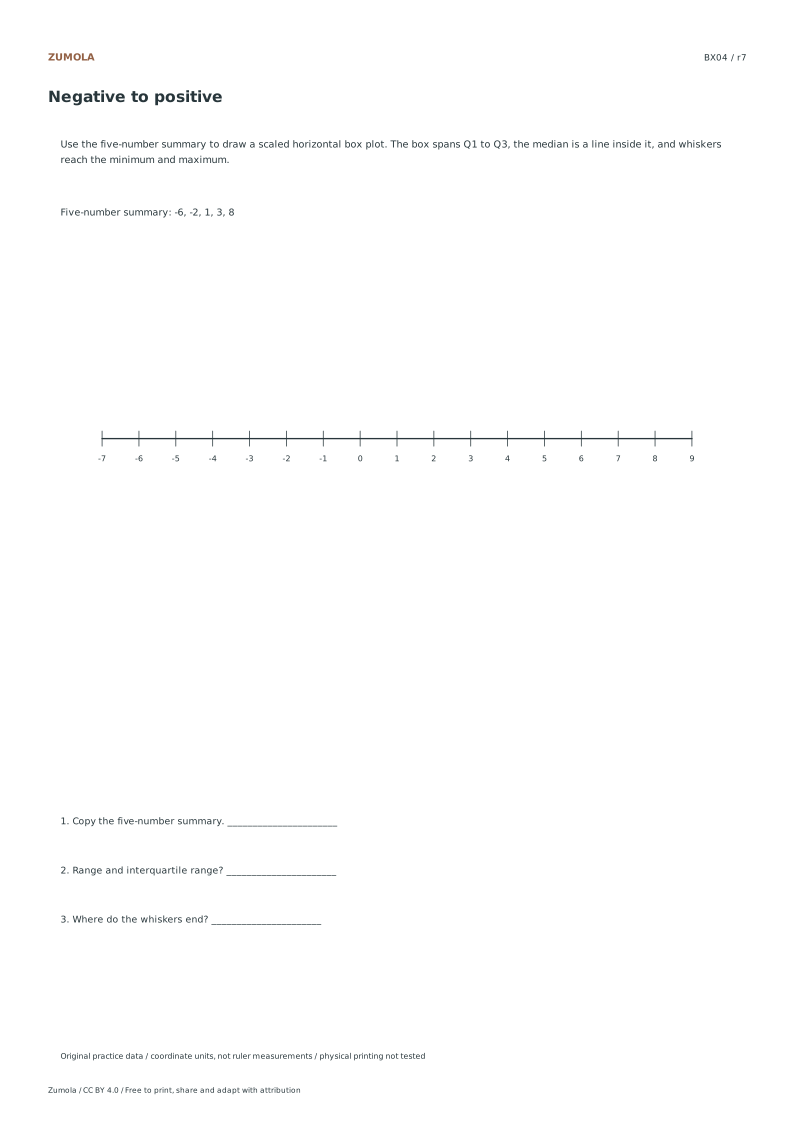
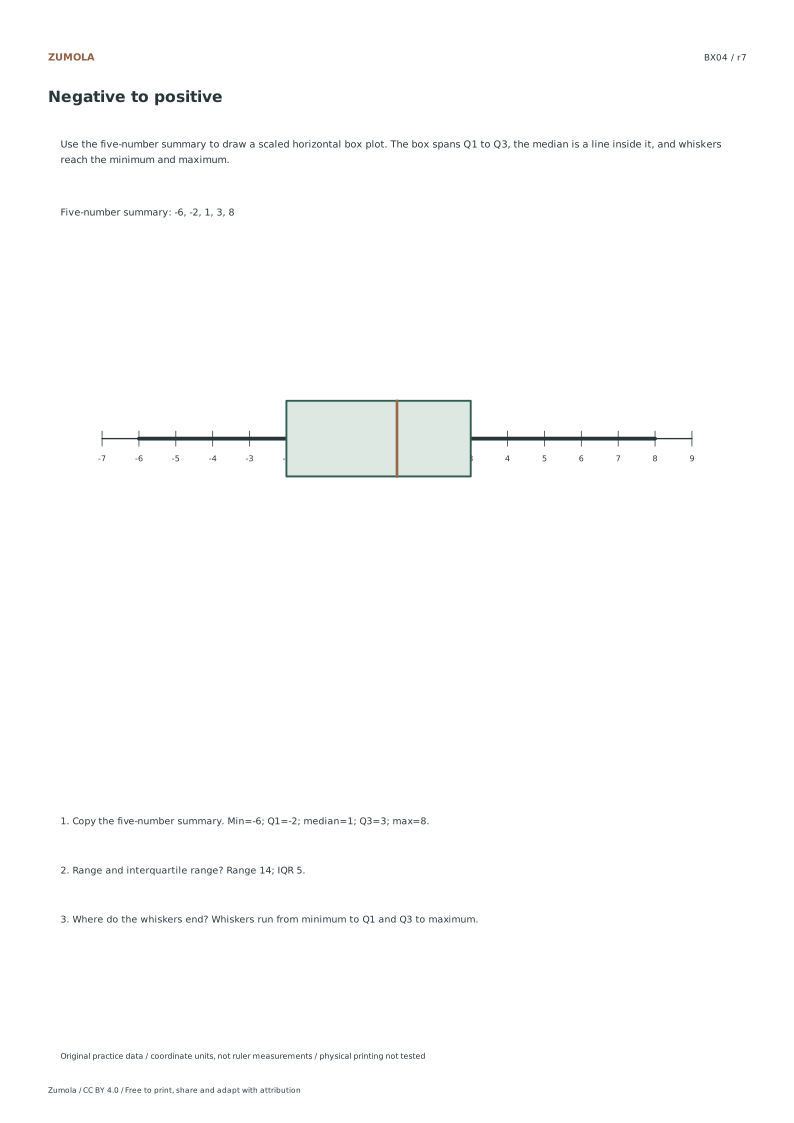
Draw four box plots from minimum, Q1, median, Q3 and maximum. Calculate range and IQR while keeping the supplied five-number summary visible.
Choose Letter or A4, then download a student sheet first. Keep the separate reference or answer file closed until you have attempted the case. Every worksheet, SVG and answer is free without signup.
Choose your paper and download
Download paper size
Every worksheet and answer is free. No signup.
Free original resourceBX01
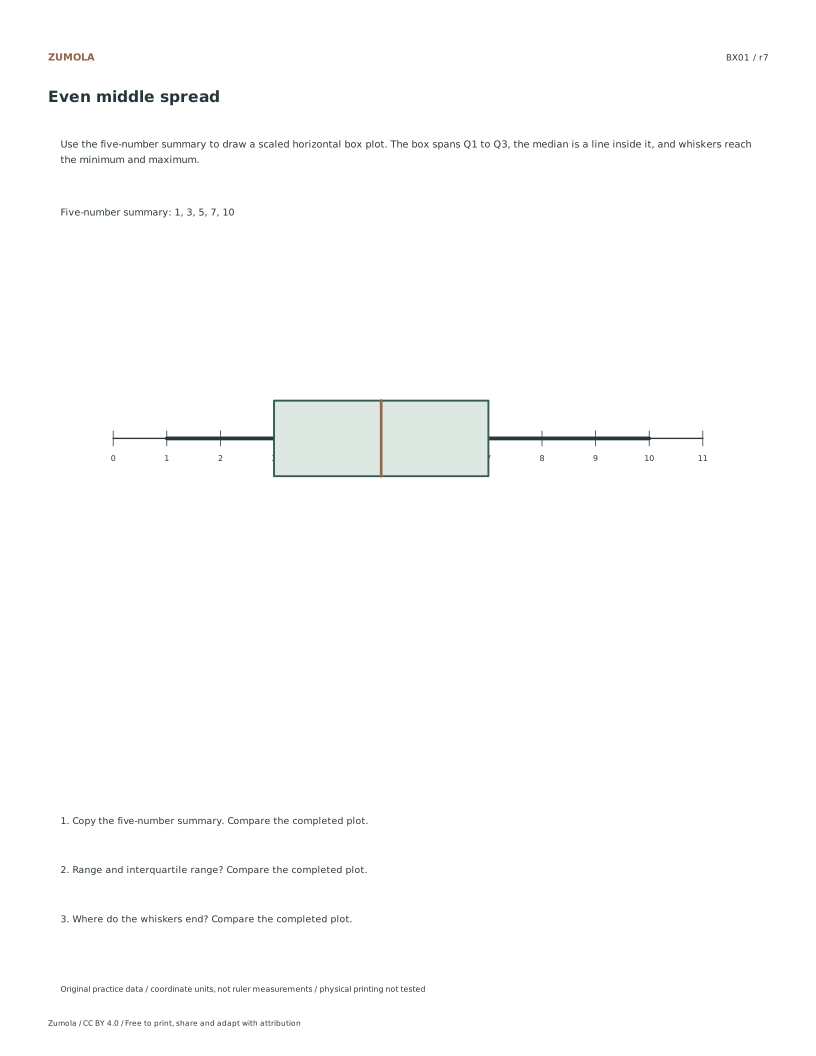
Even middle spread
Original worksheet collection. Letter or A4 PDF and editable SVG.
All examples use original fictional data and coordinate units. They are practice material, not measured classroom results, published questions or evidence about real people.
Check the first case
BX01: Even middle spread
Check
Worked result
1
Min=1; Q1=3; median=5; Q3=7; max=10.
2
Range 9; IQR 4.
3
Whiskers run from minimum to Q1 and Q3 to maximum.
The first case shows the checking pattern. Individual answer files contain the completed graph and result for every case.
Work through the graph
Verify the Five-Number Summary
Begin by identifying the five specific values provided for your chosen case, such as minimum, first quartile, median, third quartile, and maximum. These numbers are fixed fictional data points that dictate the entire diagram. Do not calculate new statistics or apply outlier rules, as the supplied values alone control the visual output. Confirm that you have the correct set, like the even middle spread or negative to positive examples, before drawing. This step ensures that your subsequent geometric construction aligns perfectly with the listed coordinates defined in the original resource files, preventing misalignment during the manual plotting process.
Construct the Scaled Number Line
Draw a horizontal line and mark the scale based on the minimum and maximum values of your selected case. For instance, if the range spans from negative six to eight, ensure the spacing accommodates both extremes clearly. Label the axis with appropriate intervals to maintain proportionality. This foundational step requires careful attention to distance, as the box and whiskers must fit within these boundaries. The scale must reflect the exact numerical distance between the lowest and highest points provided in the fictional dataset, ensuring the final box plot accurately represents the spread without distortion or compression of the visual space.
Plot the Box and Whiskers
Using your scaled line, draw a rectangular box extending from the first quartile to the third quartile. Inside this box, draw a vertical line at the median position. Extend horizontal whiskers from the box edges to the minimum and maximum values. Ensure the whiskers connect directly to the box sides. This geometric arrangement visually represents the distribution defined by the five numbers. Since no outlier rules apply, the whiskers always reach the extreme values. Check that the median line divides the box according to the specific quartile positions, creating a clear visual summary of the fictional data structure.
Checks that catch common errors
Watch for
Check instead
Applying standard outlier detection rules to trim the whiskers.
Ignore outlier rules entirely. The whiskers must extend exactly to the supplied minimum and maximum values, regardless of distance from the quartiles, as the five given numbers fully define the diagram.
Calculating new quartiles from raw data instead of using provided values.
Use only the five specific numbers given in the case file. These are fixed fictional values that determine the box and median positions directly, so no additional statistical computation is required or permitted.
Assuming physical print dimensions match digital coordinate scales.
Rely on the relative positions of the five numbers on your drawn line. Physical printing checks are not performed, so focus on the logical spacing derived from the digital coordinates rather than absolute paper measurements.
Keep the labels and margins readable
Choose the PDF that matches your paper. Print at Actual size / 100% and turn off Fit, Shrink and browser headers. SVG is editable but an editor can rescale it; the PDF is the simpler print route. Physical printer, classroom and curriculum tests have not been completed.
Useful answers
What five values define a box plot?
Minimum, Q1, median, Q3 and maximum. The box spans Q1 to Q3.
What is the IQR?
The interquartile range is Q3-Q1.
Are outlier rules used here?
No. These cases use the supplied five-number summary directly.
Are the answer files and editable graphs free?
Yes. The individual student, reference and answer files plus collection packs are free without signup. Credit Zumola under CC BY 4.0 when sharing or adapting.
Further reading: OpenStax: box plots. The diagrams, datasets and exercises here are original Zumola work.
Your analytics choice
Optional Google Analytics helps us understand which free resources are useful. It is off until you allow it. Drawing tools and downloads work with either choice. Privacy details