HomeConstant of Proportionality: Tables and Graphs Worksheet Plan Free original lessons
Constant of Proportionality: Tables and Graphs Worksheet Plan
Learn to extract k from ratio tables and proportional lines, write unit-rate statements, and check work with a printable worksheet plan.
Free downloads
Letter & A4
PDF & SVG
Algebra and Function Practice
The constant of proportionality k links two proportional quantities: y = kx. In a ratio table, k is the quotient y/x for every pair. On a graph, a proportional line passes through the origin, and k is the vertical change divided by the horizontal change between any two points on the line. This lesson shows how to compute k, state it as a unit rate, and verify consistency. A printable worksheet with the four original lesson tasks, independent blank work areas, full original keys/reasons/checks, a worked example, and essential figures is available in both paper sizes; any numbered supplementary extension sets or extra diagrams remain separate extensions and are not included.
Practice materials: Download the free reference pages, practice sheets and separate answer keys below, in A4 and US Letter PDF and SVG formats.
Finding k in ratio tables
A ratio table lists paired values of two proportional quantities. Because the ratio y/x is constant, choose any row, divide the y-value by the x-value, and simplify. The result is k. Check a second row to confirm the same quotient.
Write the unit-rate statement in words: for each 1 unit of x, y changes by k units. Keep units consistent and label them explicitly.
- Pick a row with nonzero x.
- Compute y divided by x.
- Simplify the fraction or decimal.
- Repeat with another row to confirm k is unchanged.
- Write the unit-rate statement with units.
Finding k on proportional graphs
A proportional graph is a straight line through the origin. Choose two points on the line, preferably with integer coordinates, and compute the vertical change divided by the horizontal change. That quotient equals k.
If the line passes through (0,0) and (a,b), then k = b/a. The point (1,k) is always on the line, which gives a quick visual check.
- Confirm the line passes through the origin.
- Select two clear points on the line.
- Subtract y-values to get vertical change.
- Subtract x-values to get horizontal change.
- Divide vertical change by horizontal change and simplify.
Writing and checking unit-rate statements
A unit-rate statement connects k to the context. For example, if k = 3 and x is hours while y is dollars, write: for each 1 hour, the cost is 3 dollars. Avoid swapping the quantities; the statement must match the table or graph labels.
To check, substitute a known pair into y = kx. If the equation holds for every pair, the value of k is consistent.
- Identify the meaning and units of x and y.
- State k as the amount of y per 1 unit of x.
- Substitute one table pair or graph point into y = kx.
- Verify the equation is true.
- Repeat with a second pair or point.
Worked example
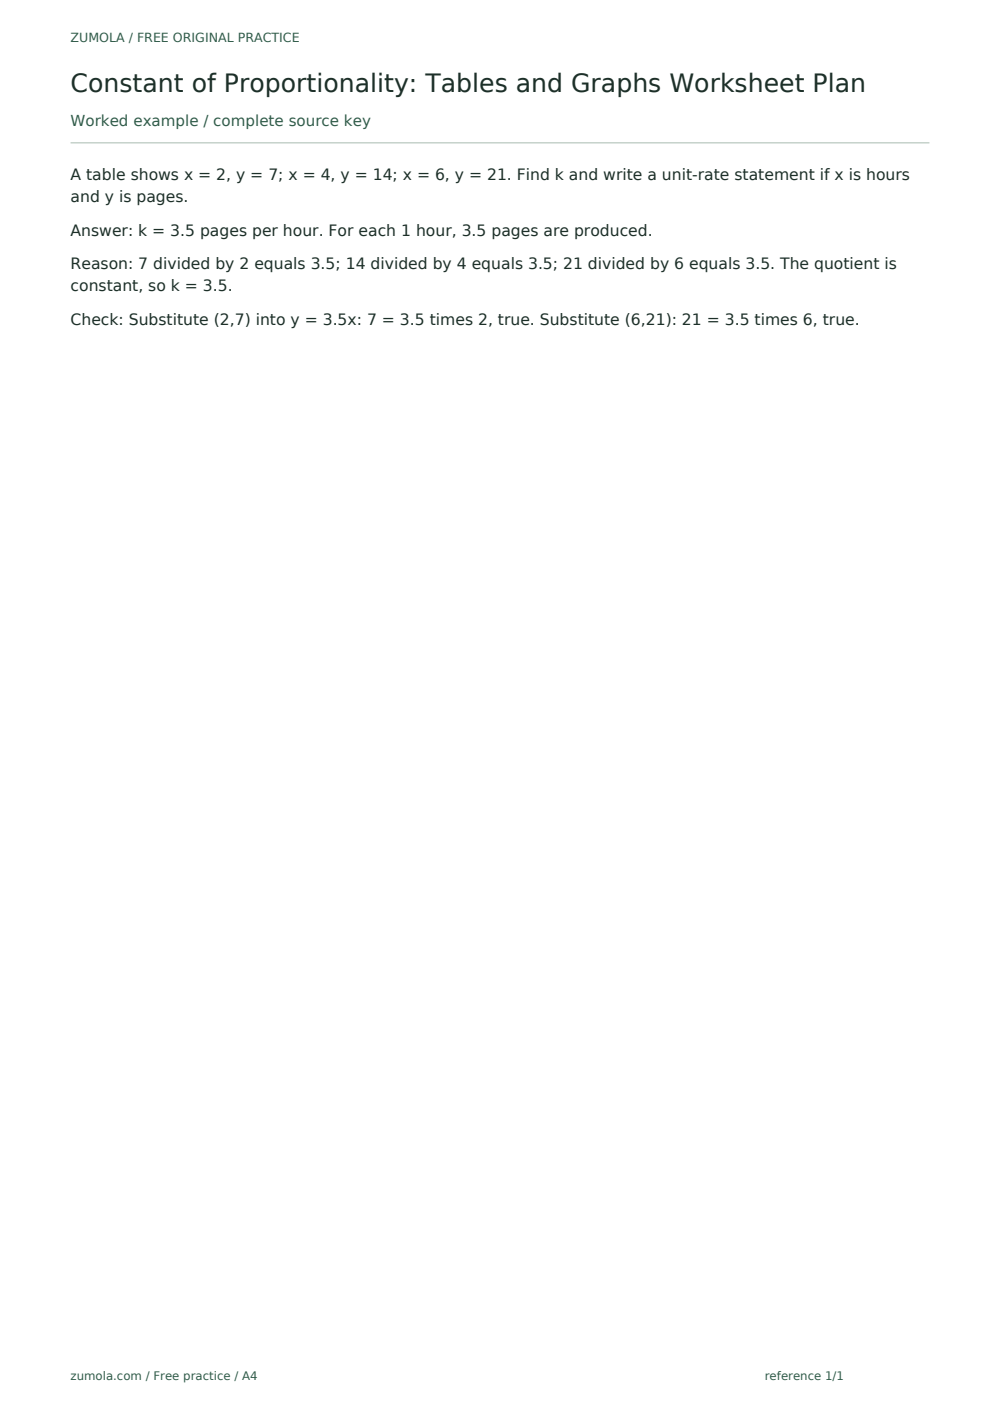
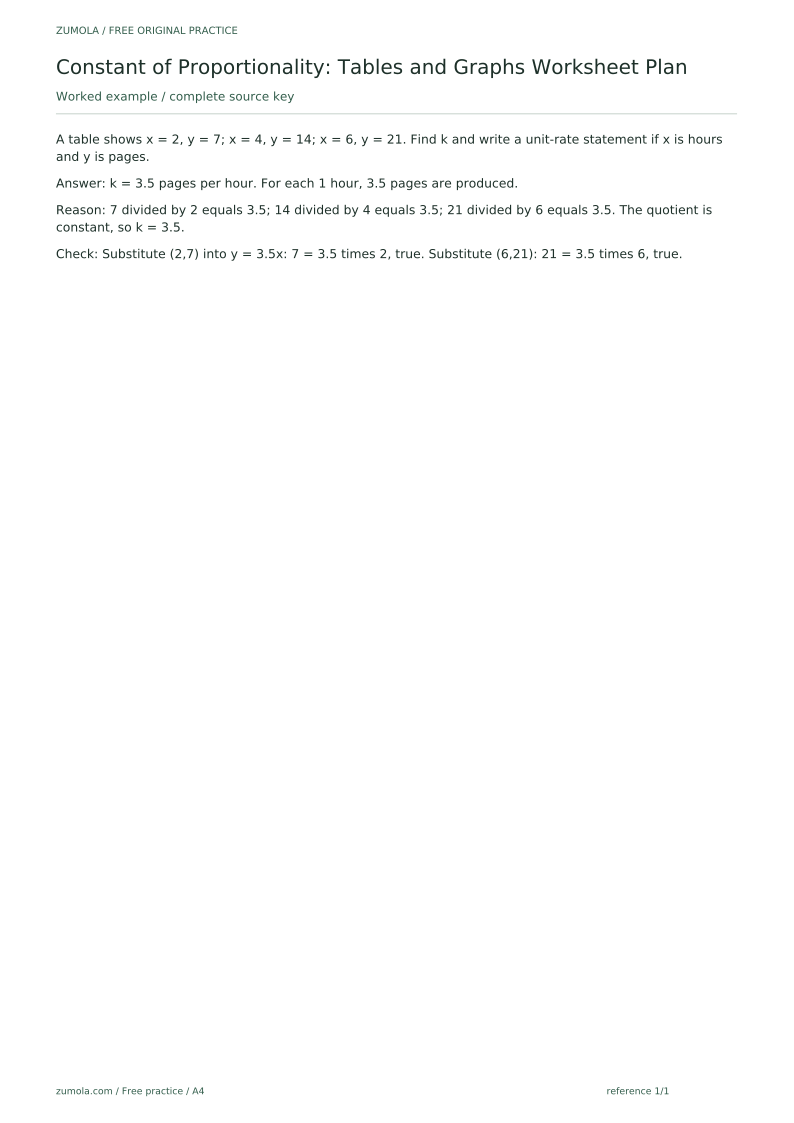
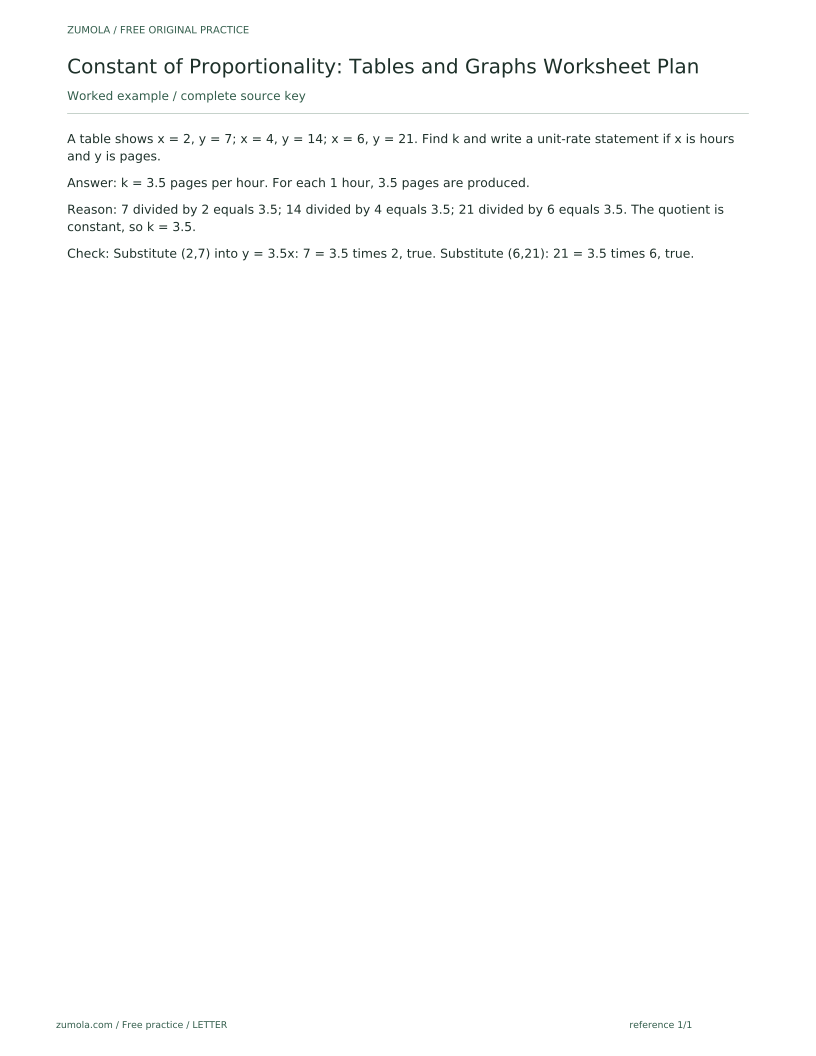
A table shows x = 2, y = 7; x = 4, y = 14; x = 6, y = 21. Find k and write a unit-rate statement if x is hours and y is pages.
Worked answer
k = 3.5 pages per hour. For each 1 hour, 3.5 pages are produced.
Why: 7 divided by 2 equals 3.5; 14 divided by 4 equals 3.5; 21 divided by 6 equals 3.5. The quotient is constant, so k = 3.5.
Check: Substitute (2,7) into y = 3.5x: 7 = 3.5 times 2, true. Substitute (6,21): 21 = 3.5 times 6, true.
Four practice exercises
Exercise 1
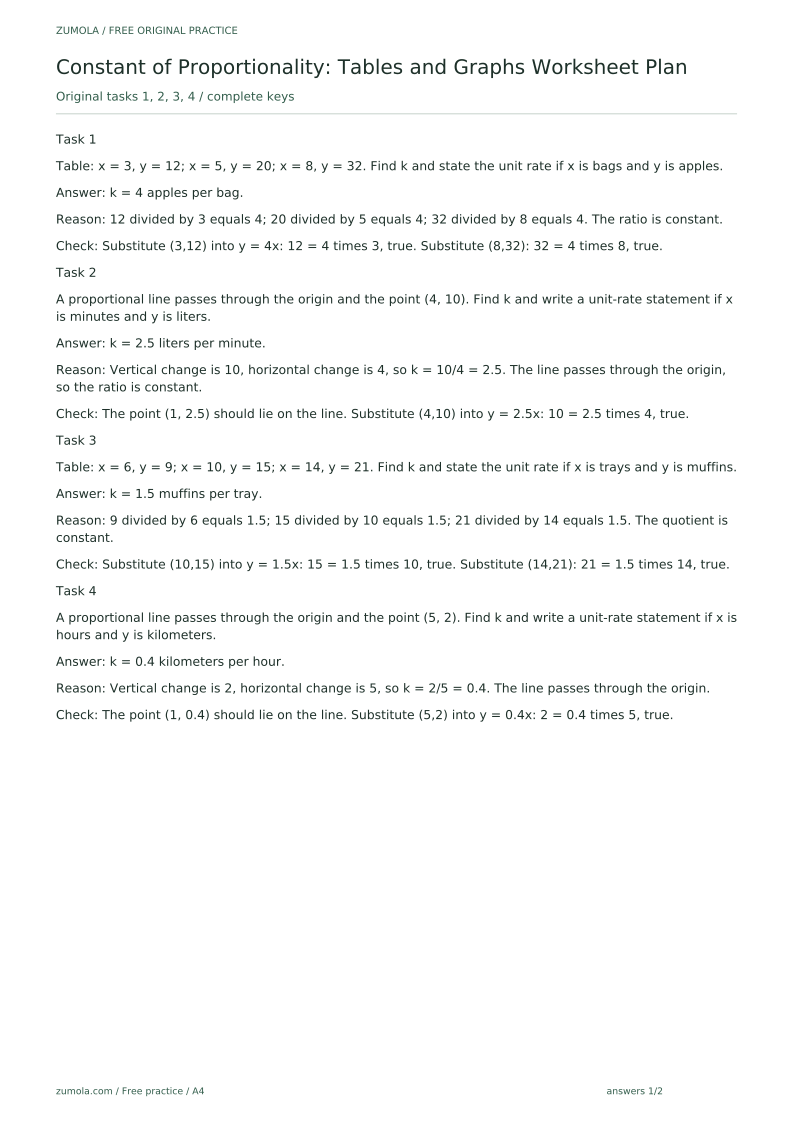
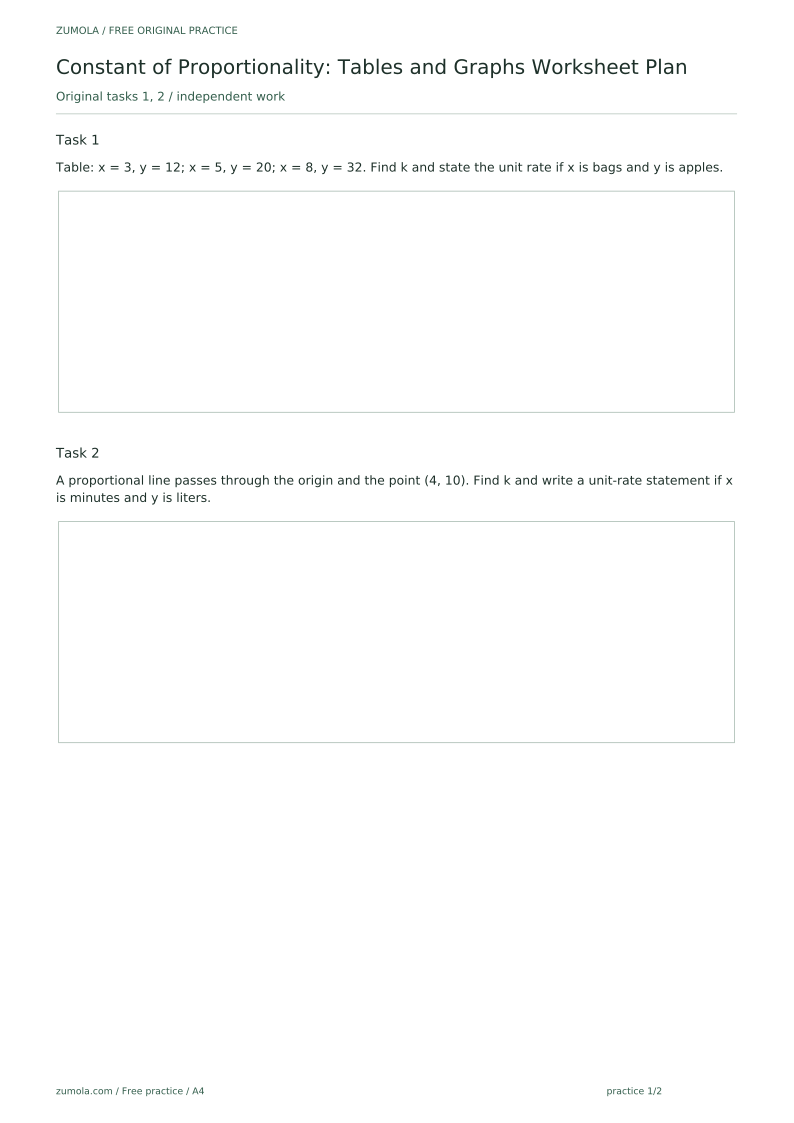
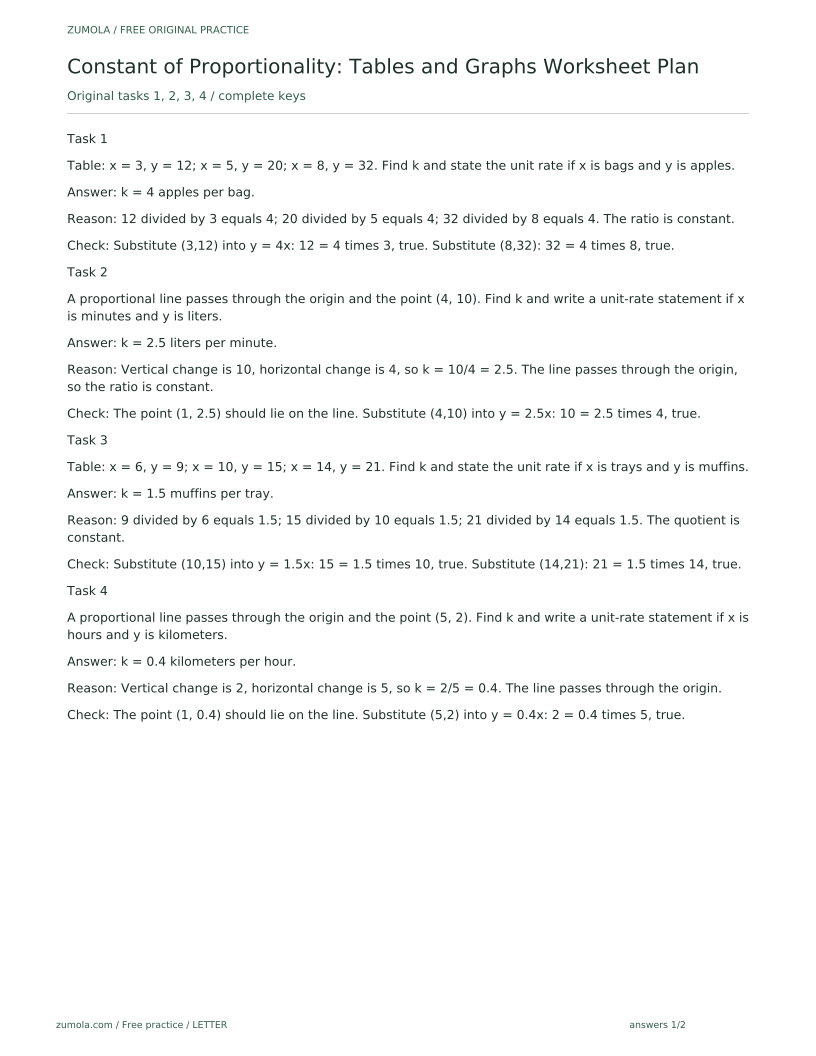
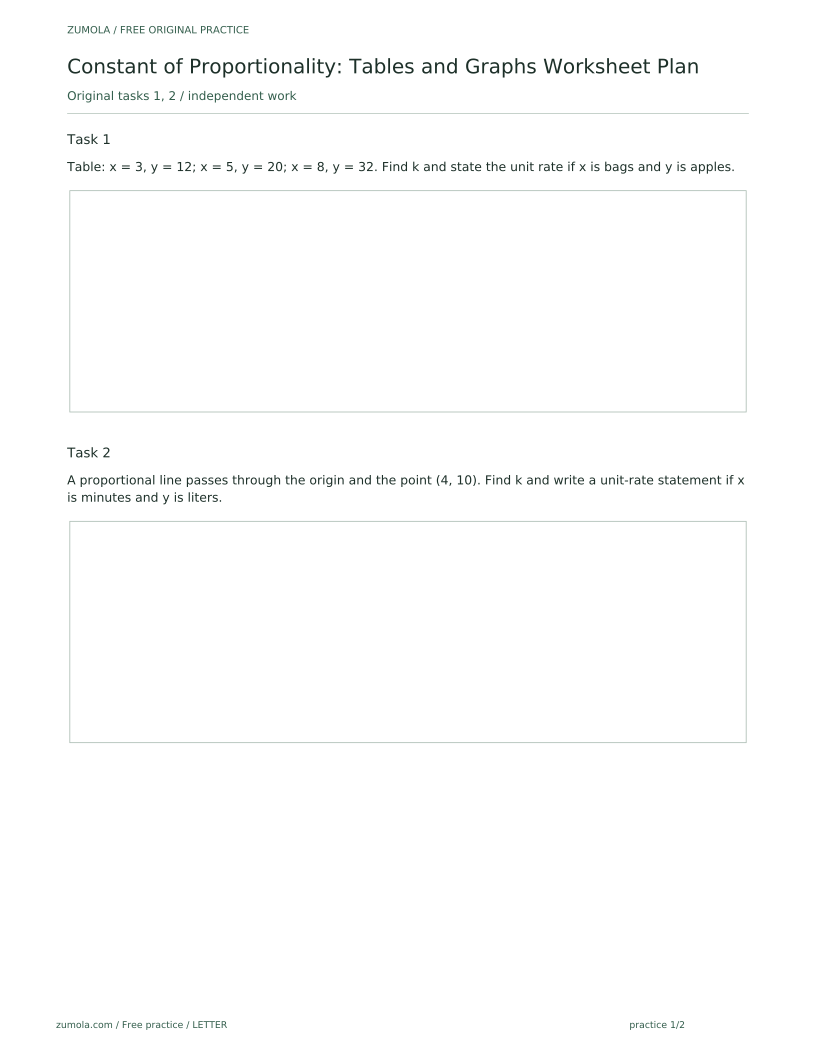
Table: x = 3, y = 12; x = 5, y = 20; x = 8, y = 32. Find k and state the unit rate if x is bags and y is apples.
Show answer and check
k = 4 apples per bag.
Why: 12 divided by 3 equals 4; 20 divided by 5 equals 4; 32 divided by 8 equals 4. The ratio is constant.
Check: Substitute (3,12) into y = 4x: 12 = 4 times 3, true. Substitute (8,32): 32 = 4 times 8, true.
Exercise 2
A proportional line passes through the origin and the point (4, 10). Find k and write a unit-rate statement if x is minutes and y is liters.
Show answer and check
k = 2.5 liters per minute.
Why: Vertical change is 10, horizontal change is 4, so k = 10/4 = 2.5. The line passes through the origin, so the ratio is constant.
Check: The point (1, 2.5) should lie on the line. Substitute (4,10) into y = 2.5x: 10 = 2.5 times 4, true.
Exercise 3
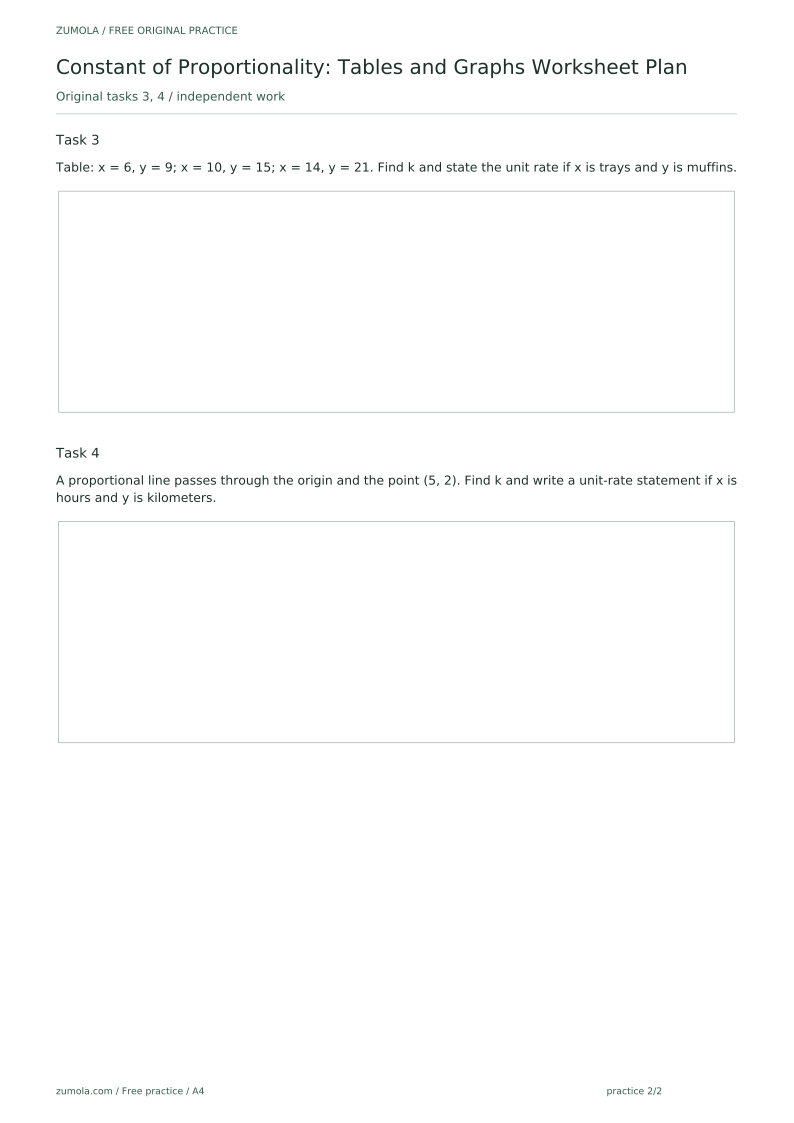
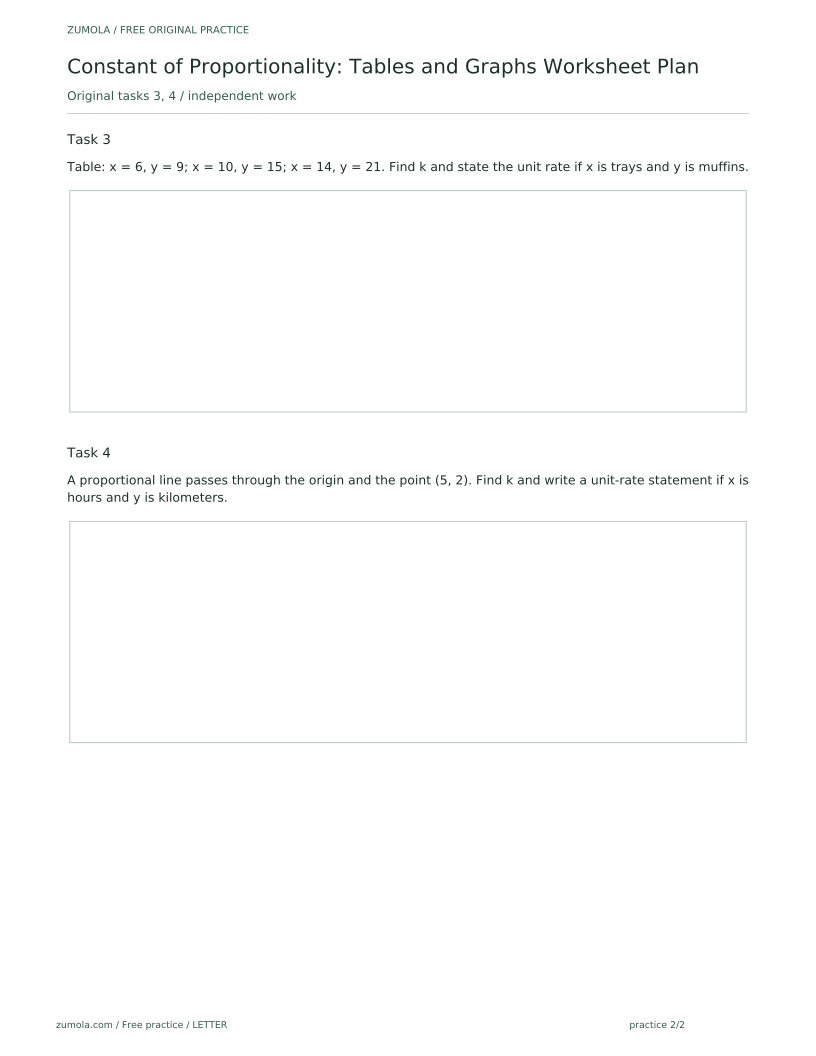
Table: x = 6, y = 9; x = 10, y = 15; x = 14, y = 21. Find k and state the unit rate if x is trays and y is muffins.
Show answer and check
k = 1.5 muffins per tray.
Why: 9 divided by 6 equals 1.5; 15 divided by 10 equals 1.5; 21 divided by 14 equals 1.5. The quotient is constant.
Check: Substitute (10,15) into y = 1.5x: 15 = 1.5 times 10, true. Substitute (14,21): 21 = 1.5 times 14, true.
Exercise 4
A proportional line passes through the origin and the point (5, 2). Find k and write a unit-rate statement if x is hours and y is kilometers.
Show answer and check
k = 0.4 kilometers per hour.
Why: Vertical change is 2, horizontal change is 5, so k = 2/5 = 0.4. The line passes through the origin.
Check: The point (1, 0.4) should lie on the line. Substitute (5,2) into y = 0.4x: 2 = 0.4 times 5, true.
Common mistakes
- Dividing x by y instead of y by x. Use k = y/x. Label the columns before dividing so the numerator and denominator are clear.
- Choosing a graph point not on the line. Read coordinates only where the line crosses grid intersections, then confirm the point satisfies y = kx.
- Forgetting to simplify the ratio. Reduce the fraction to lowest terms or divide the decimal fully, then check with a second pair.
- Writing a unit-rate statement with reversed quantities. Match the statement to the axis or column labels: y units per 1 x unit.
Self-check rubric
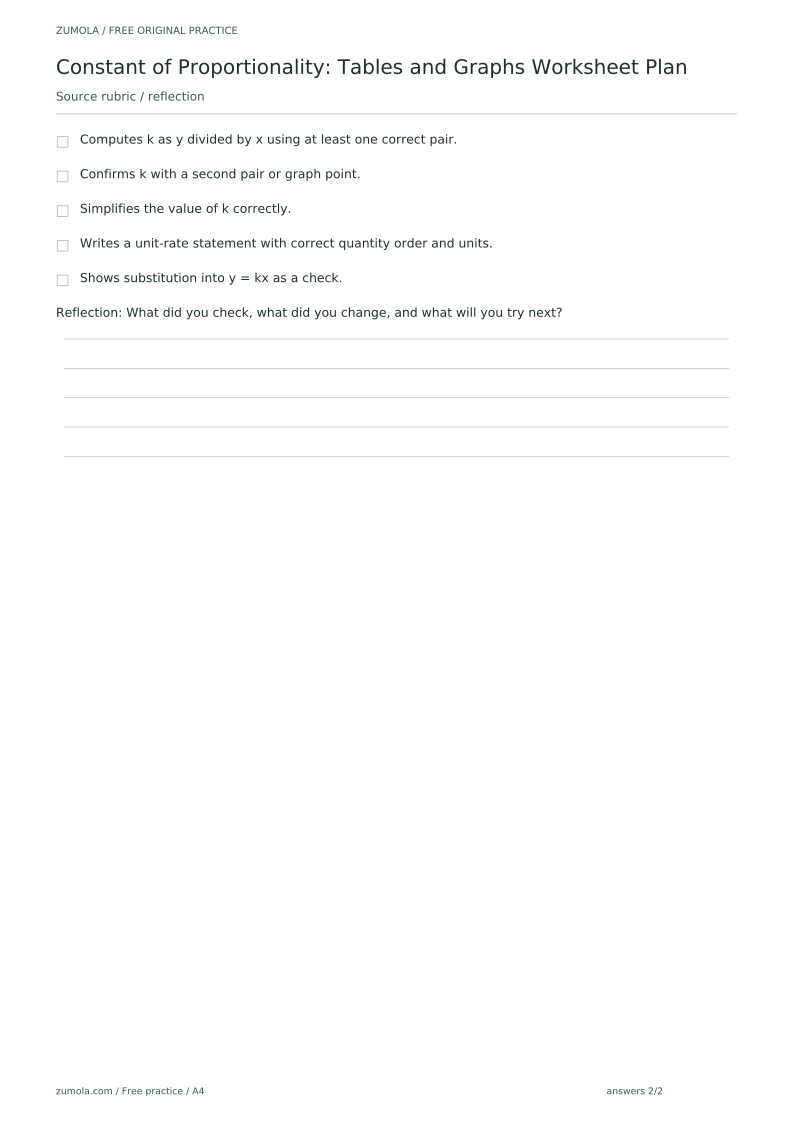
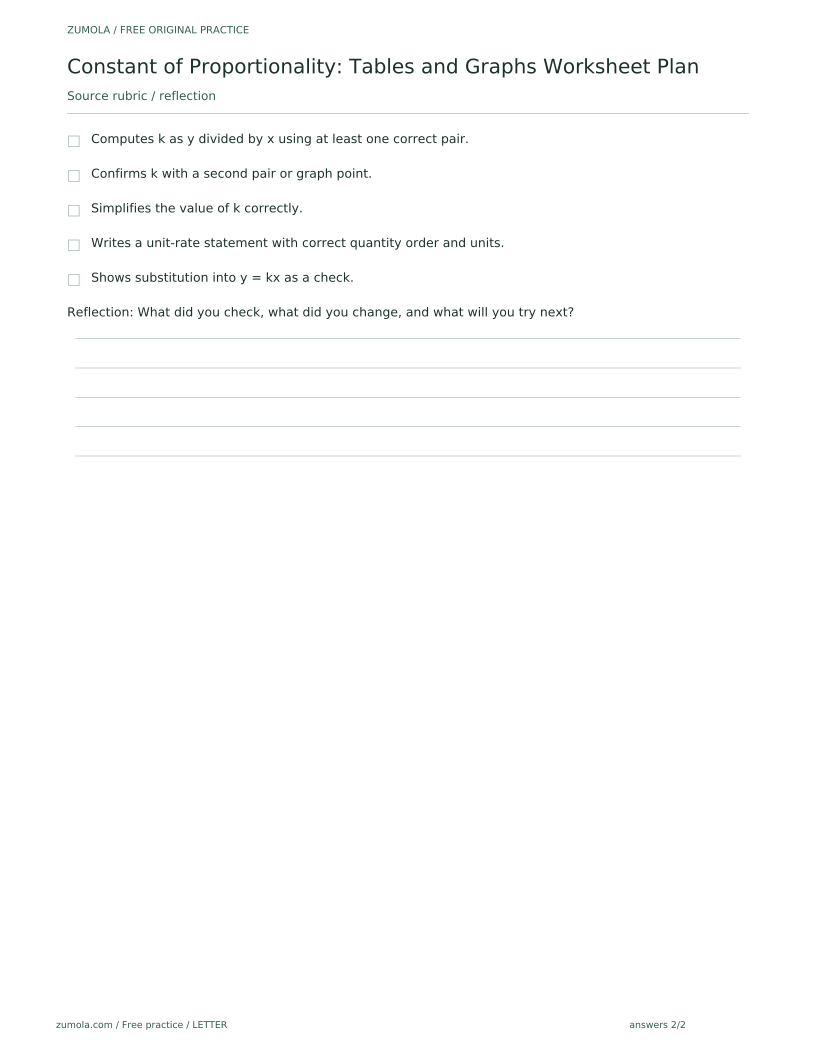
- Computes k as y divided by x using at least one correct pair.
- Confirms k with a second pair or graph point.
- Simplifies the value of k correctly.
- Writes a unit-rate statement with correct quantity order and units.
- Shows substitution into y = kx as a check.
Questions and answers
Can k be a fraction or decimal?
Yes. Any nonzero constant is valid. Simplify fractions and keep decimals consistent with the table values.
What if a table row has x = 0?
Skip that row for computing k because division by zero is undefined. Use another row with nonzero x.
How do I know a graph is proportional?
The graph must be a straight line through the origin. If it does not pass through (0,0), it is not proportional.
Why check more than one pair?
A single pair gives a candidate k. Checking a second pair confirms the ratio is constant and catches arithmetic errors.
Free printable downloads
Choose a paper size. Practice sheets and answer keys are separate. Download every file free, without registration.
This standard pack covers the four original exercises, blank work areas, complete keys and necessary figures. Additional extension sets described in the lesson are outside this download.
PDF bundles
Individual SVG pages
Reference-page preview