Free original lessons
Double Bar Graph Worksheet
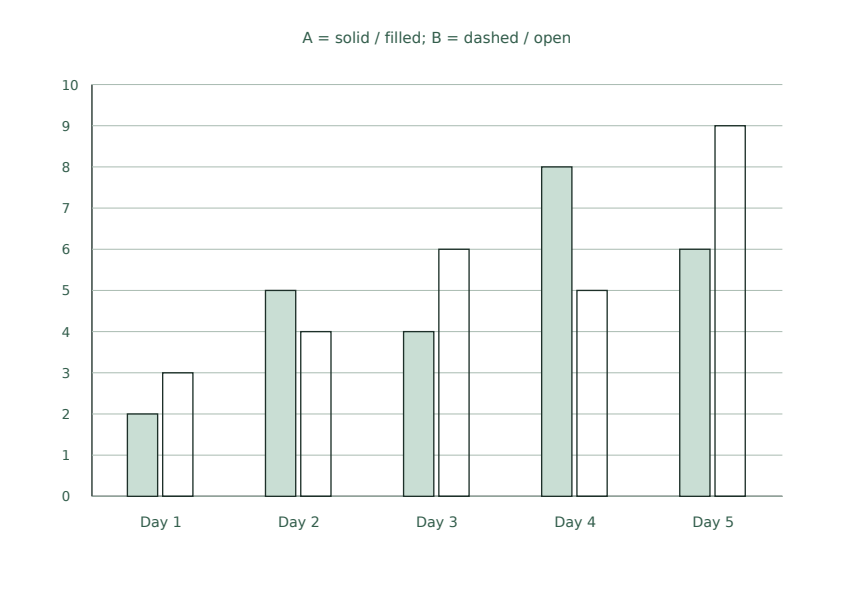
This free printable double bar graph worksheet gives students a complete, self-contained set of materials for reading and comparing two data series across five days. The data are invented classroom counts, not measured real-world statistics, so the focus stays on graph-reading skills rather than background knowledge.
Letter & A4
PDF & SVG
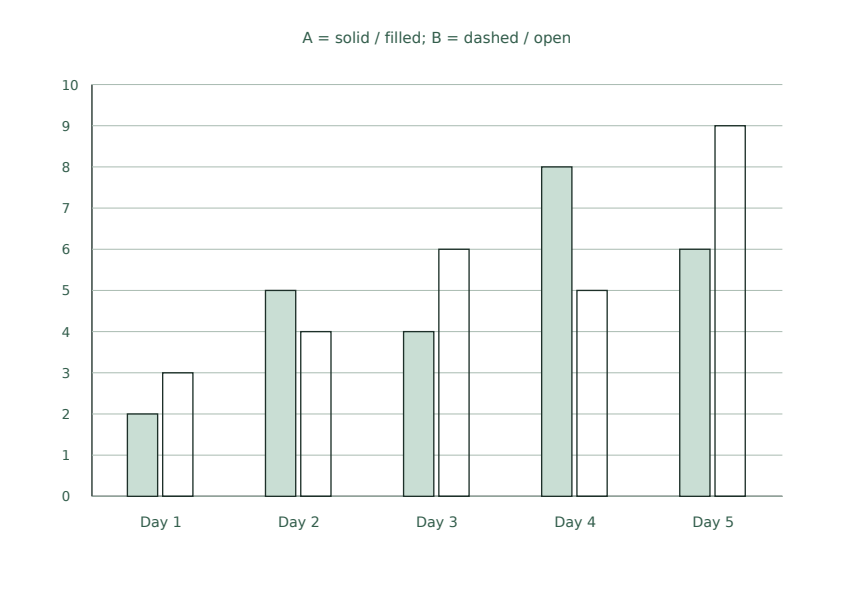
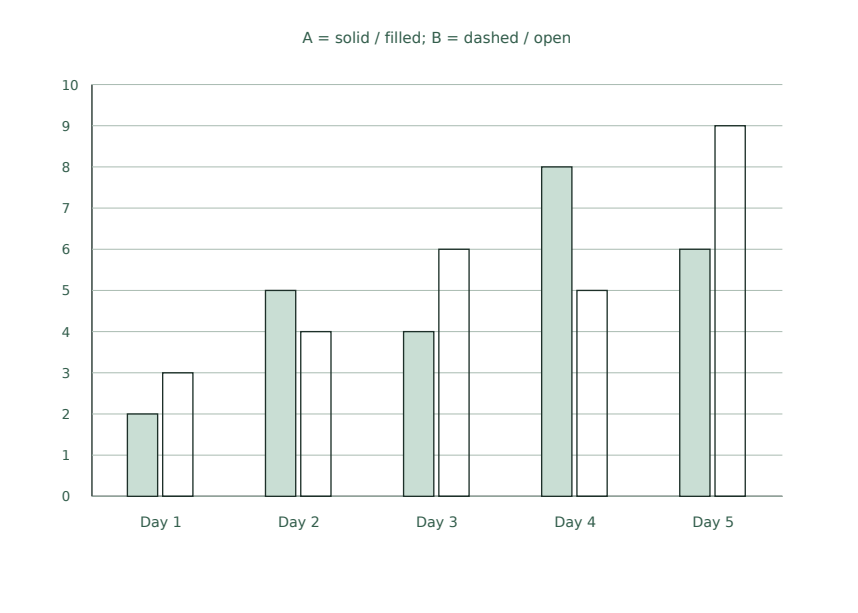
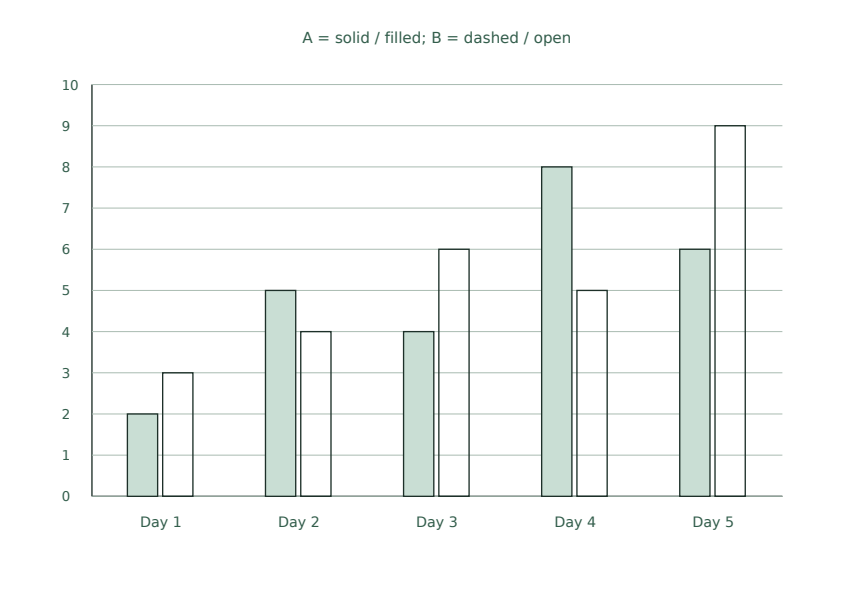
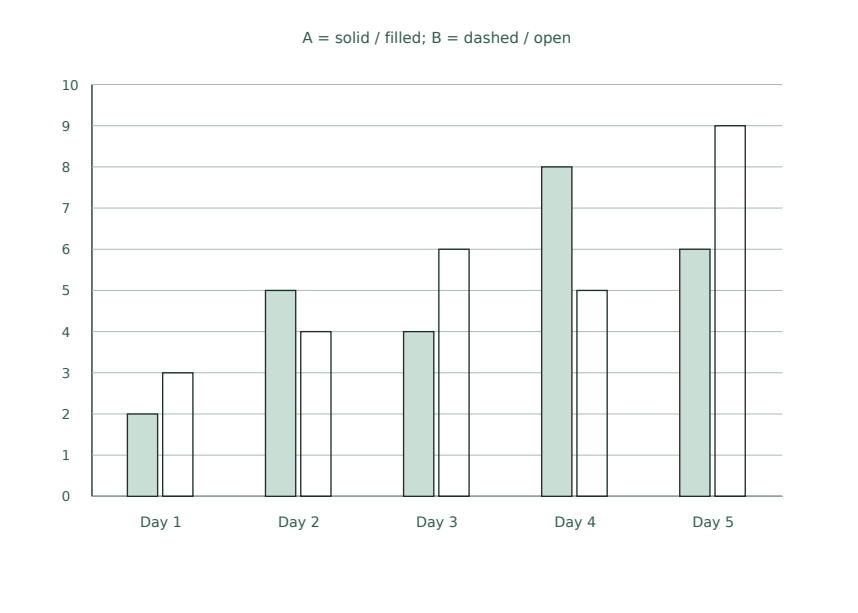
The pack contains six PDFs across A4 and US Letter, with separate reference, student and answer versions, plus per-page SVGs. The reference version solves the first task as a guided example, showing how to read a value from the graph; the student version leaves that same attempt area blank on purpose so learners can try it themselves. The graph has Days 1–5 on the horizontal axis and one-unit intervals on the vertical axis, with two series shown side by side. Students read individual values, identify the largest consecutive increase, total a series, and compare the two series on a given day. The answer PDFs let learners or teachers check each result against the labelled points and bar heights.
Download the complete resource pack
All individual editable SVG pages (18)
- A4 reference page 1
- A4 student page 1
- A4 student page 2
- A4 student page 3
- A4 student page 4
- A4 answer page 1
- A4 answer page 2
- A4 answer page 3
- A4 answer page 4
- LETTER reference page 1
- LETTER student page 1
- LETTER student page 2
- LETTER student page 3
- LETTER student page 4
- LETTER answer page 1
- LETTER answer page 2
- LETTER answer page 3
- LETTER answer page 4
Print at 100% / actual size. Use the stated scale on any schematic diagram; physical cutting templates are identified separately. A4 and US Letter are separate files. Free access, no signup; CC BY 4.0.
How to use these pages
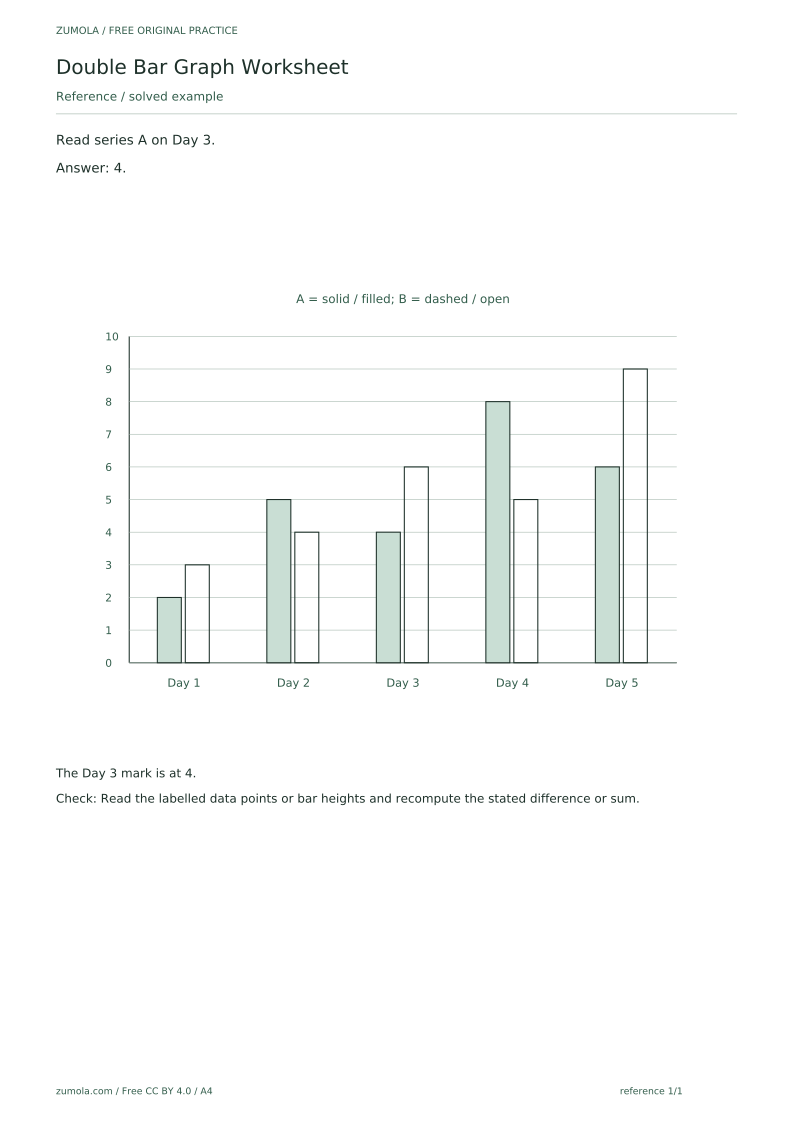
- Choose the A4 or US Letter reference PDF and walk through the solved first task together, pointing out how the Day 3 value is read from the graph.
- Hand out the matching student PDF and let learners complete the remaining tasks in the blank attempt area.
- Ask students to show their working by reading the labelled data points or bar heights and recomputing each difference or sum.
- Use the answer PDF to check responses, discussing any task where the reading or arithmetic differs.
- Print the per-page SVGs if you need individual graph pages for display or extra copies.
Four practice tasks and complete answers
Task 1
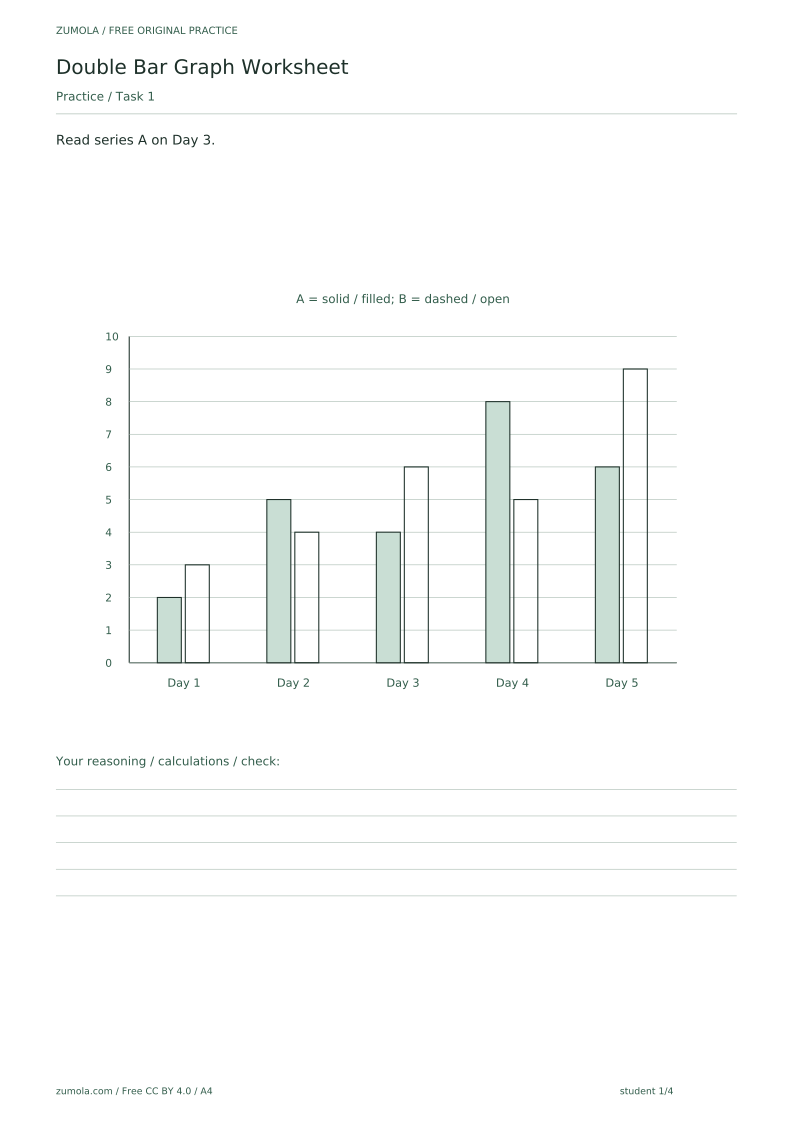
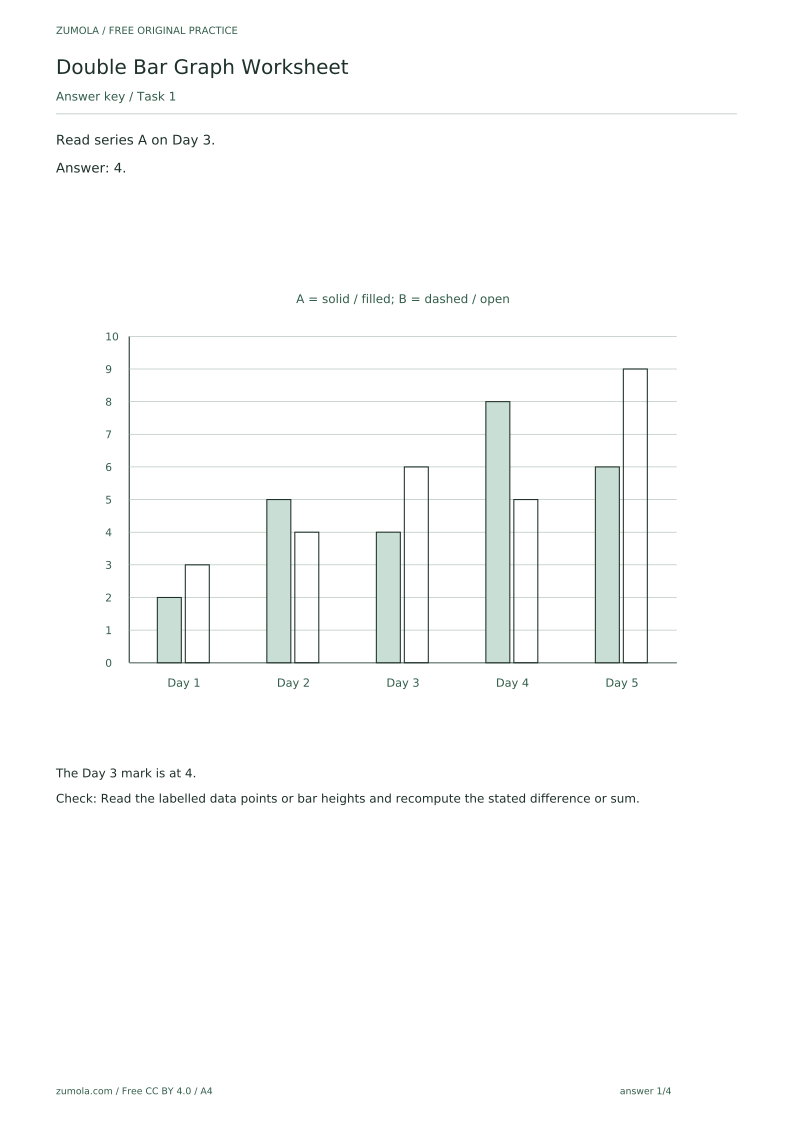
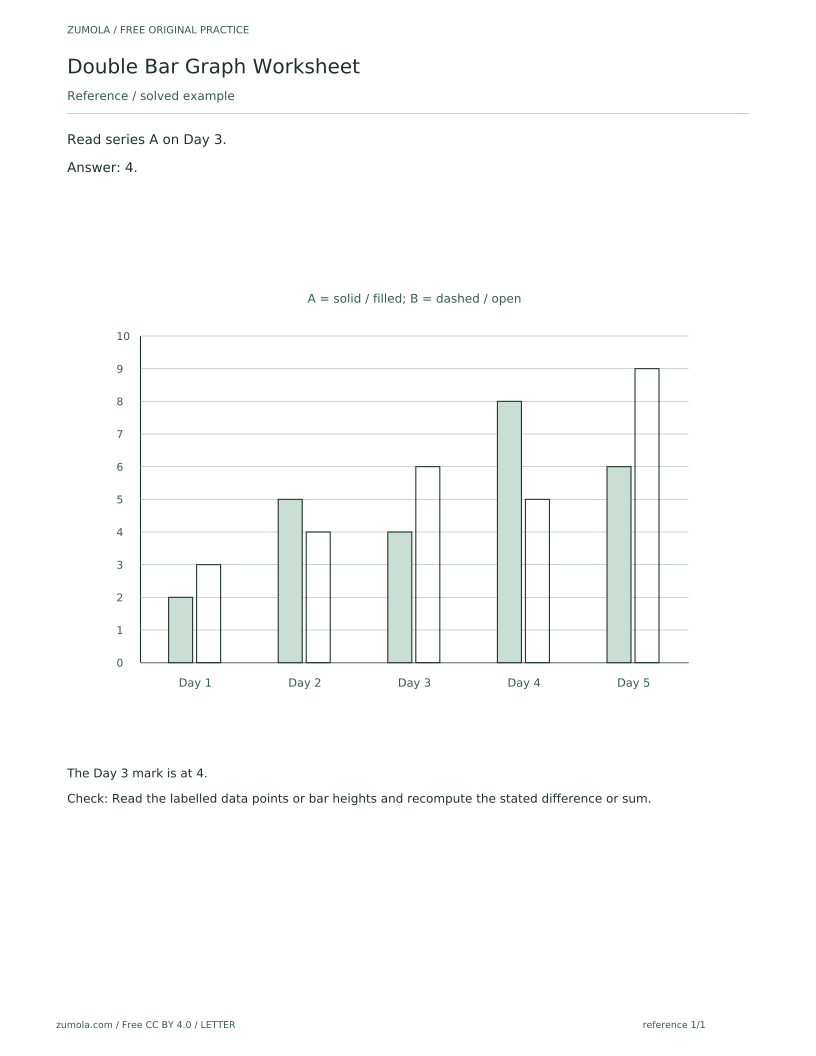
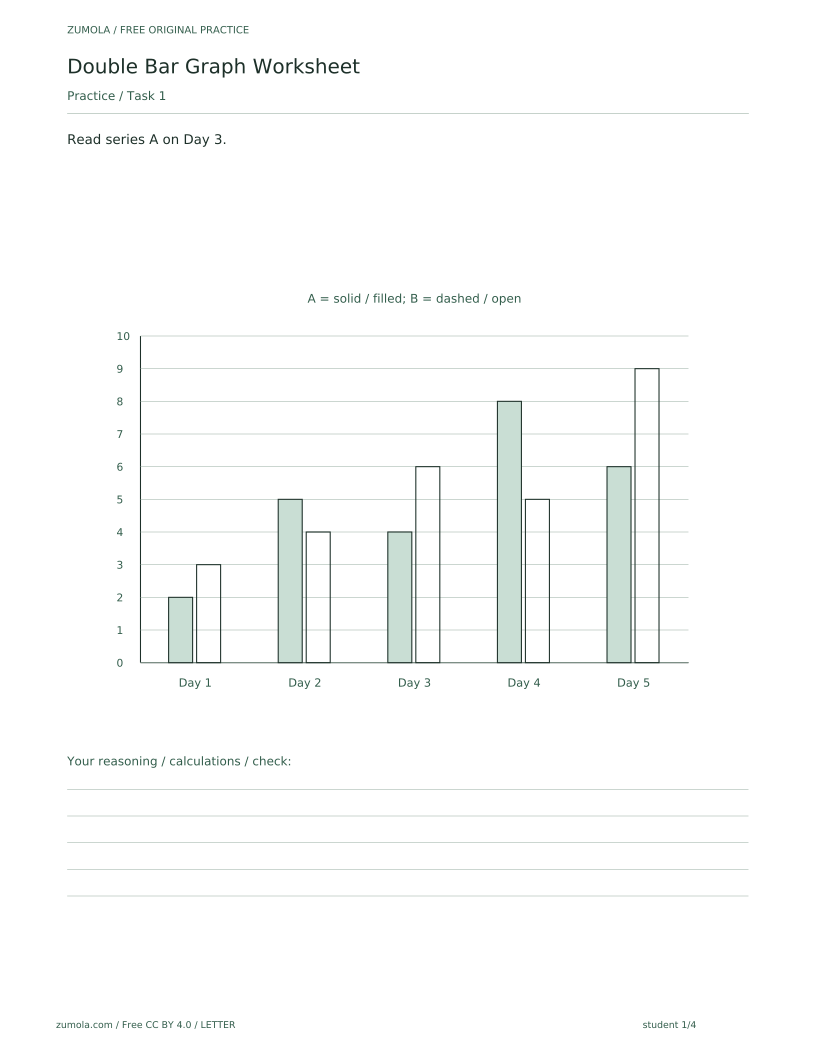
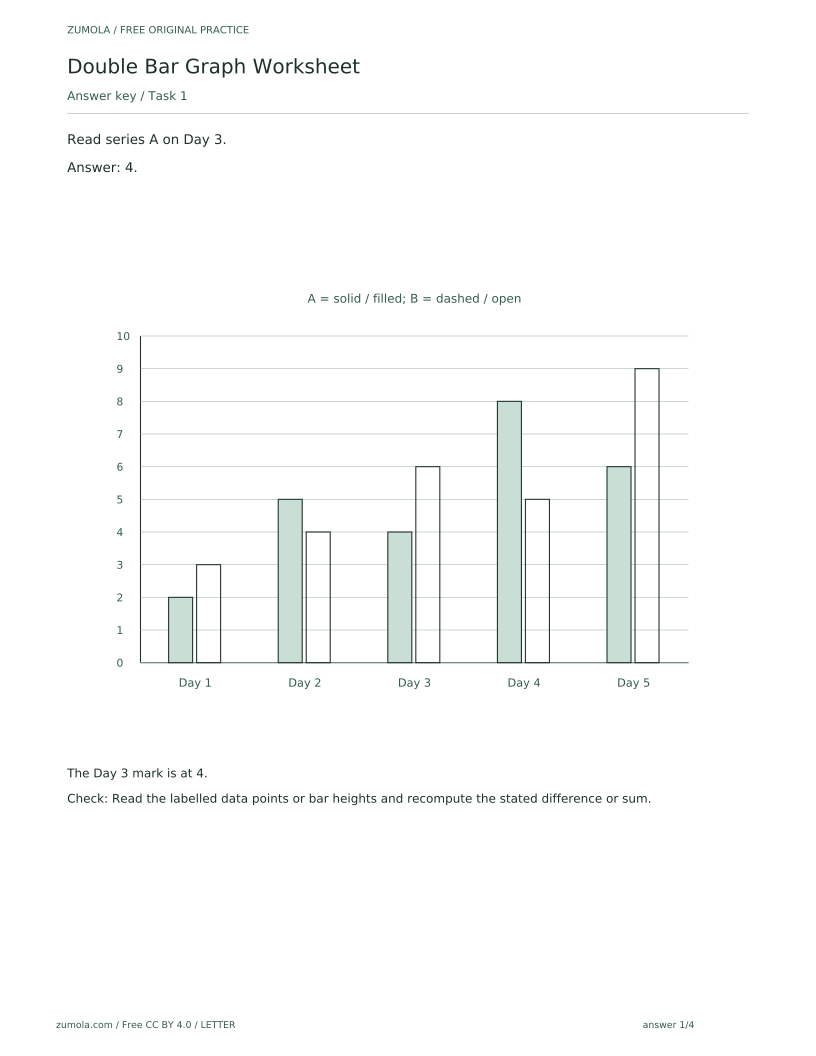
Read series A on Day 3.
Show answer 1
4.
The Day 3 mark is at 4.
Check: Read the labelled data points or bar heights and recompute the stated difference or sum.
Task 2
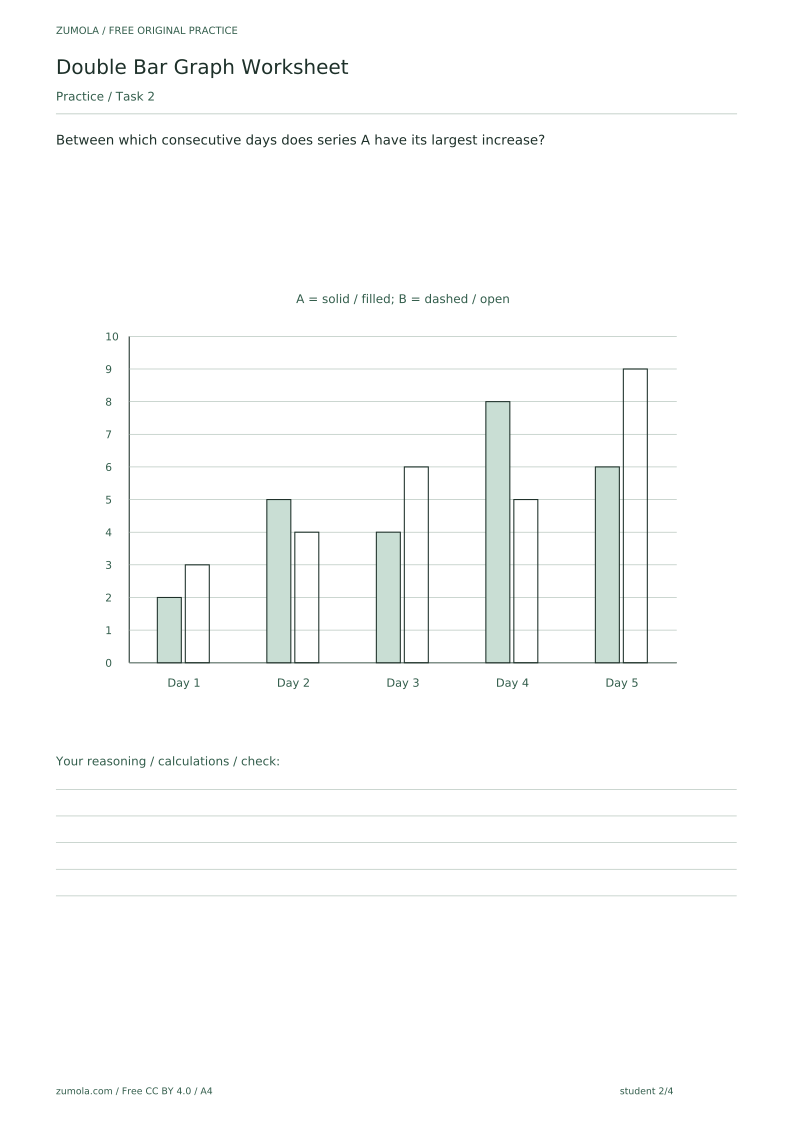
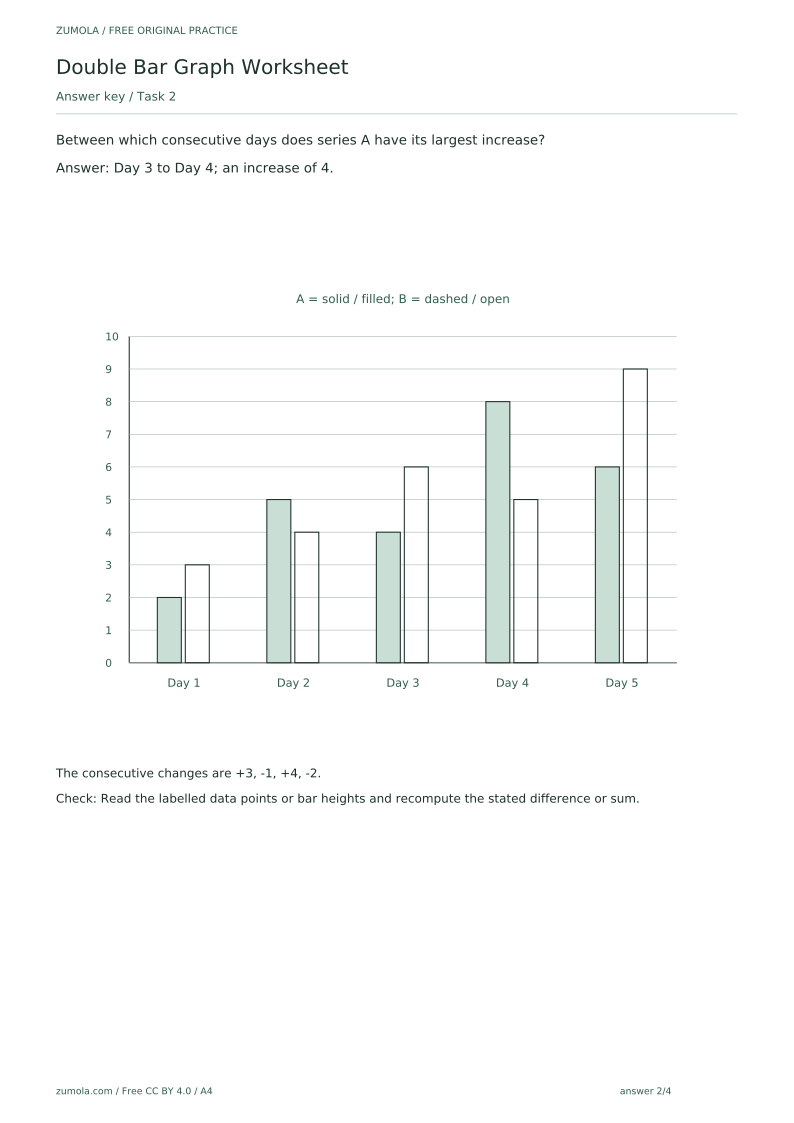
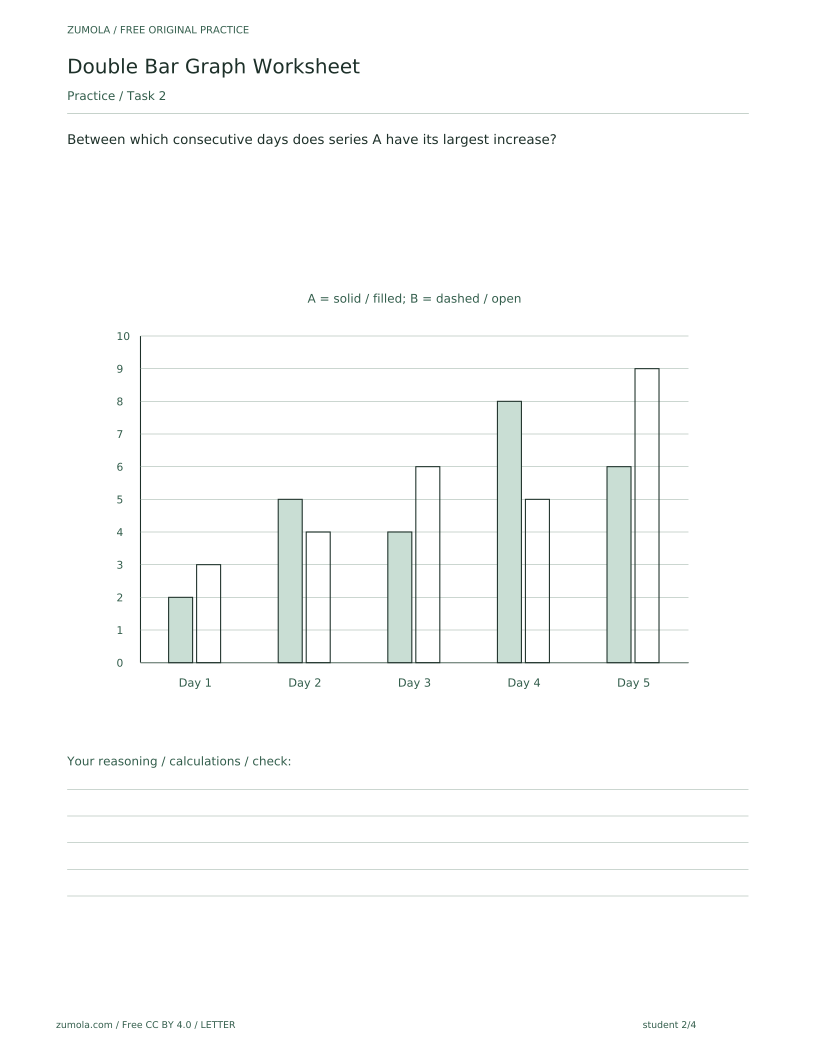
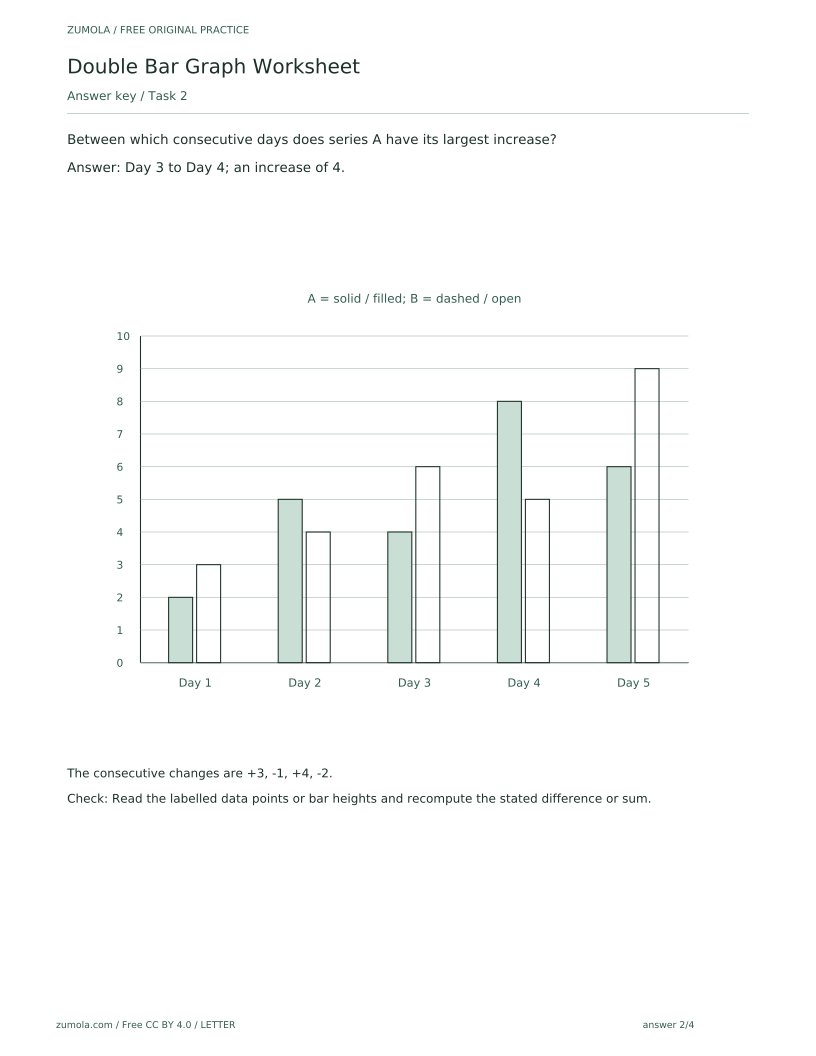
Between which consecutive days does series A have its largest increase?
Show answer 2
Day 3 to Day 4; an increase of 4.
The consecutive changes are +3, -1, +4, -2.
Check: Read the labelled data points or bar heights and recompute the stated difference or sum.
Task 3
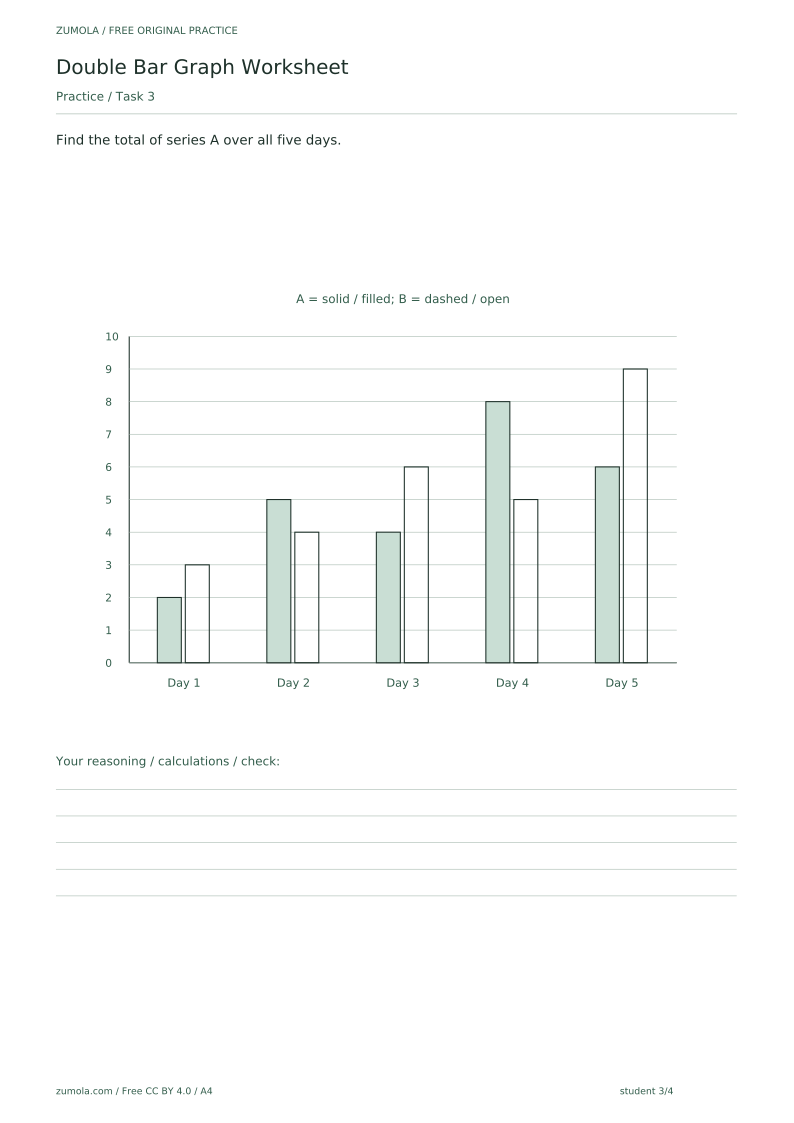
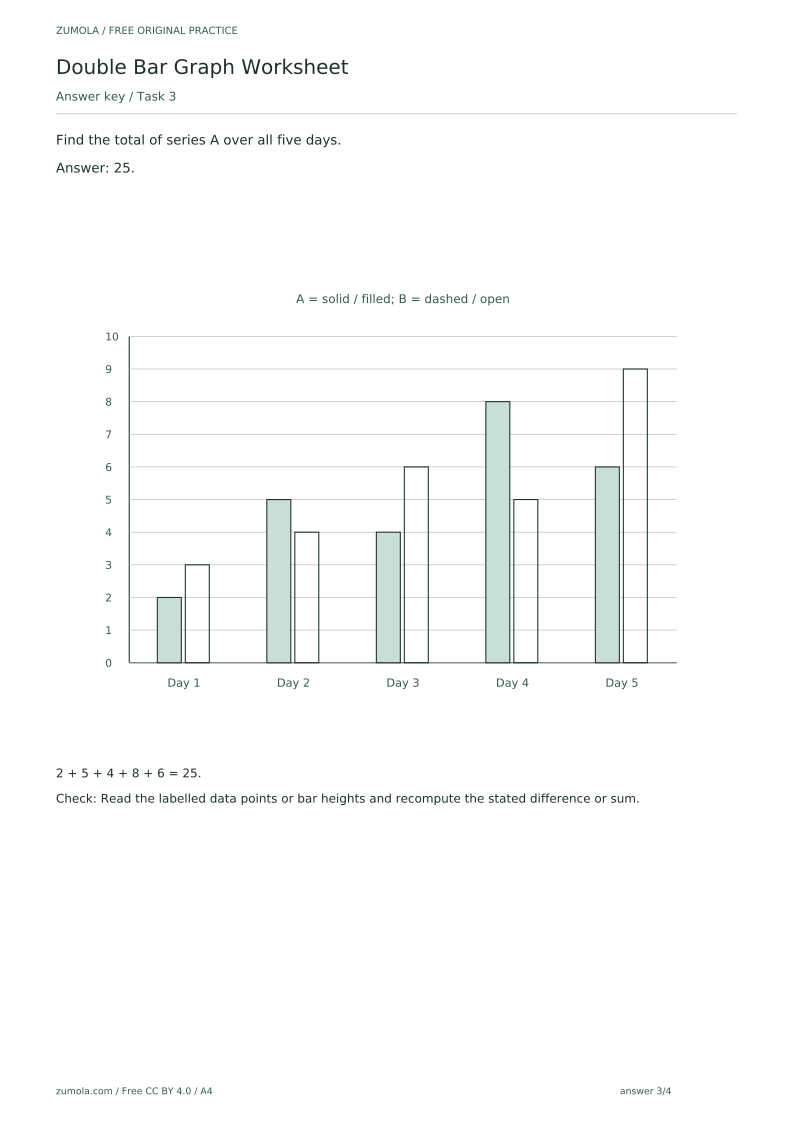
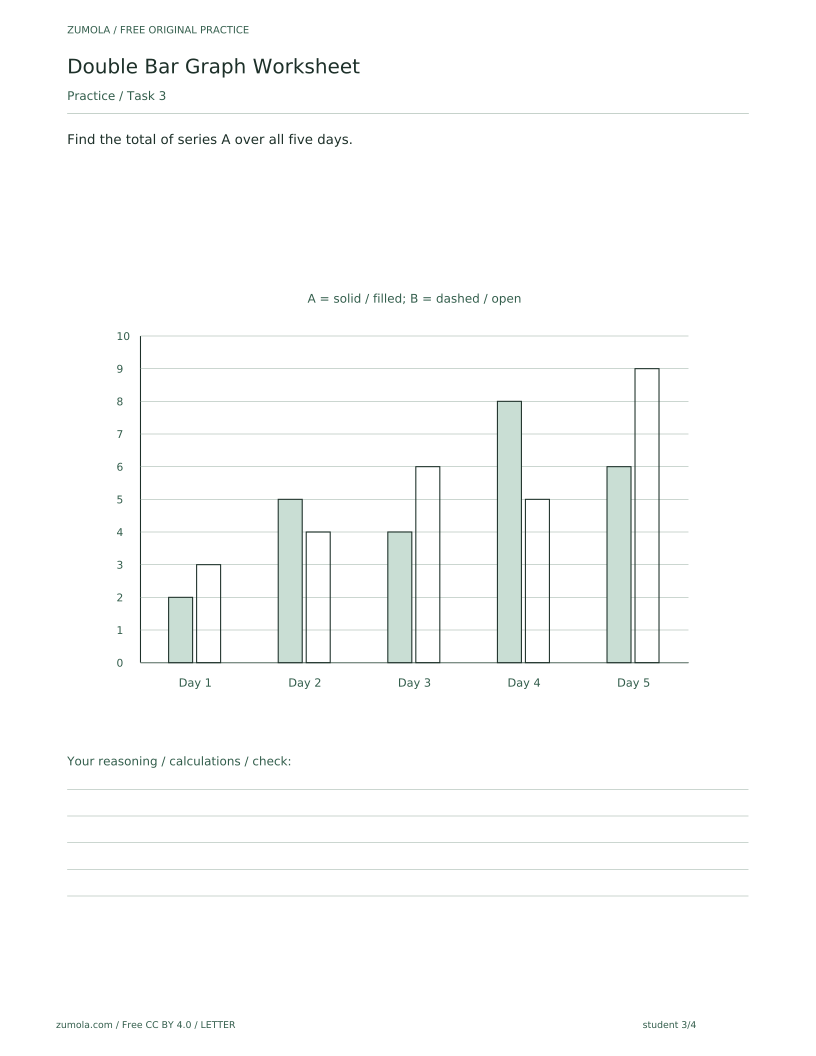
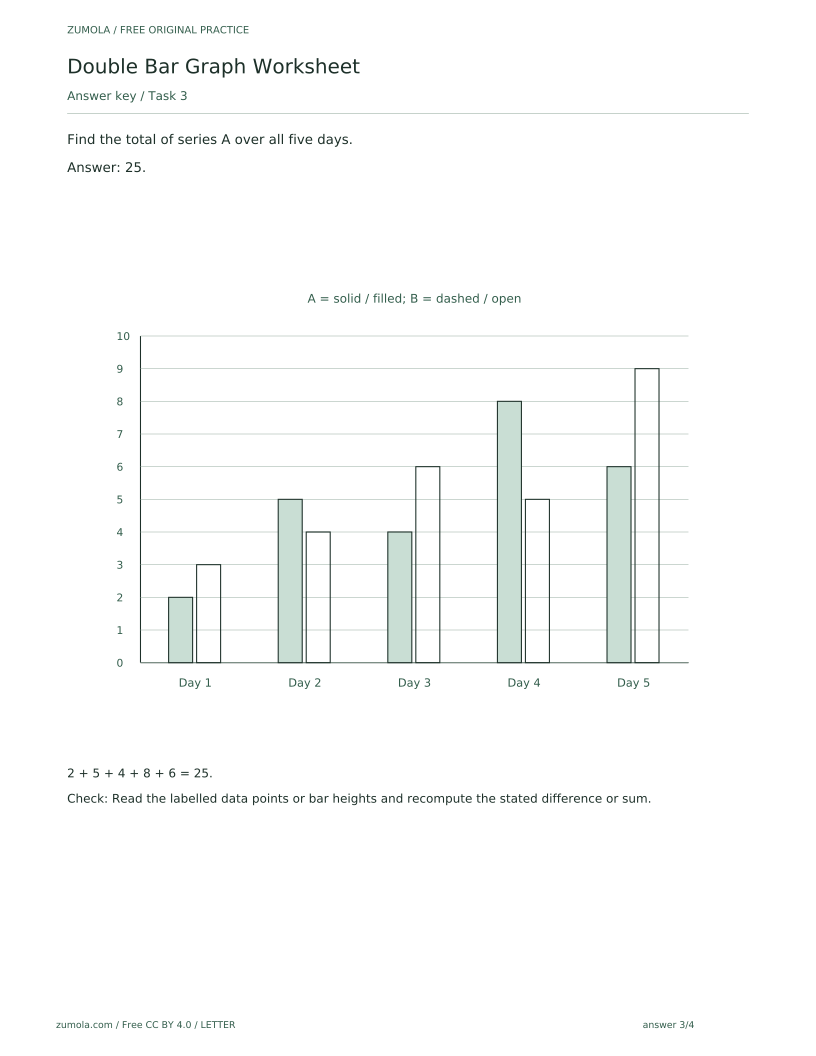
Find the total of series A over all five days.
Show answer 3
25.
2 + 5 + 4 + 8 + 6 = 25.
Check: Read the labelled data points or bar heights and recompute the stated difference or sum.
Task 4
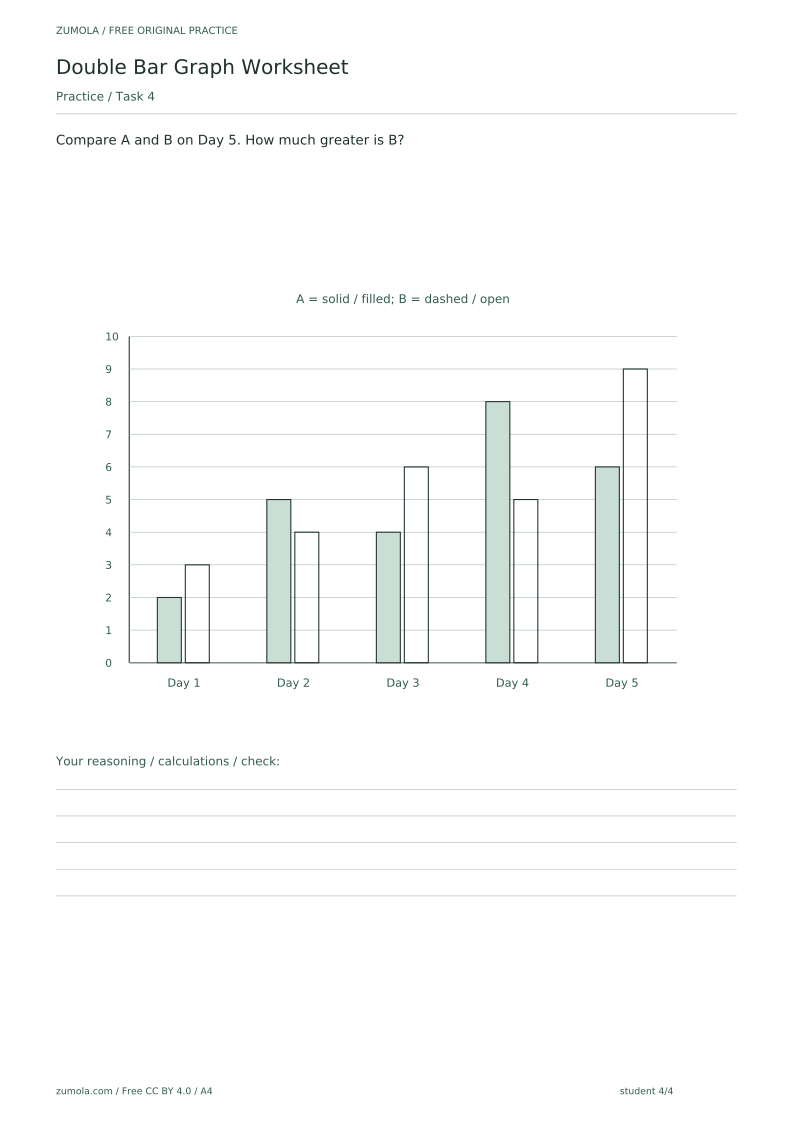
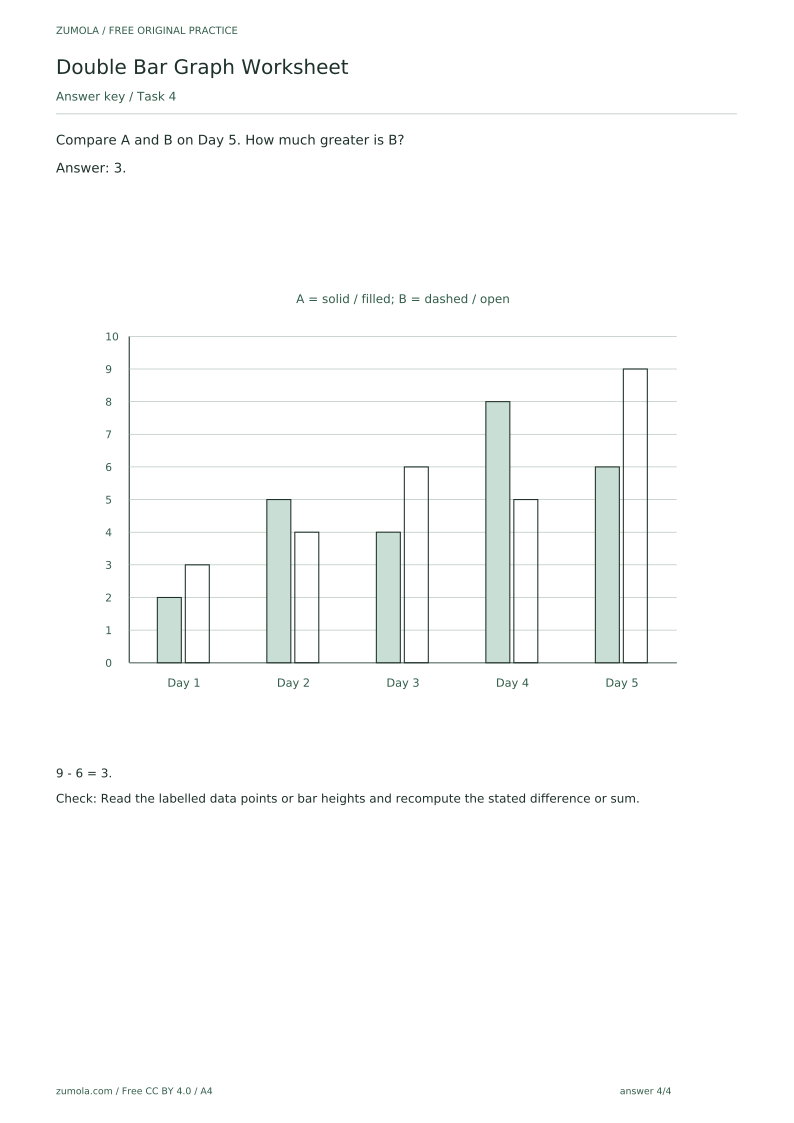
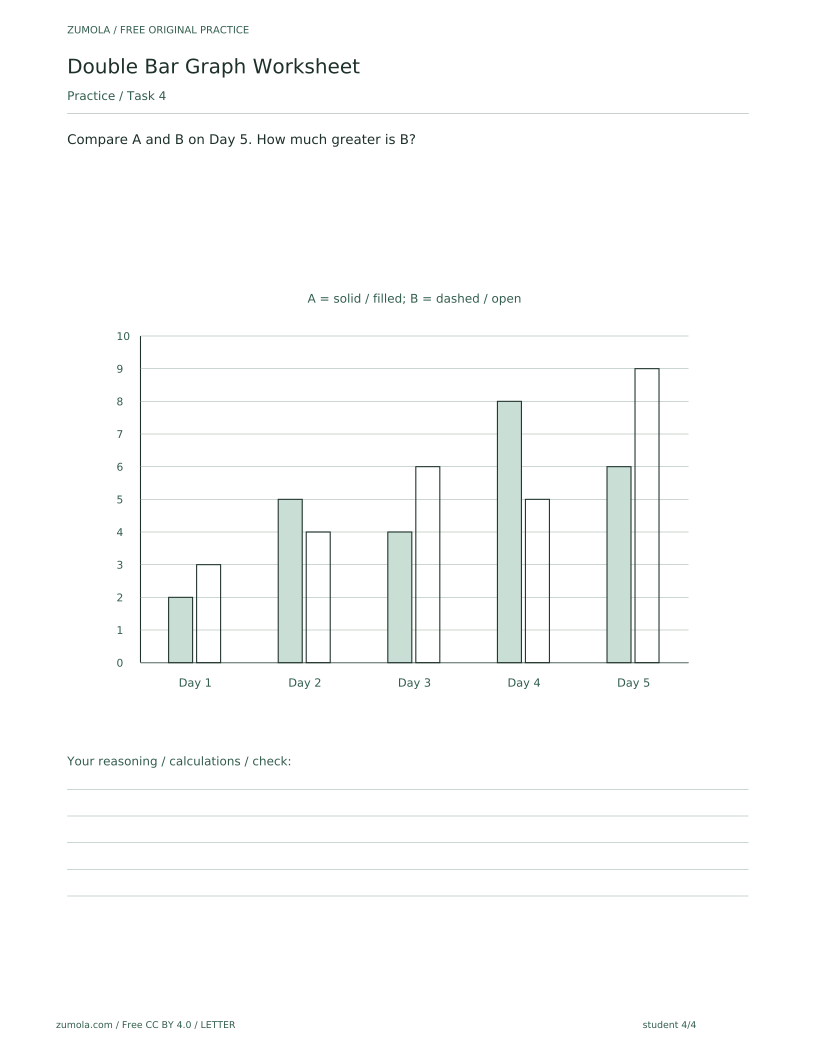
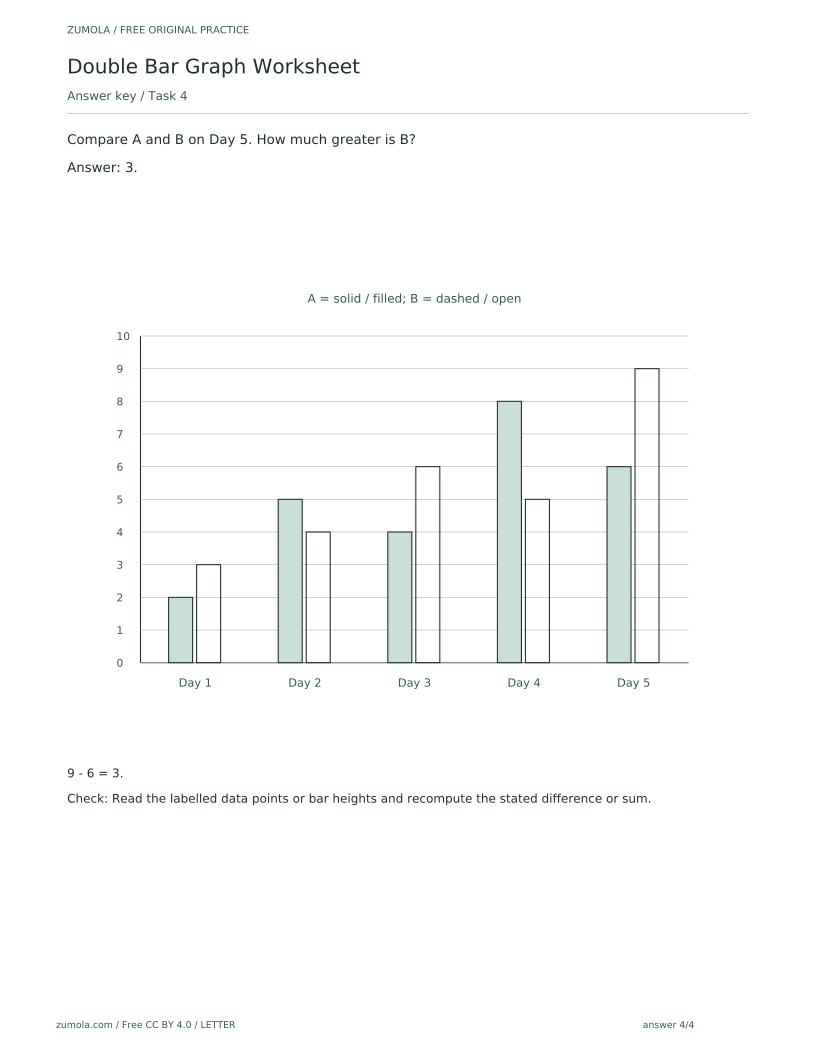
Compare A and B on Day 5. How much greater is B?
Show answer 4
3.
9 - 6 = 3.
Check: Read the labelled data points or bar heights and recompute the stated difference or sum.
Useful checks
- Reading the wrong series: the two bars sit side by side, so confirm which series a question refers to before taking a value.
- Counting intervals instead of reading the labelled points, which can shift a value by one unit on the one-unit scale.
- Treating the invented classroom counts as real statistics; they are fictional examples for practice only.
Questions about this resource
Is the first task already solved?
Yes. The reference PDF solves the first task as a guided example. The student PDF leaves that attempt area blank so learners can try it themselves, and the answer PDF gives the result.
Which paper sizes and files are included?
The free pack includes six PDFs across A4 and US Letter, with separate reference, student and answer versions, plus 18 per-page SVGs.