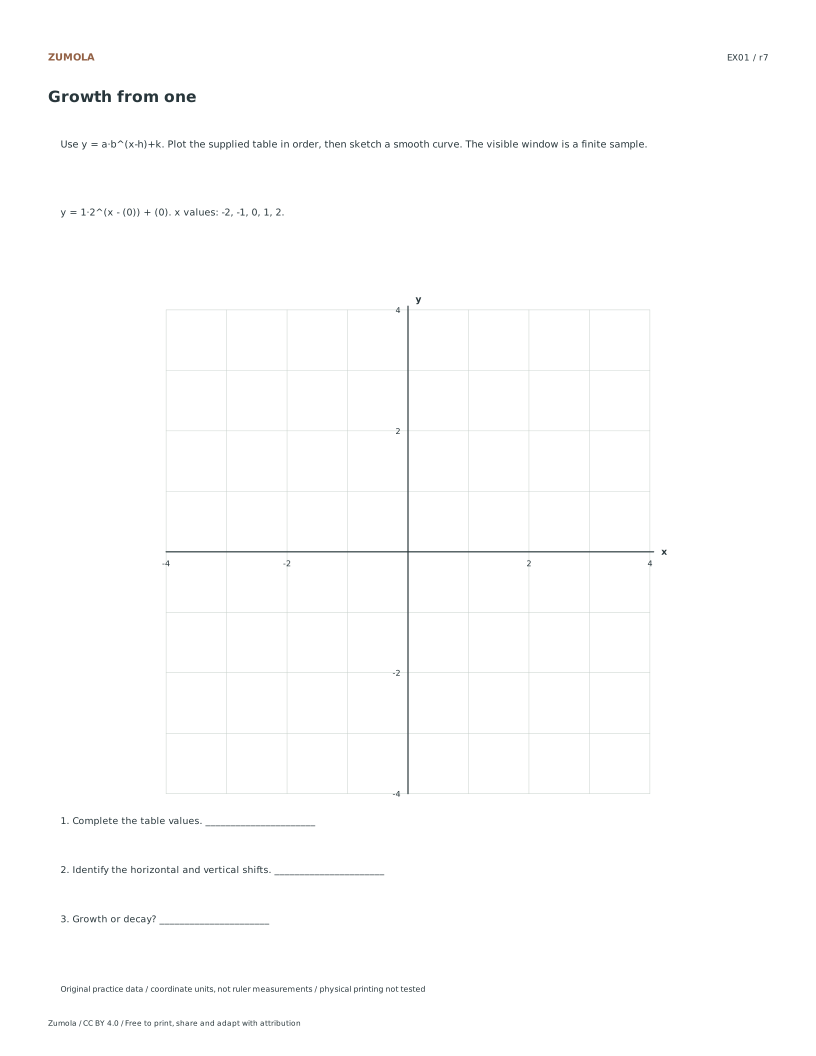
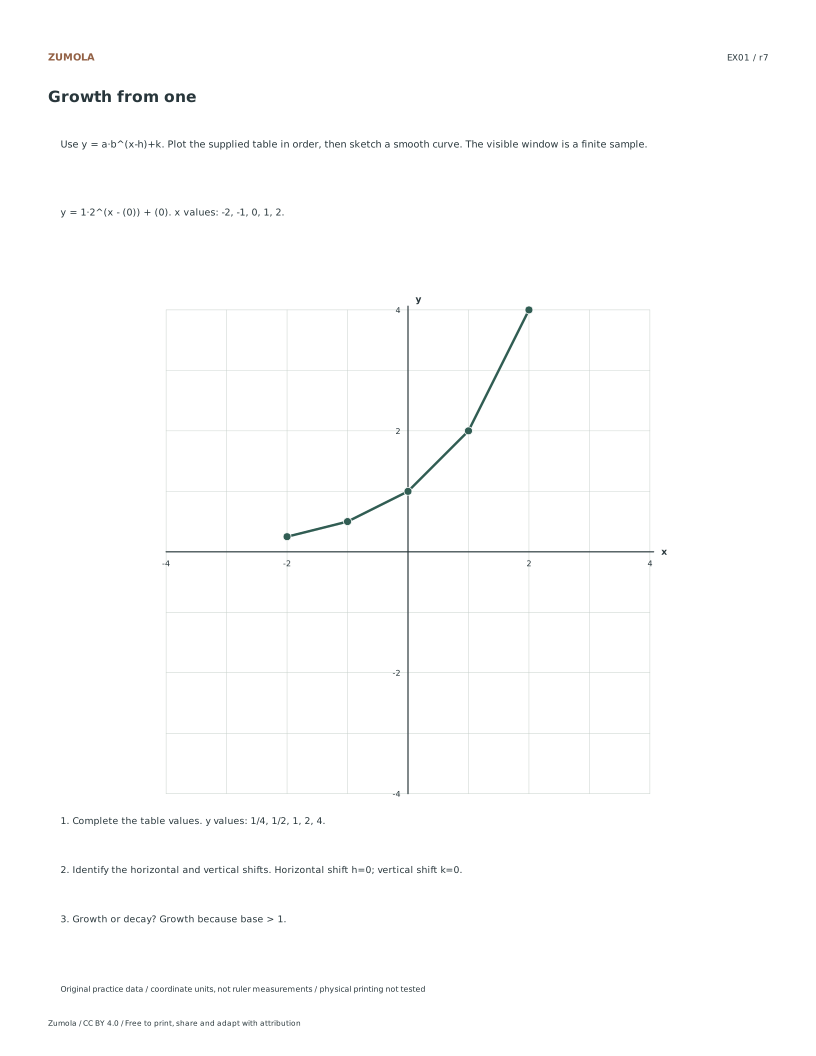
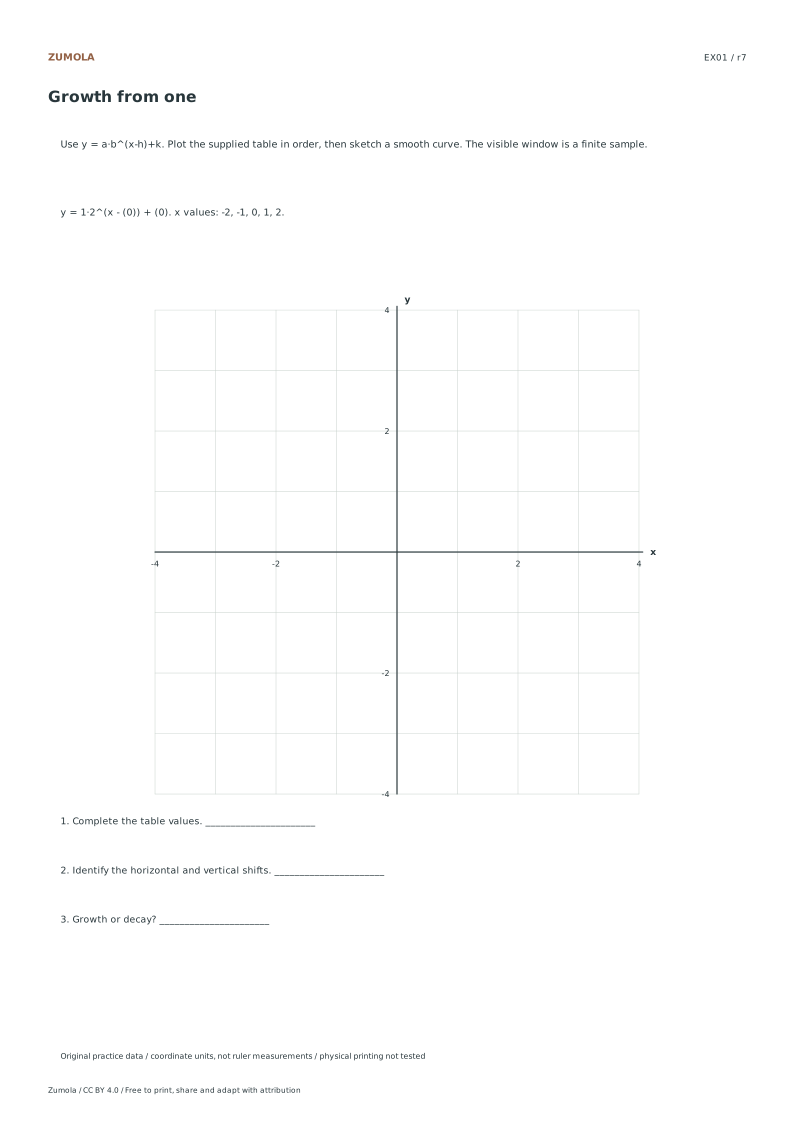
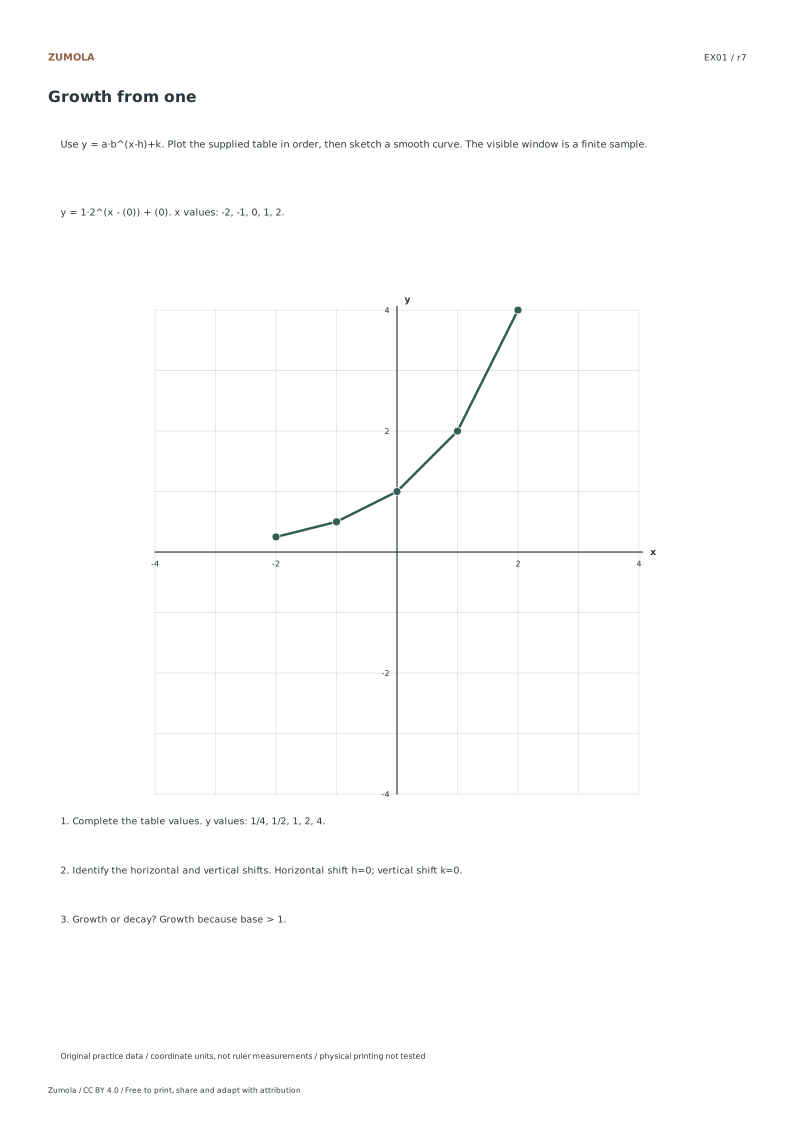
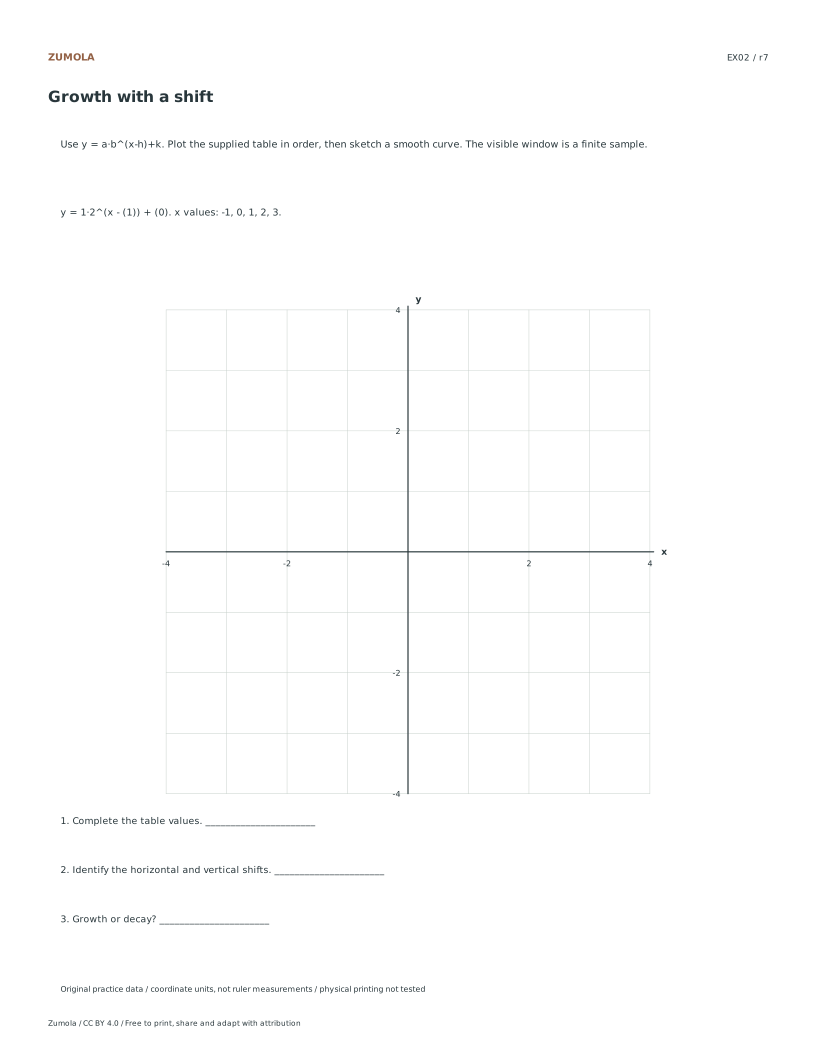
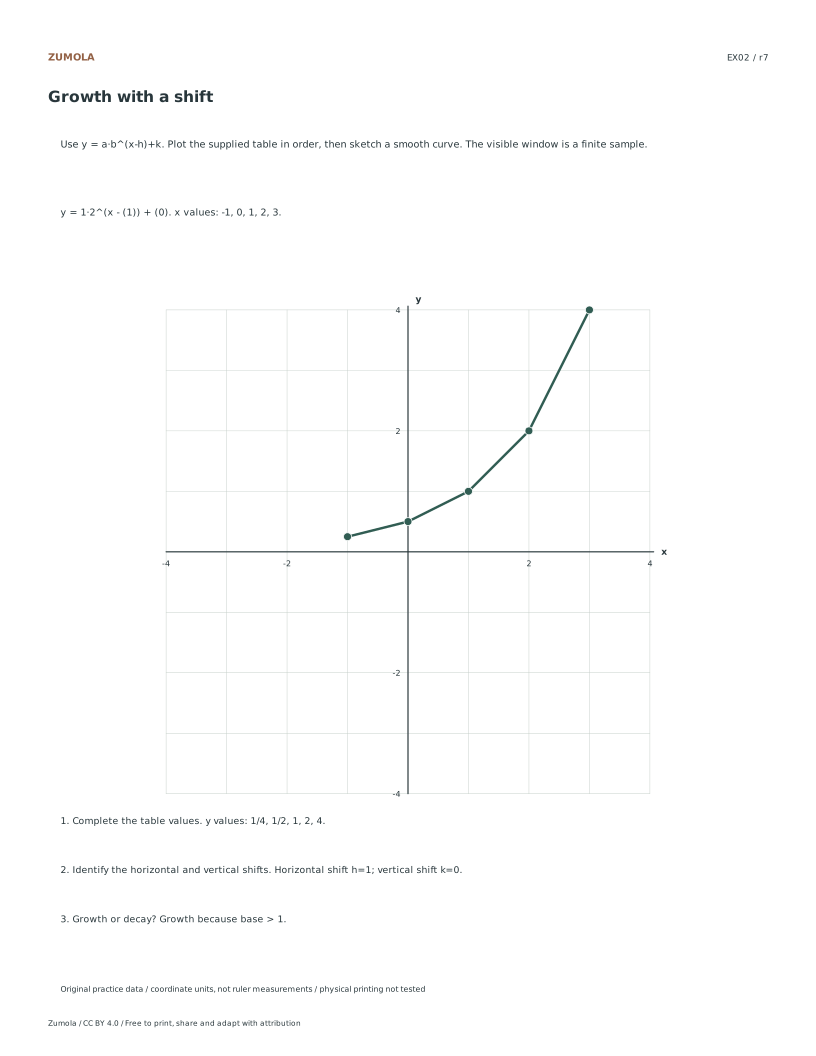
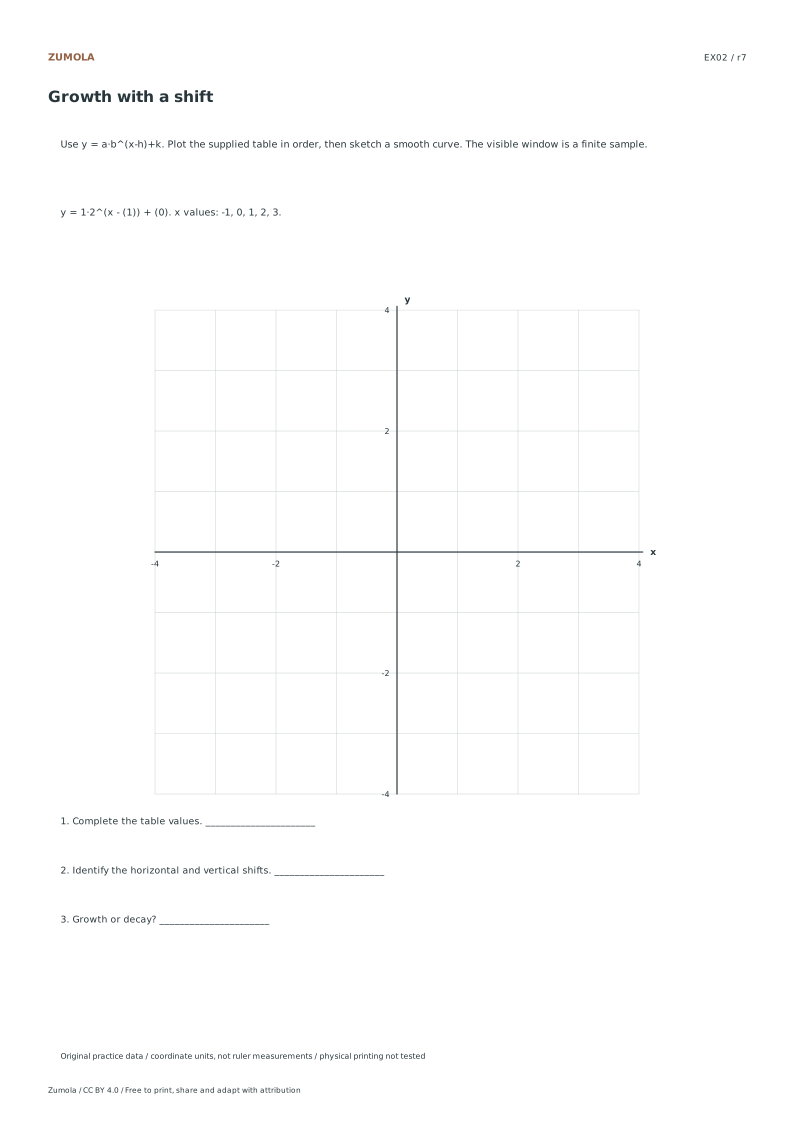
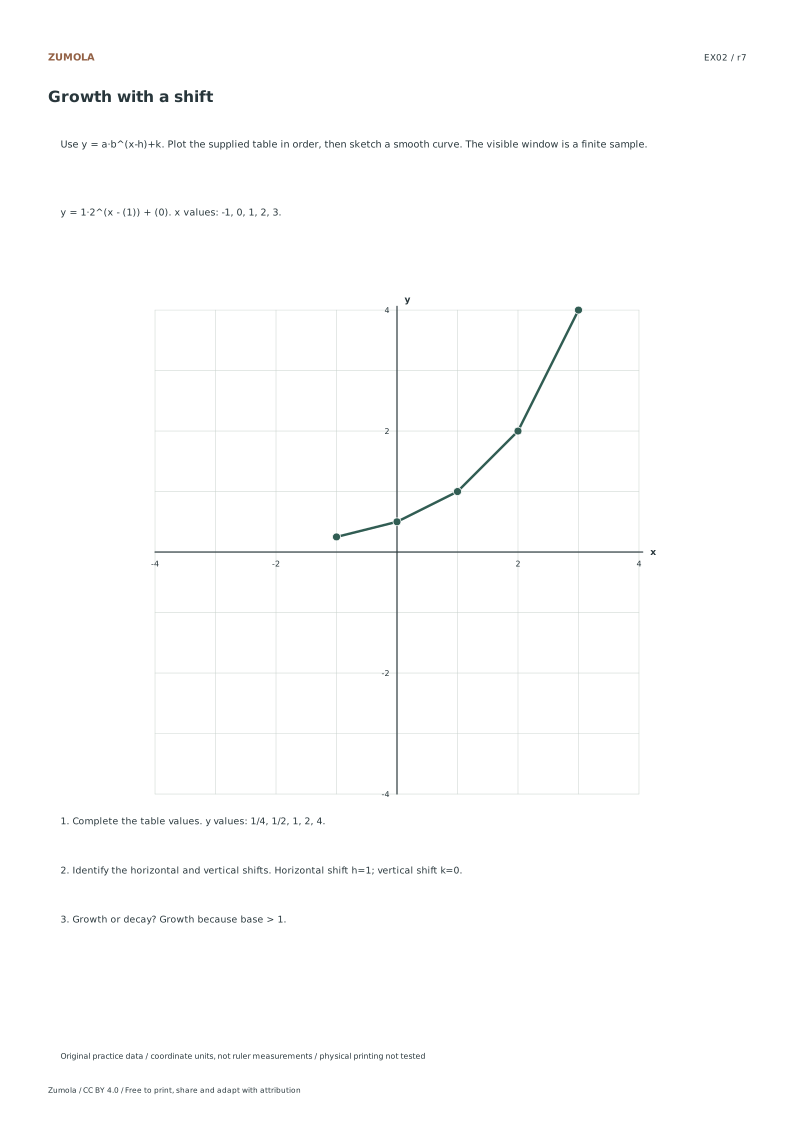
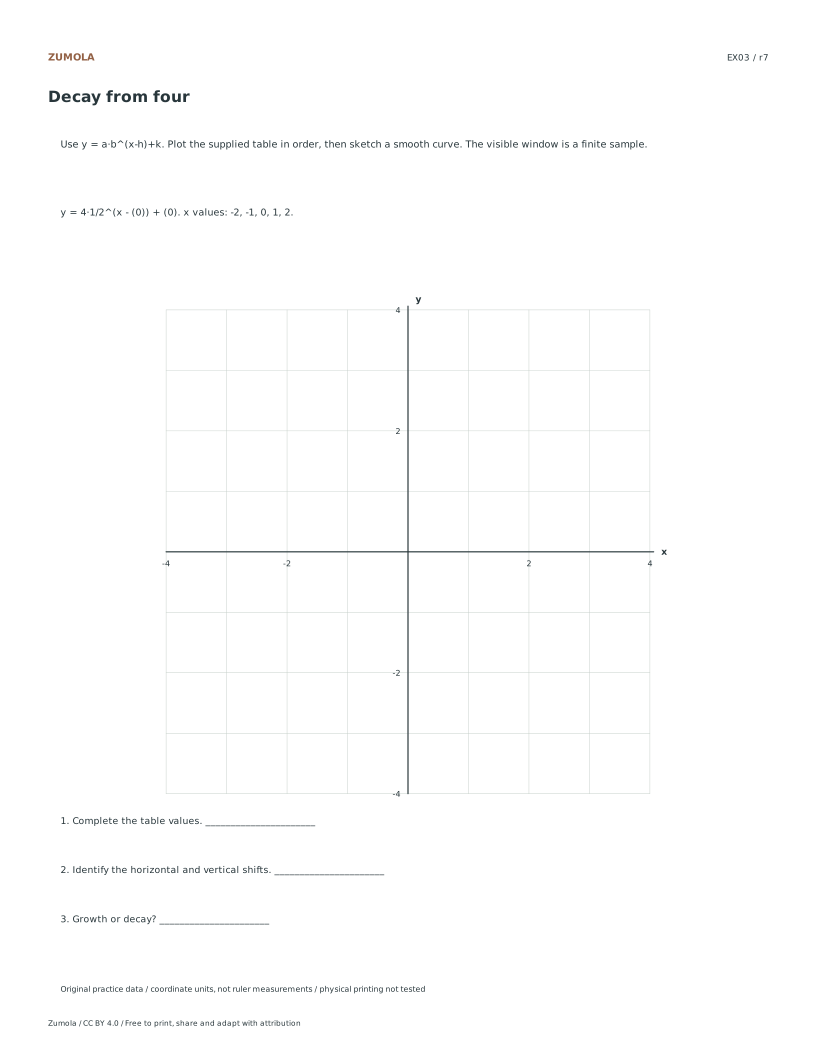
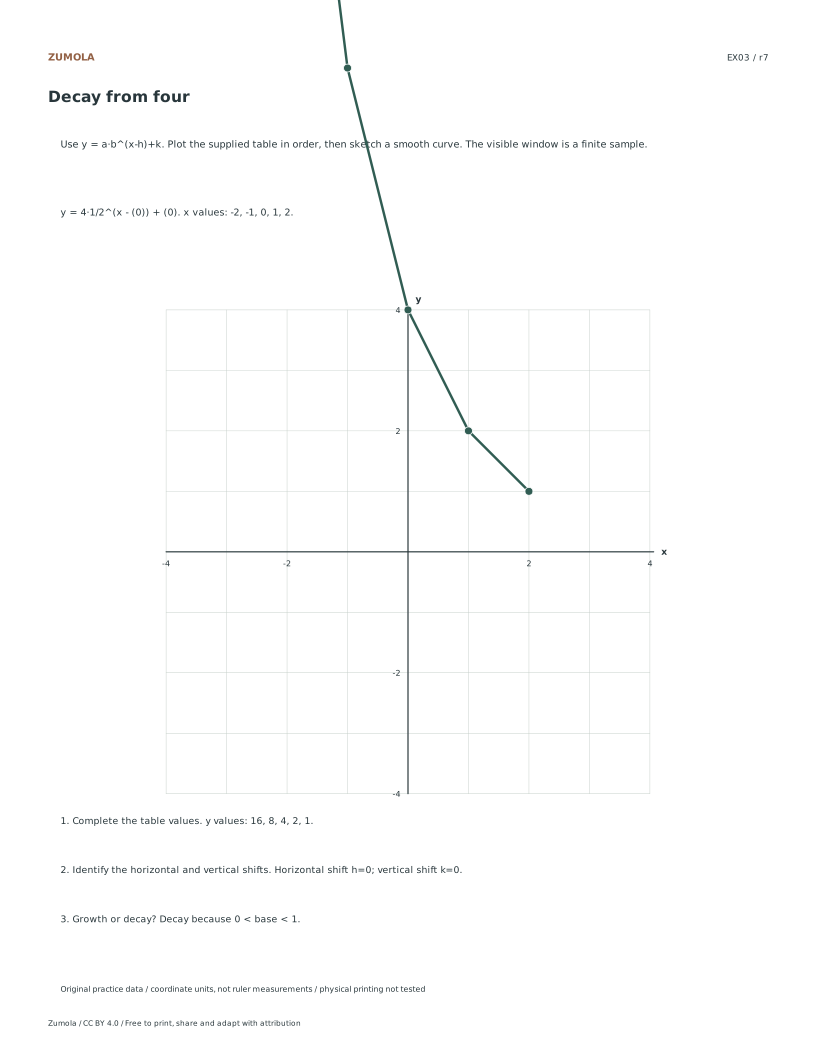
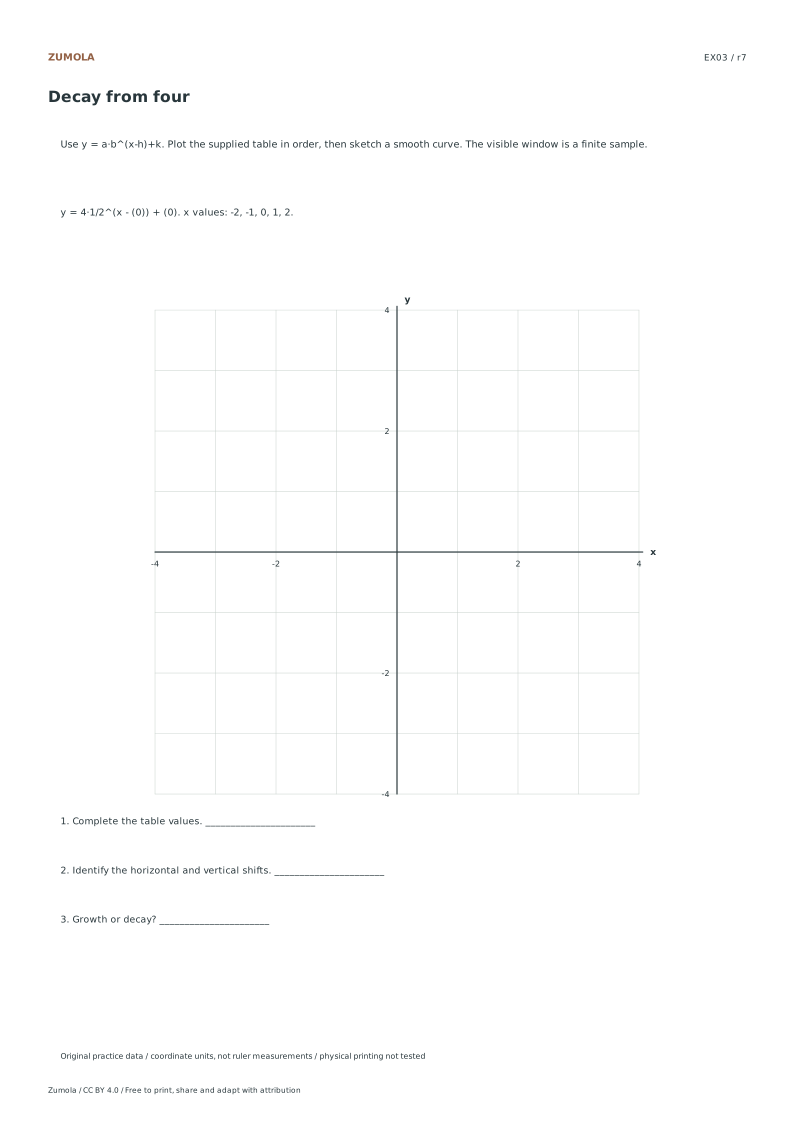
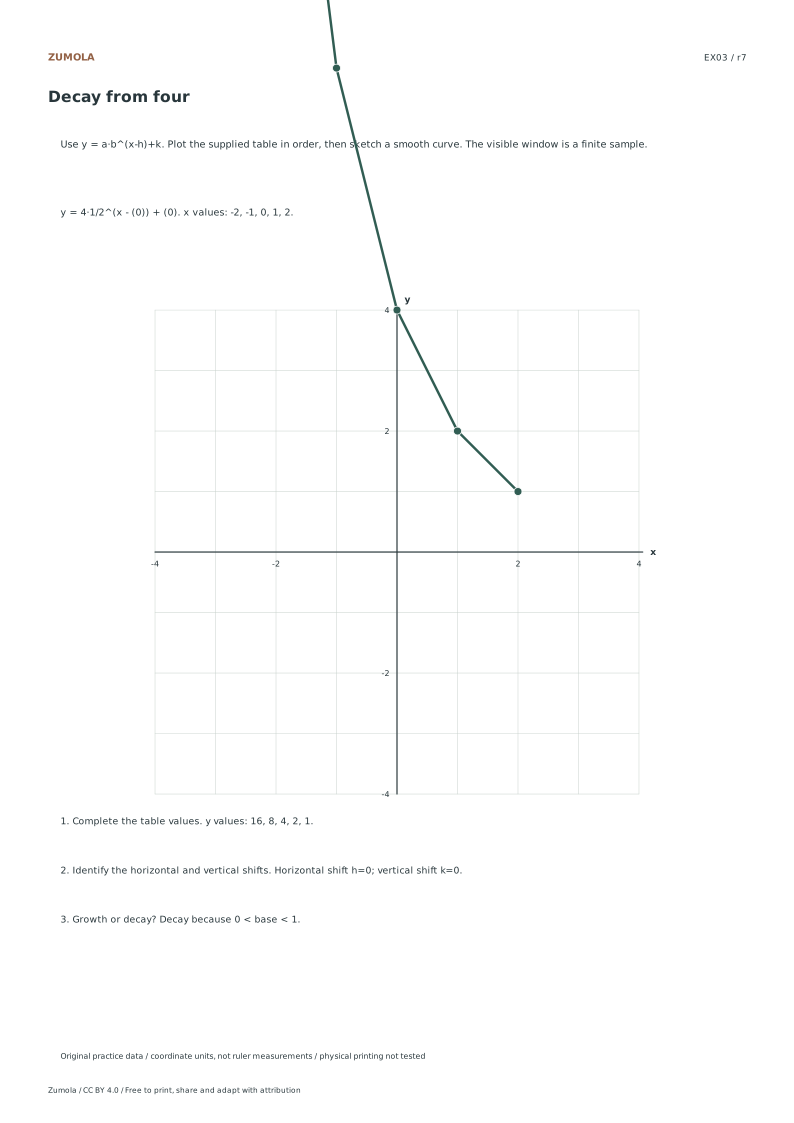
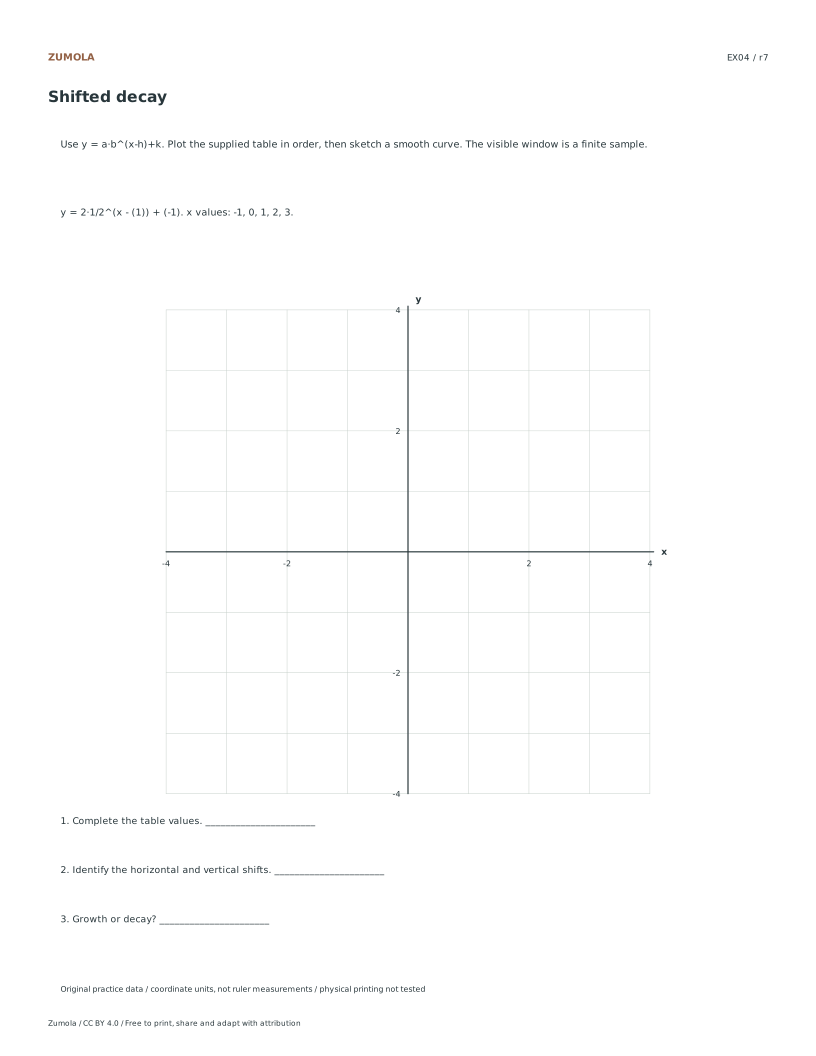
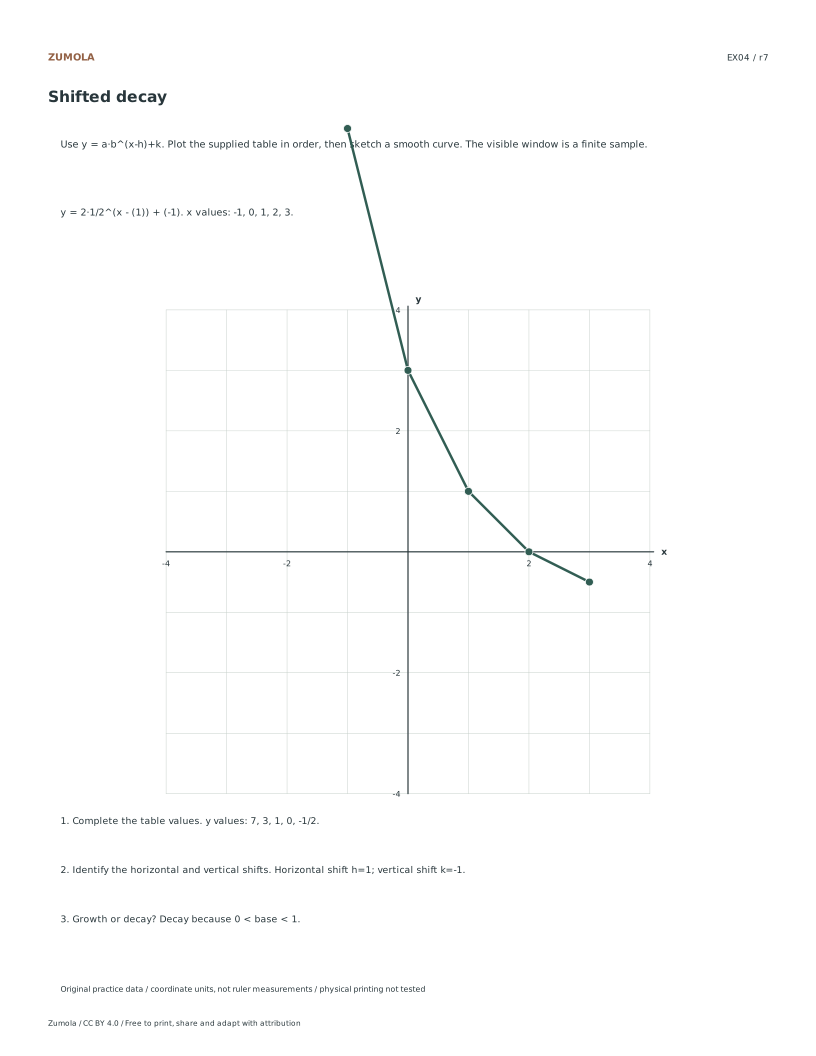
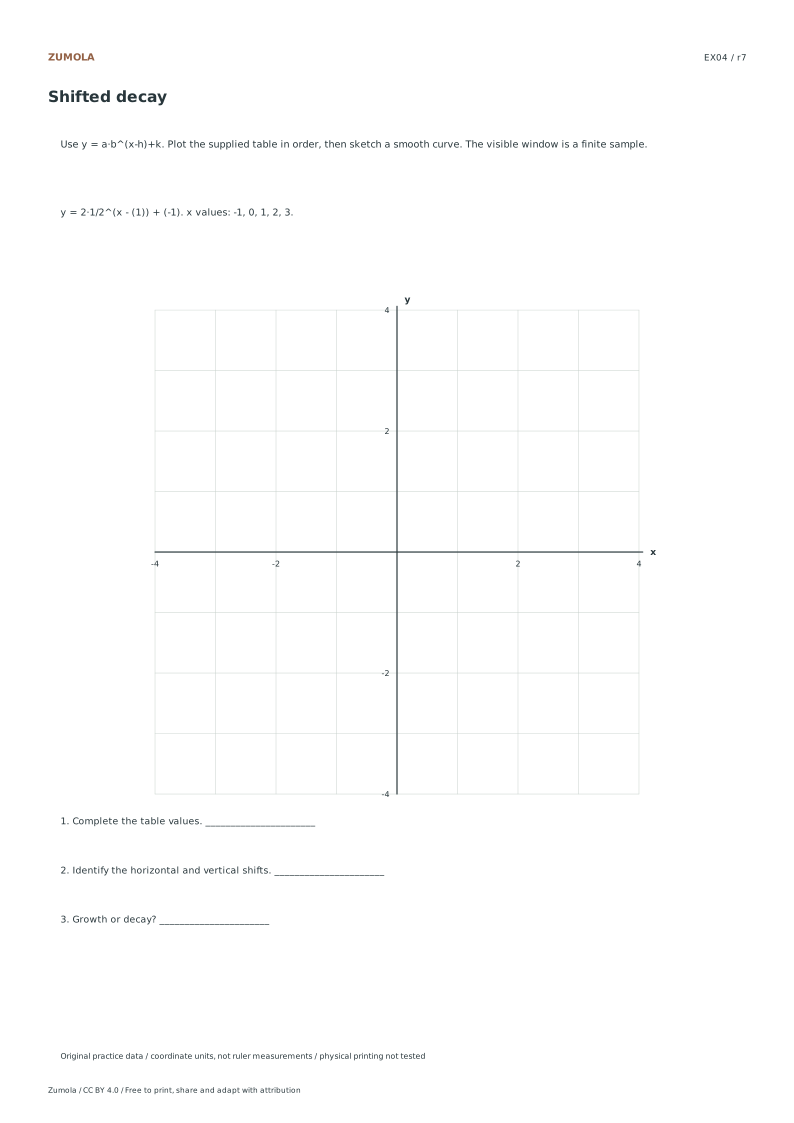
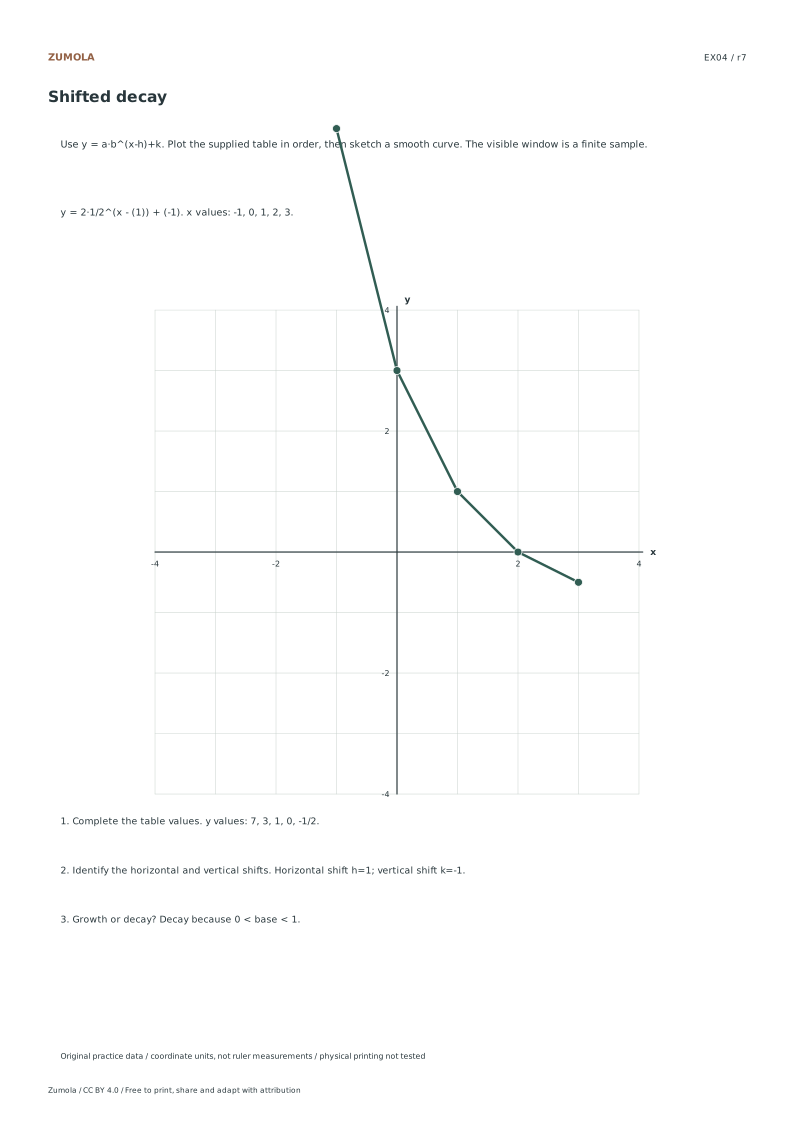
Plot four original exponential functions from y=a·b^(x-h)+k. Compare growth, decay, horizontal shifts and vertical offsets using listed sample points.
Choose Letter or A4, then download a student sheet first. Keep the separate reference or answer file closed until you have attempted the case. Every worksheet, SVG and answer is free without signup.
Choose your paper and download
Download paper size
Every worksheet and answer is free. No signup.
Free original resourceEX01
Growth from one
Original worksheet collection. Letter or A4 PDF and editable SVG.
All examples use original fictional data and coordinate units. They are practice material, not measured classroom results, published questions or evidence about real people.
Check the first case
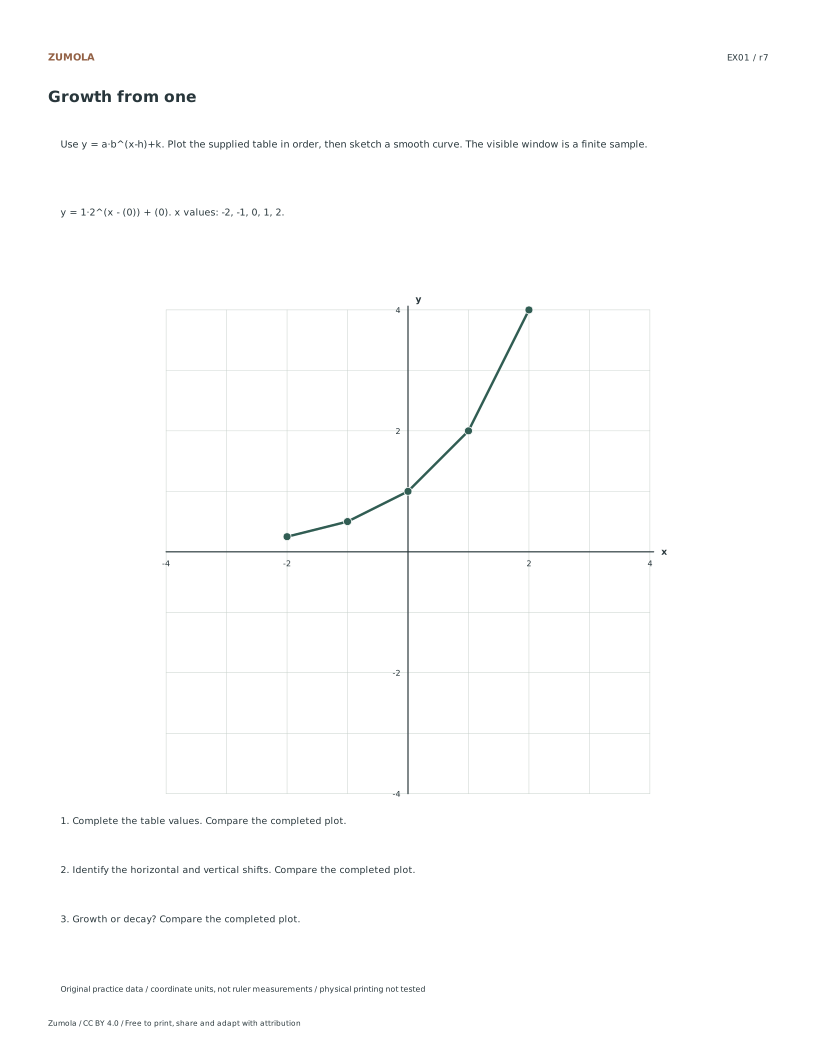
EX01: Growth from one
Check
Worked result
1
y values: 1/4, 1/2, 1, 2, 4.
2
Horizontal shift h=0; vertical shift k=0.
3
Growth because base > 1.
The first case shows the checking pattern. Individual answer files contain the completed graph and result for every case.
Work through the graph
Verifying Table Values
Begin by selecting the reference PDF for the specific exercise case you intend to use. Each case provides a finite window of x values, such as negative two through positive two for the first example. Use the supplied formula y equals a times b raised to the power of x minus h plus k to calculate each corresponding y value manually. For instance, in the first case, substitute x equals zero into the equation with base two to confirm the output is one. This step ensures you understand how the listed coordinates generate the plotted points before distributing the student version. The values are fictional practice material, so focus on the arithmetic consistency rather than real world measurement.
Identifying Growth and Decay
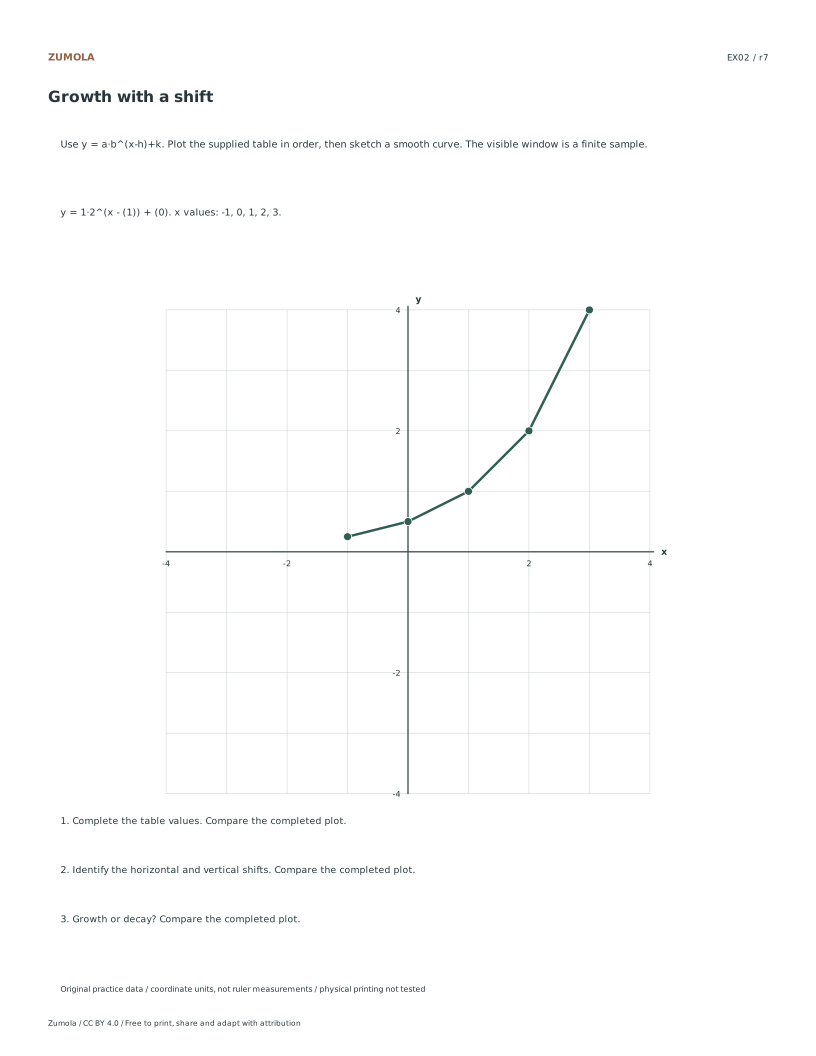
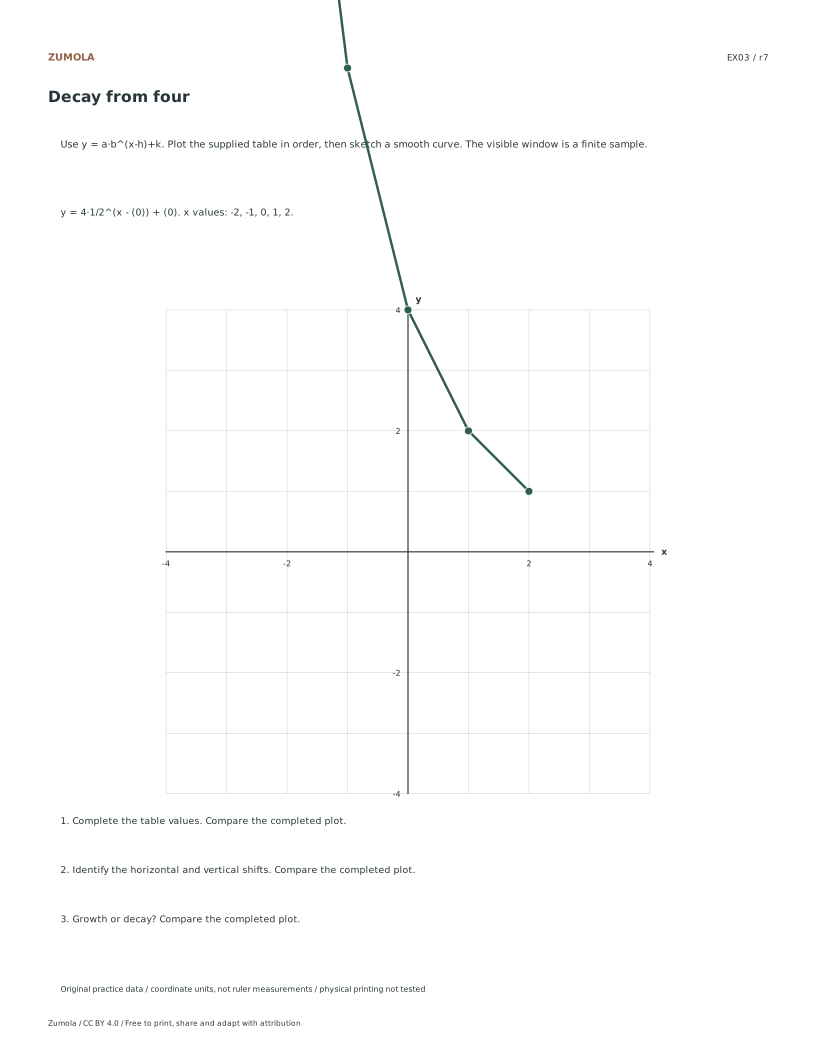
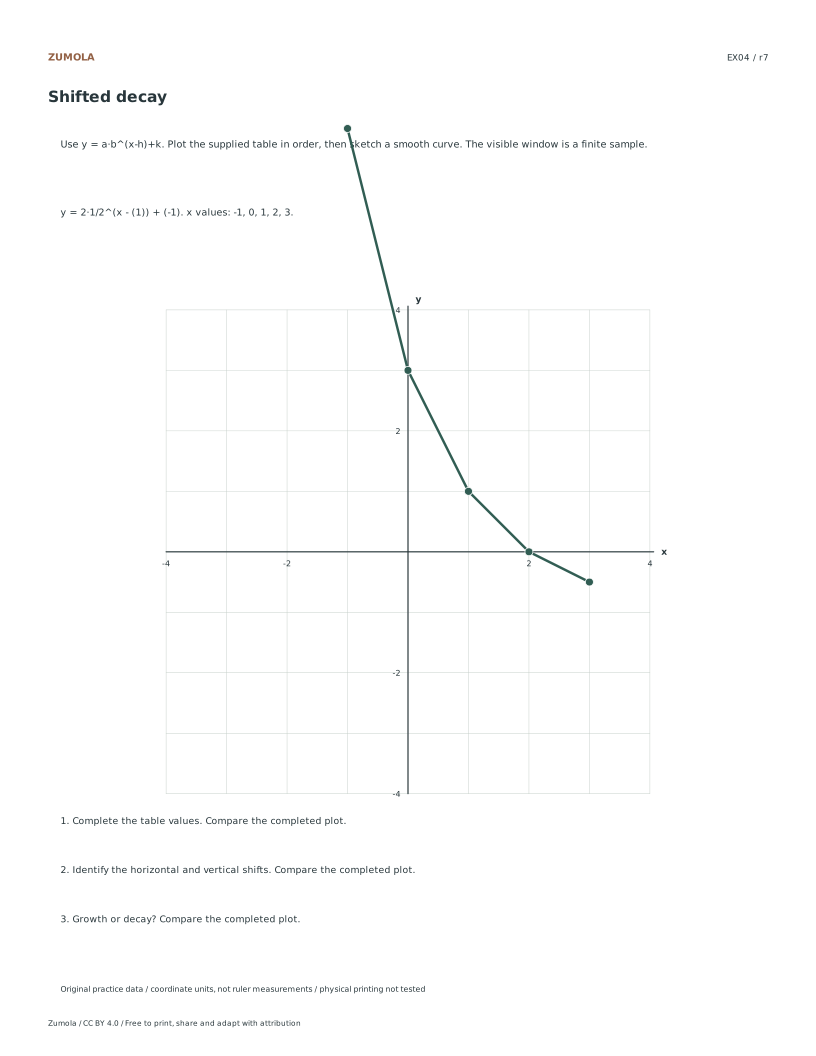
Examine the base value provided in the case definition to determine the function type. If the base is greater than one, such as the base two used in the first two cases, the function represents growth. If the base is between zero and one, like the fraction one half in the third and fourth cases, it represents decay. Check the horizontal shift and vertical offset parameters to see how the graph moves relative to the origin. For example, the fourth case includes a vertical offset of negative one. This classification helps students recognize the structural difference between increasing and decreasing exponential trends within the finite practice window provided in the diagrams.
Utilizing the Answer Key
After students complete the exercises using the student PDF, compare their results against the separate answer PDF. The answer key contains the exact calculated values derived from the listed coordinates and supplied parameters. Since physical printing tests have not been performed, verify that the plotted points align with the calculated table values on your screen before assuming any visual discrepancy is a student error. The answer key confirms the correct application of the horizontal shift and vertical offset. Use this comparison to identify if students are misinterpreting the finite window or incorrectly applying the base exponent rules in their manual calculations.
Checks that catch common errors
Watch for
Check instead
Assuming the plotted points represent an unbounded real world process.
Recognize that the plotted points are a finite practice window generated from specific x values, not a claim about infinite real world behavior.
Confusing the base value for the vertical offset when identifying decay.
Identify decay by checking if the base is between zero and one, such as one half, rather than looking at the vertical offset parameter k.
Expecting physical print quality to match digital precision without verification.
Remember that physical printer checks have not been performed, so rely on the digital coordinates and supplied values for accuracy rather than visual print output.
Keep the labels and margins readable
Choose the PDF that matches your paper. Print at Actual size / 100% and turn off Fit, Shrink and browser headers. SVG is editable but an editor can rescale it; the PDF is the simpler print route. Physical printer, classroom and curriculum tests have not been completed.
Useful answers
How can I tell growth from decay?
A base above 1 produces growth as x increases; a base between 0 and 1 produces decay.
What does h do?
In b^(x-h), h shifts the curve horizontally. Calculate x-h before applying the power.
Does the visible window show the whole function?
No. It is a finite practice window for the supplied sample points.
Are the answer files and editable graphs free?
Yes. The individual student, reference and answer files plus collection packs are free without signup. Credit Zumola under CC BY 4.0 when sharing or adapting.
Further reading: OpenStax: exponential graphs. The diagrams, datasets and exercises here are original Zumola work.
Your analytics choice
Optional Google Analytics helps us understand which free resources are useful. It is off until you allow it. Drawing tools and downloads work with either choice. Privacy details