Free original lessons
Line Graph Interpretation Worksheet
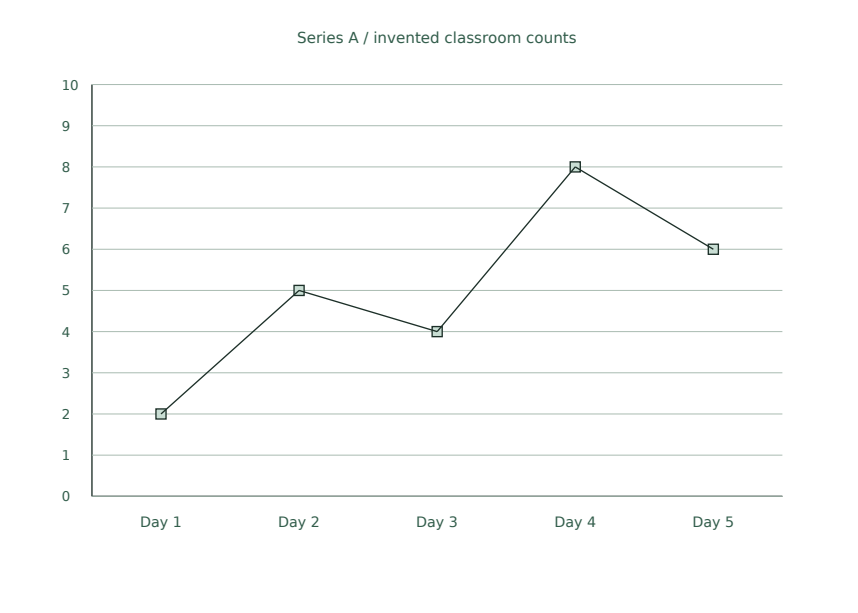
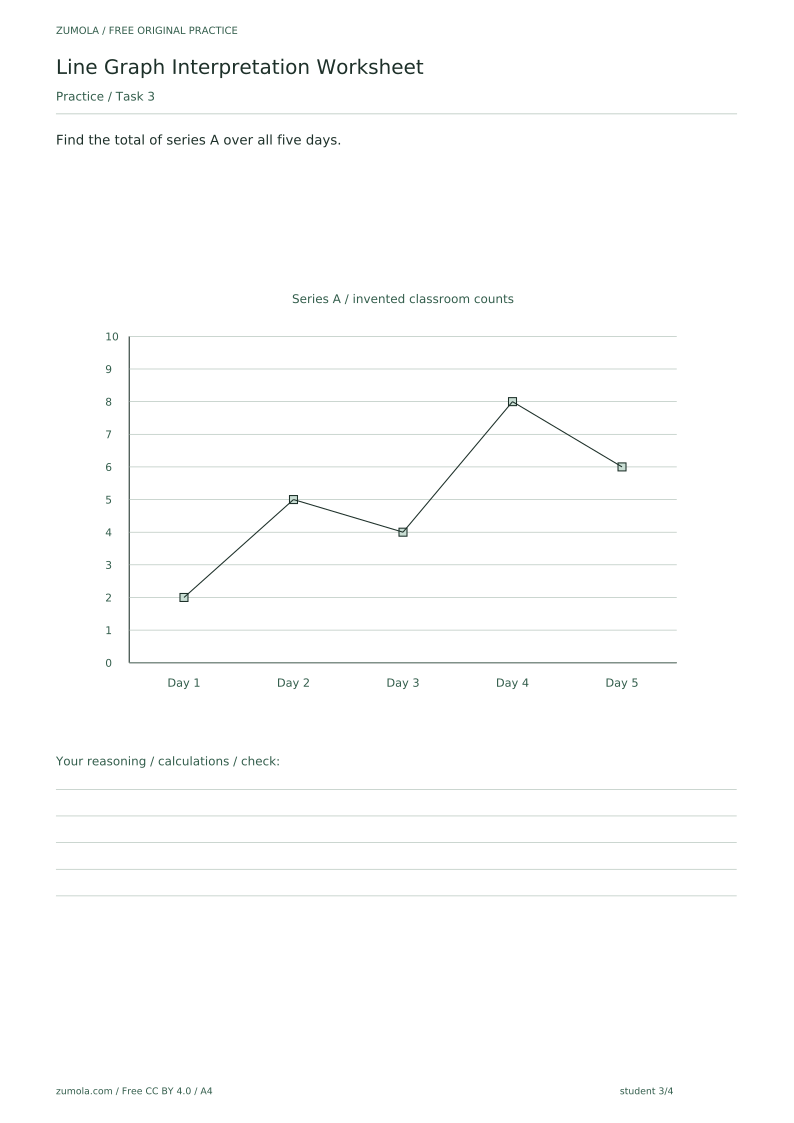
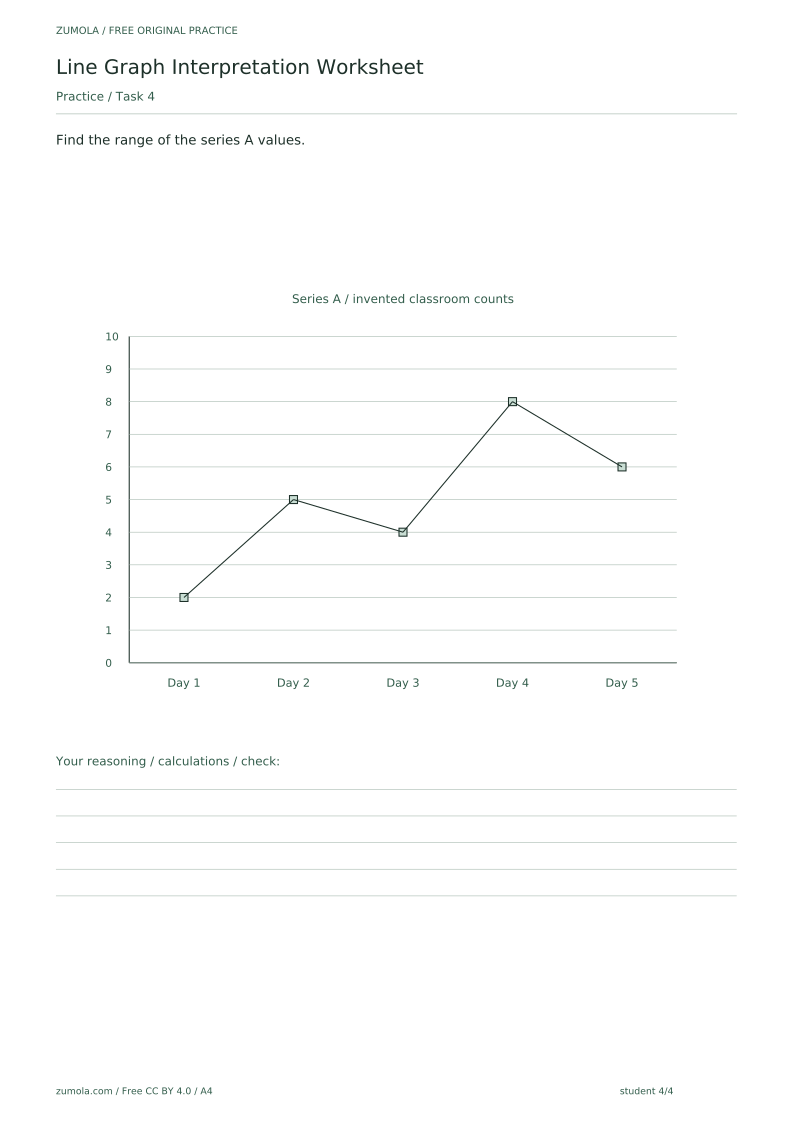
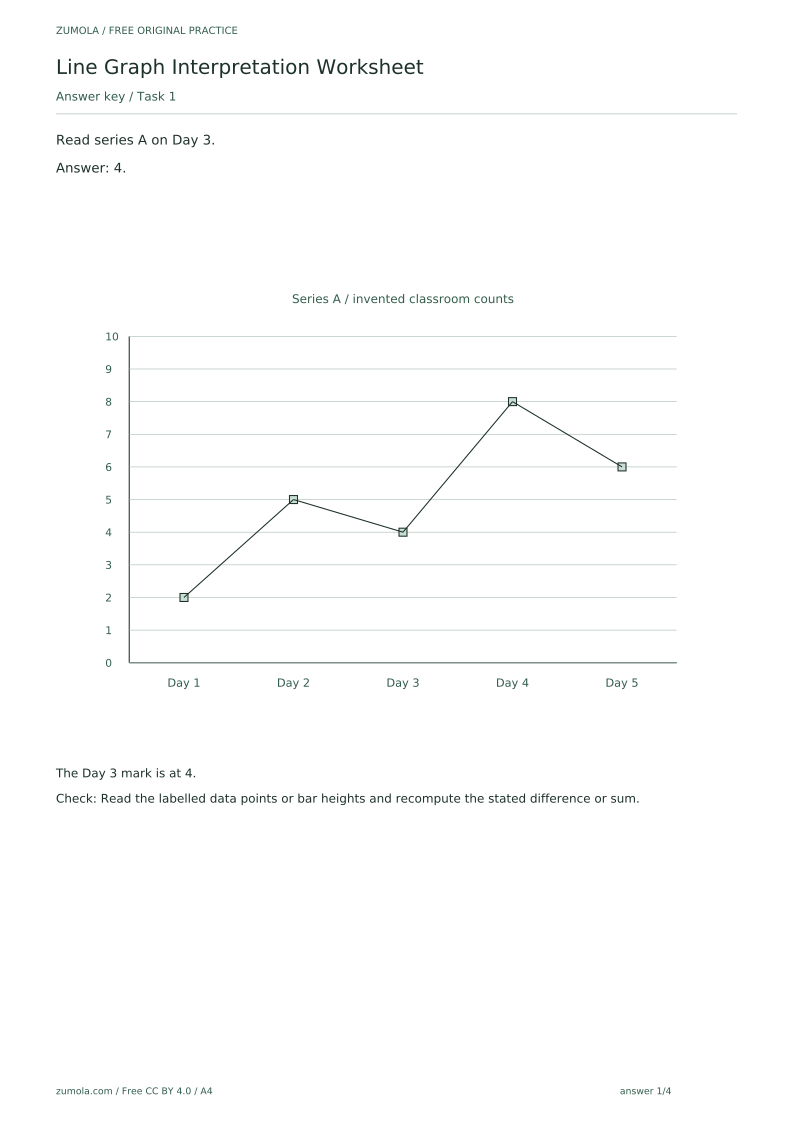
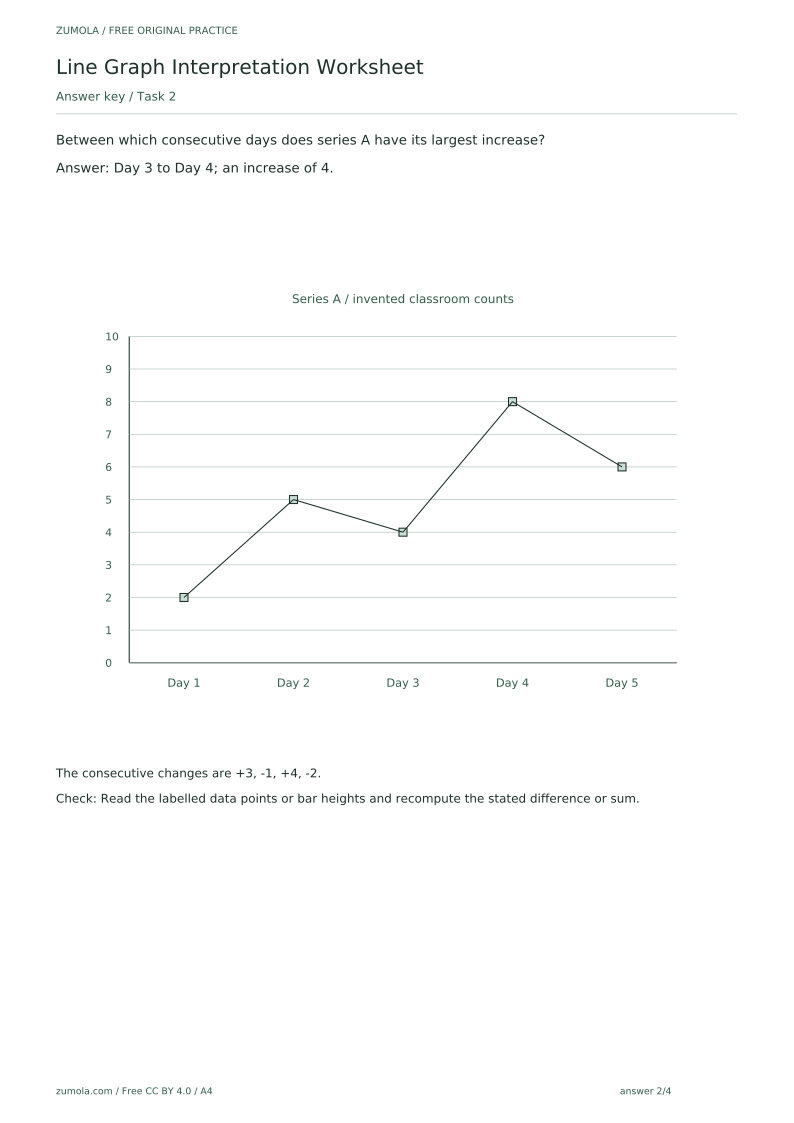
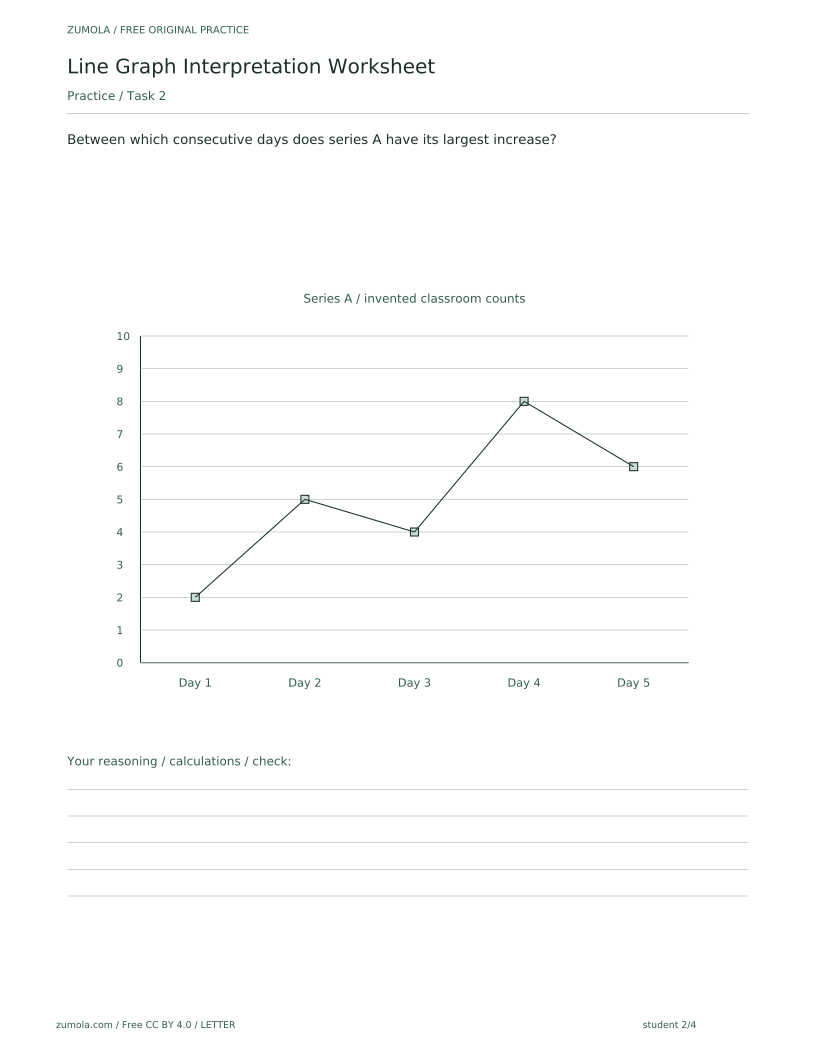
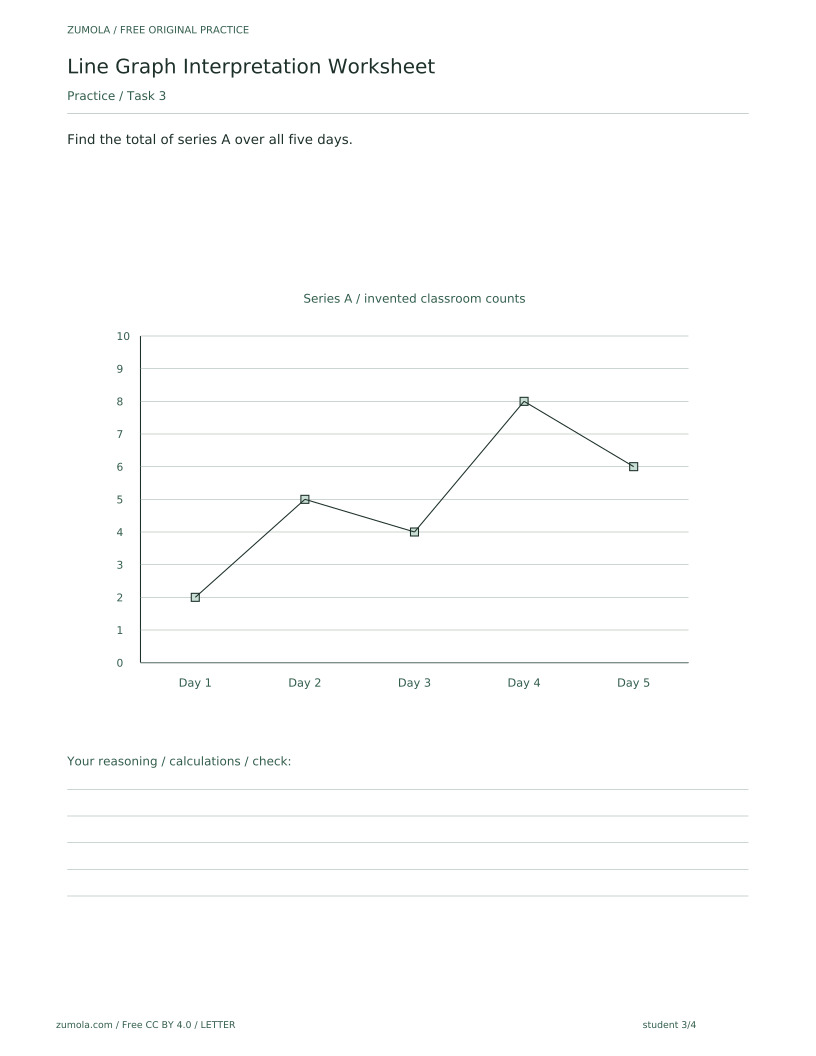
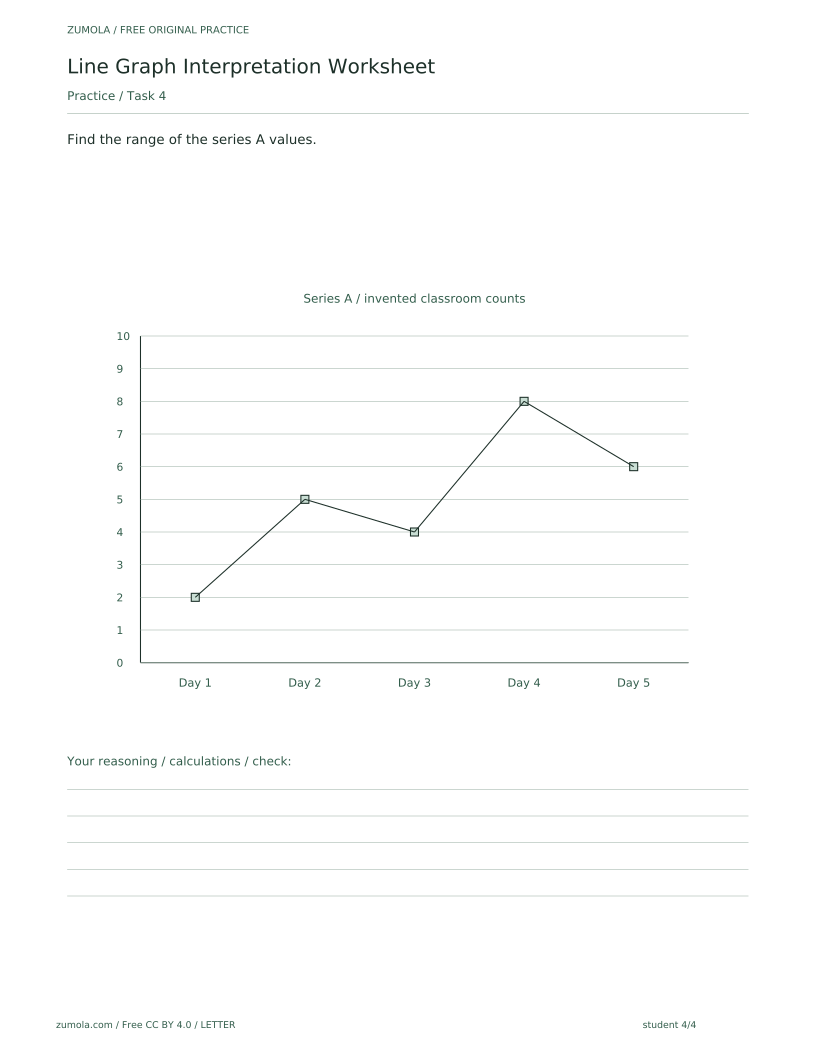
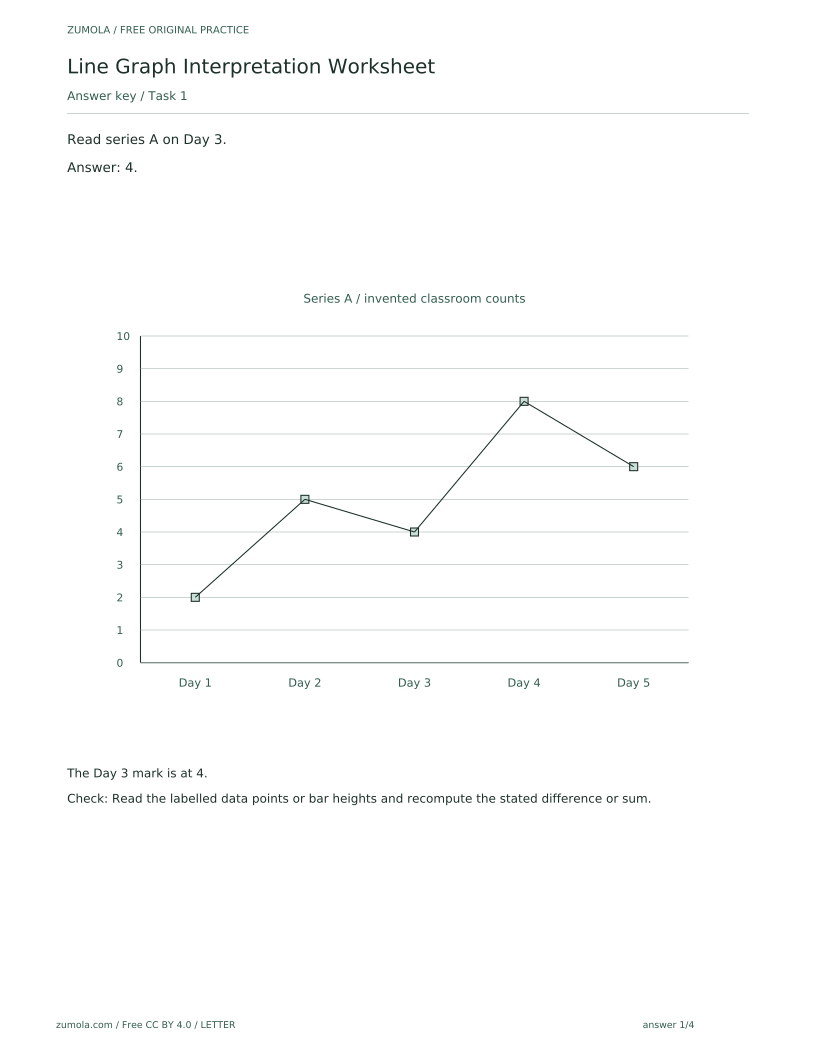
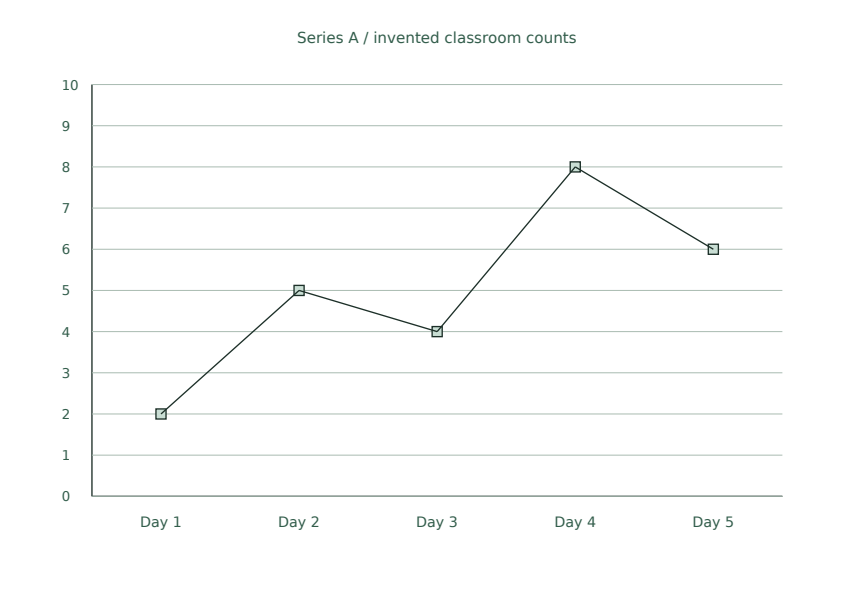
This free printable worksheet gives students straightforward practice in reading a line graph. The graph shows invented classroom counts across Days 1–5, with one-unit intervals on the vertical axis, so every point can be read directly from the labelled marks.
Letter & A4
PDF & SVG
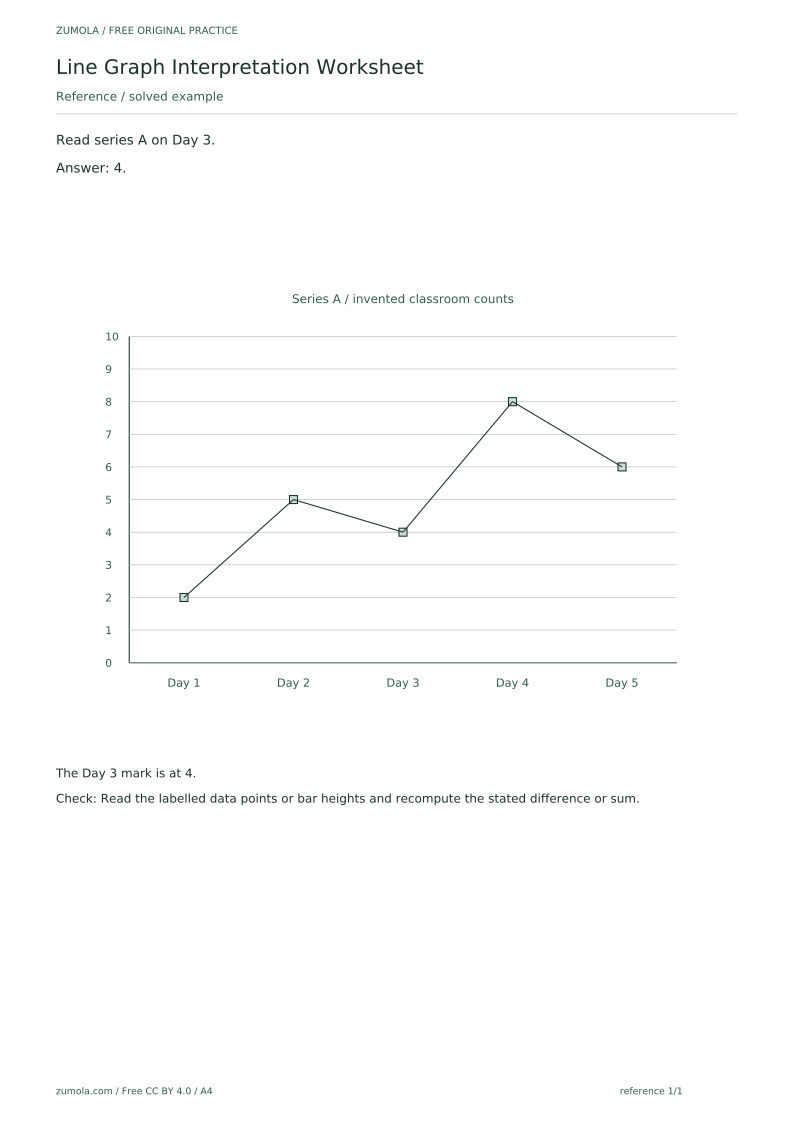
The pack contains separate reference, student and answer PDFs in both A4 and US Letter, plus a per-page SVG for each page. The reference page works through the first task as a guided example: reading series A on Day 3 and confirming the value is 4. The student page then presents the remaining tasks — identifying the largest increase between consecutive days, finding the total across all five days, and finding the range — with a blank attempt area left deliberately for students to show their working before checking. The answer PDF gives the correct results and the reasoning behind each one. Because the data are invented rather than measured statistics, the focus stays on graph-reading skills: locating points, comparing consecutive values, and combining values correctly.
Download the complete resource pack
All individual editable SVG pages (18)
- A4 reference page 1
- A4 student page 1
- A4 student page 2
- A4 student page 3
- A4 student page 4
- A4 answer page 1
- A4 answer page 2
- A4 answer page 3
- A4 answer page 4
- LETTER reference page 1
- LETTER student page 1
- LETTER student page 2
- LETTER student page 3
- LETTER student page 4
- LETTER answer page 1
- LETTER answer page 2
- LETTER answer page 3
- LETTER answer page 4
Print at 100% / actual size. Use the stated scale on any schematic diagram; physical cutting templates are identified separately. A4 and US Letter are separate files. Free access, no signup; CC BY 4.0.
How to use these pages
- Choose the A4 or US Letter set and print the reference page, student page and answer page.
- Read the reference example together, tracing how the Day 3 value of 4 is located on the graph.
- Have students complete the remaining tasks on the student page, using the blank attempt area for working.
- Ask students to check each answer against the answer PDF and recompute any differences or sums they are unsure of.
Four practice tasks and complete answers
Task 1
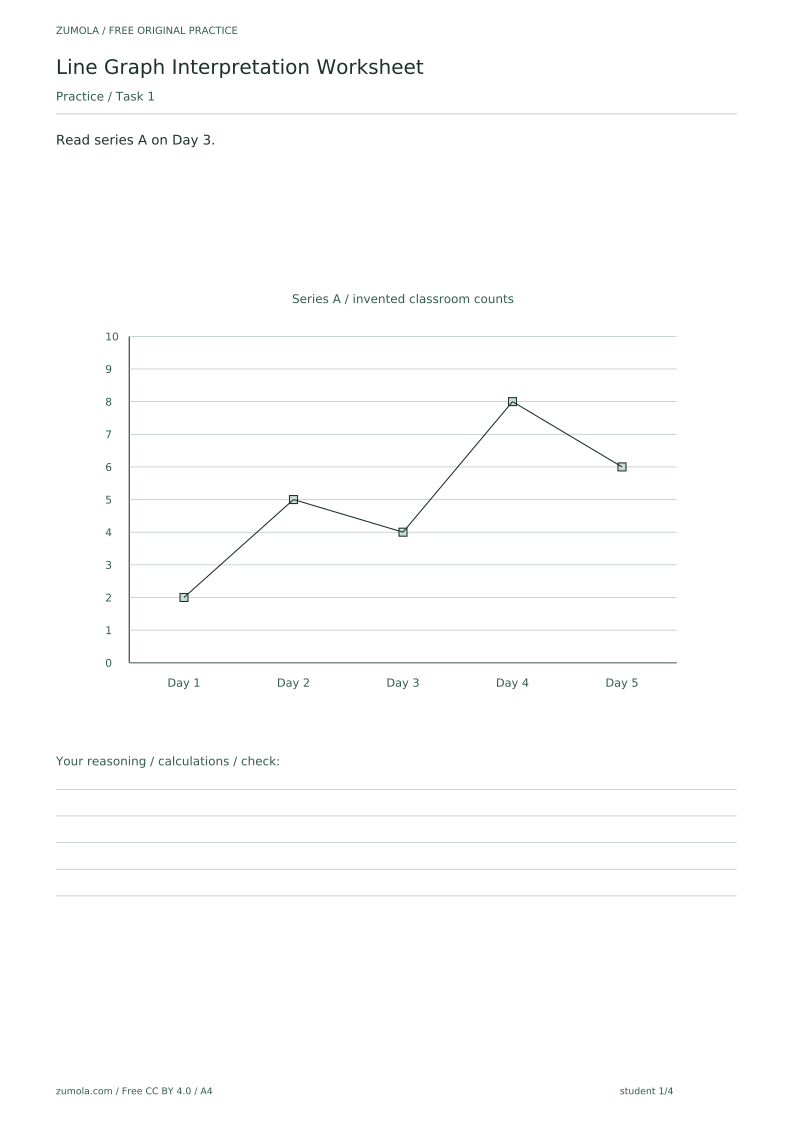
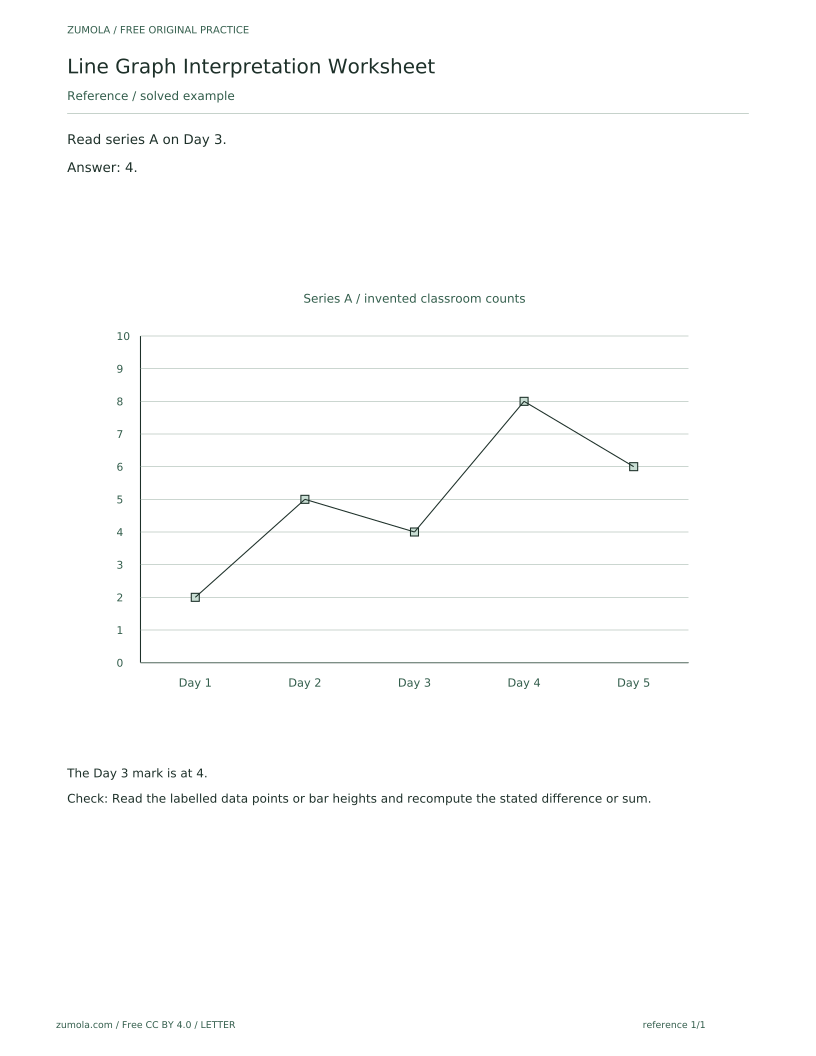
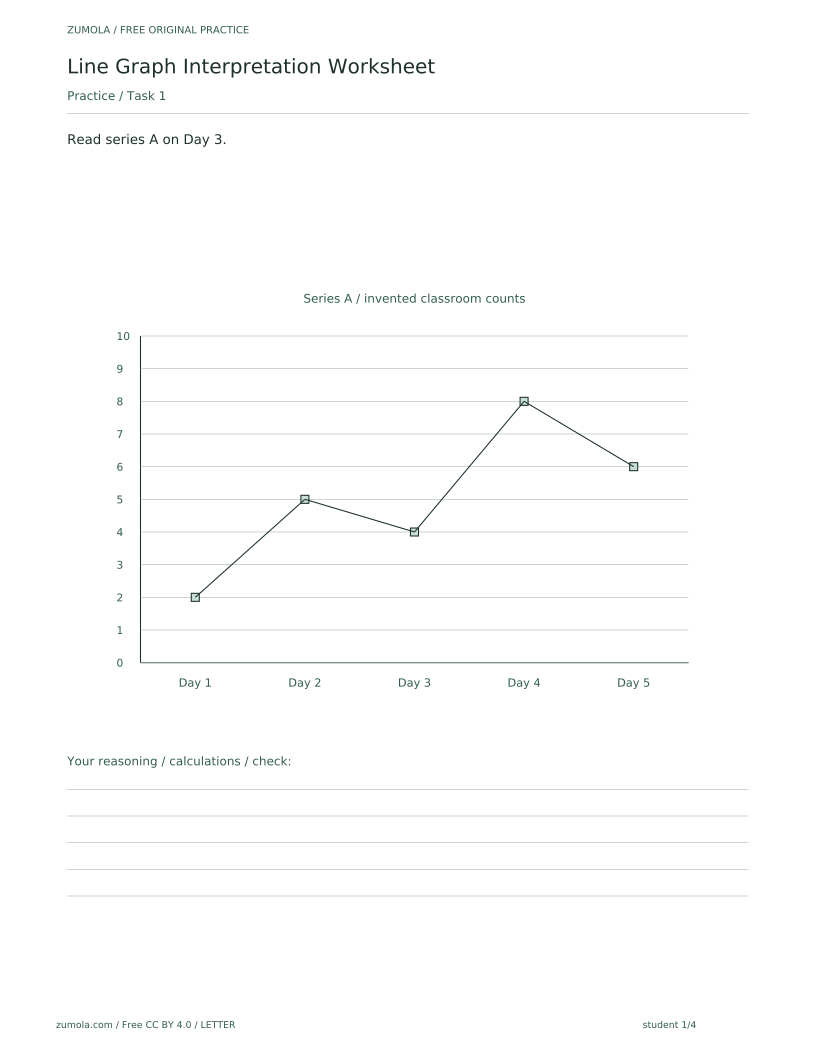
Read series A on Day 3.
Show answer 1
4.
The Day 3 mark is at 4.
Check: Read the labelled data points or bar heights and recompute the stated difference or sum.
Task 2
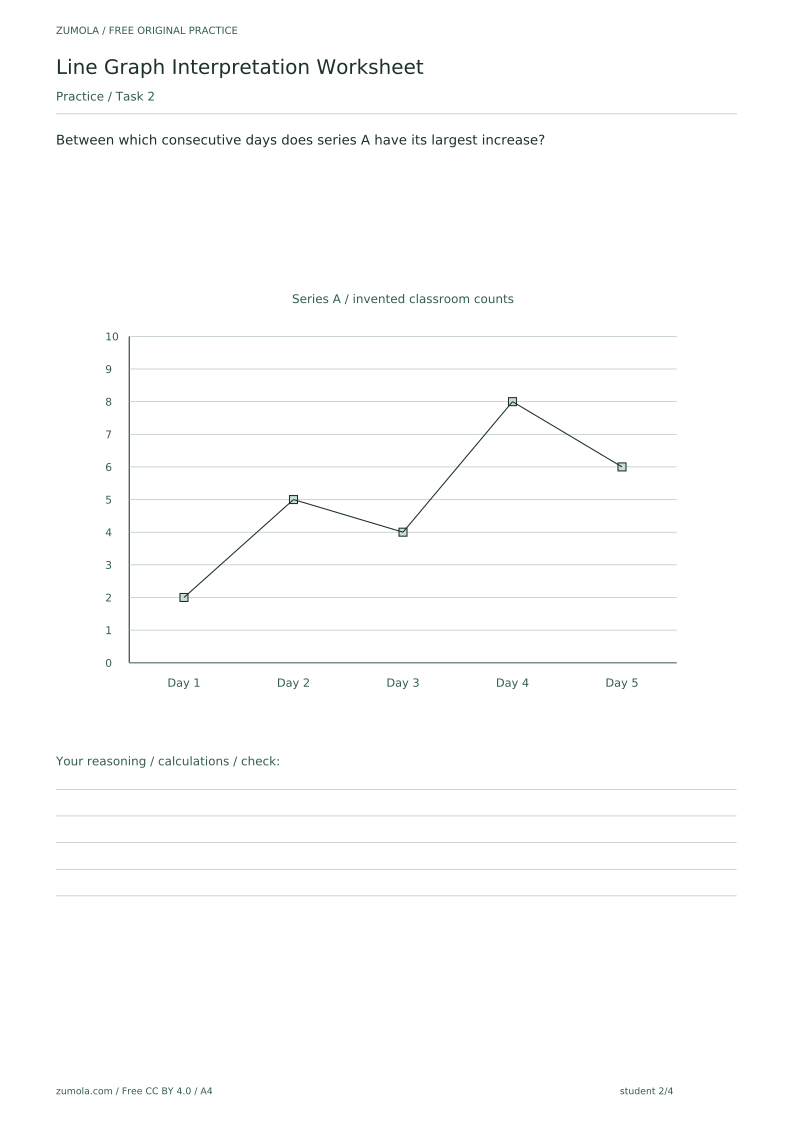
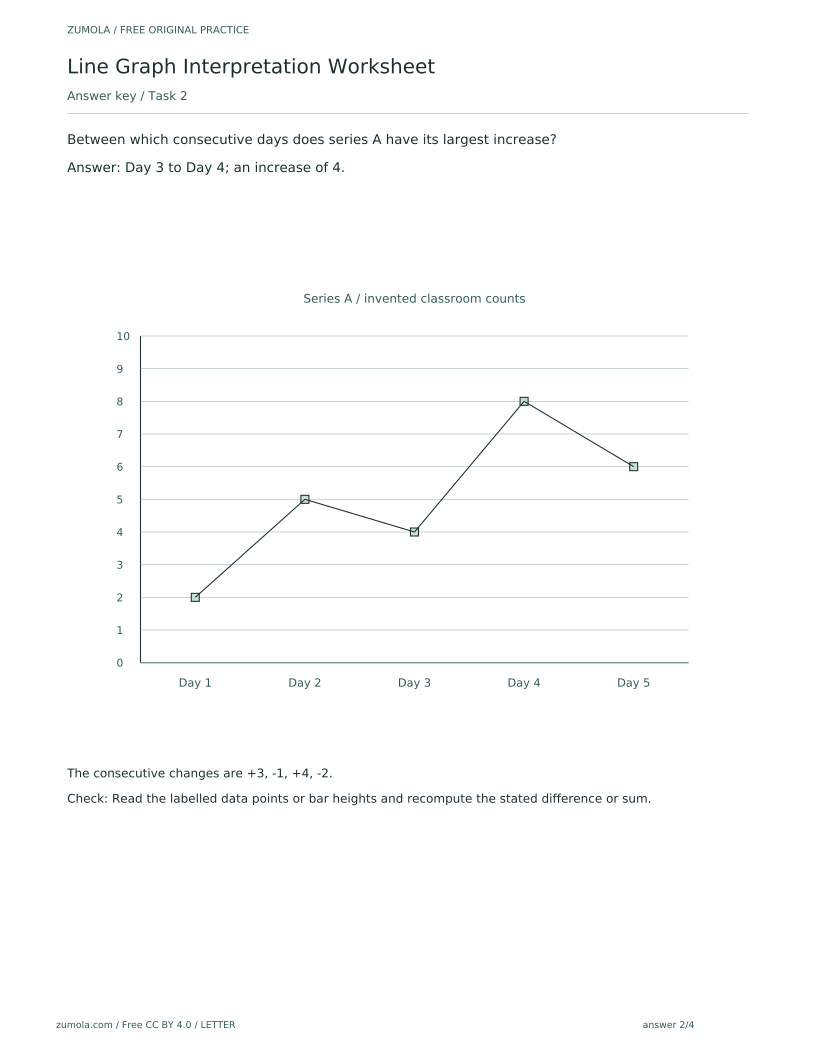
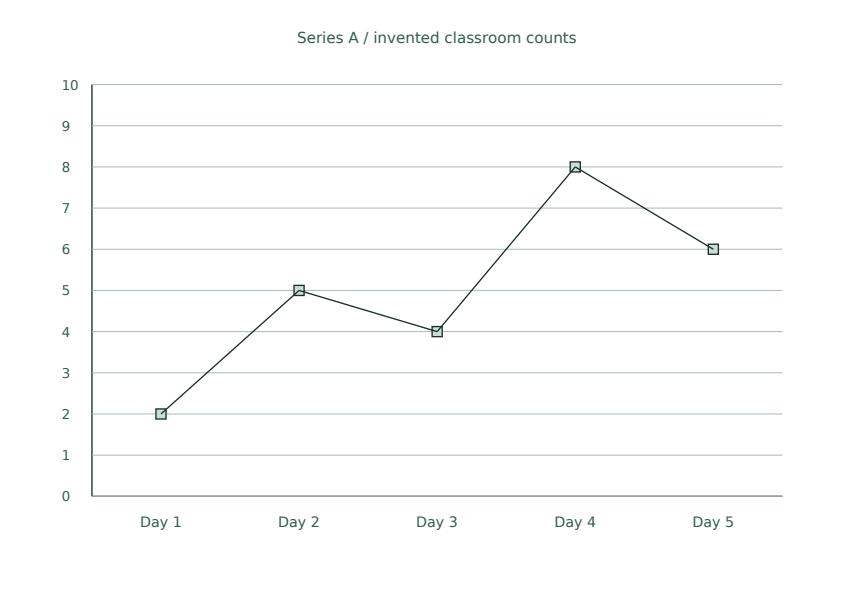
Between which consecutive days does series A have its largest increase?
Show answer 2
Day 3 to Day 4; an increase of 4.
The consecutive changes are +3, -1, +4, -2.
Check: Read the labelled data points or bar heights and recompute the stated difference or sum.
Task 3
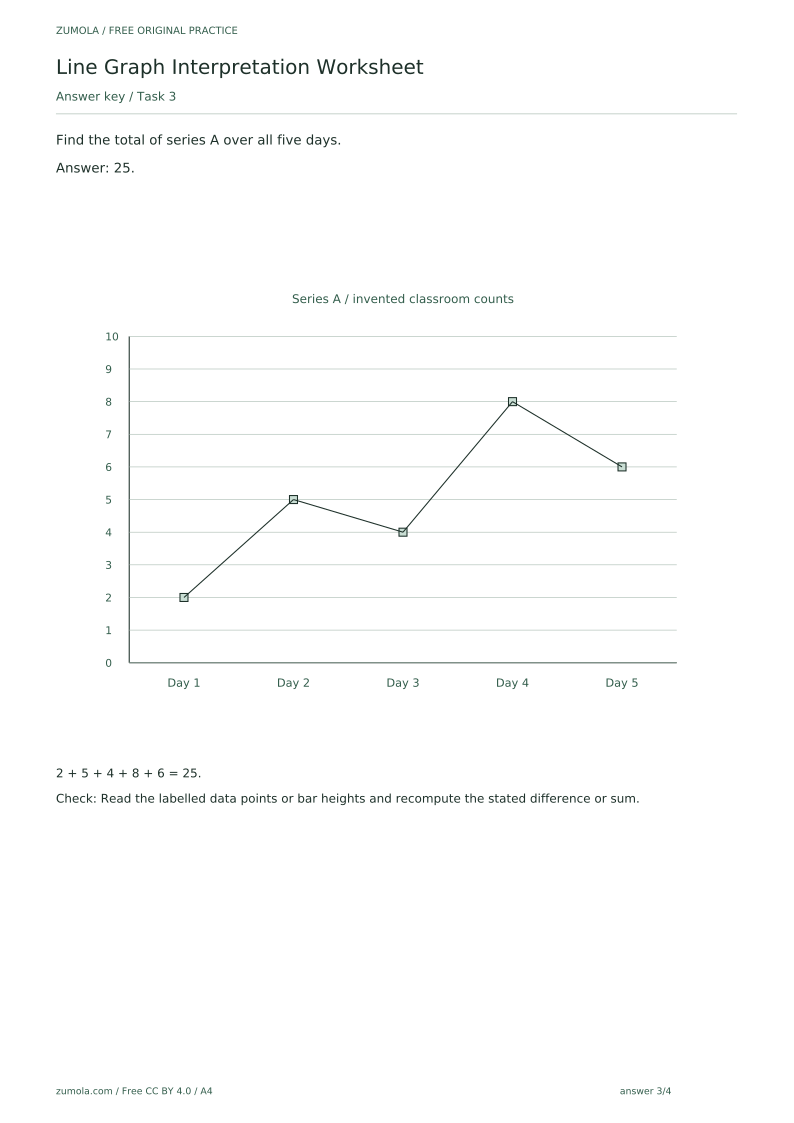
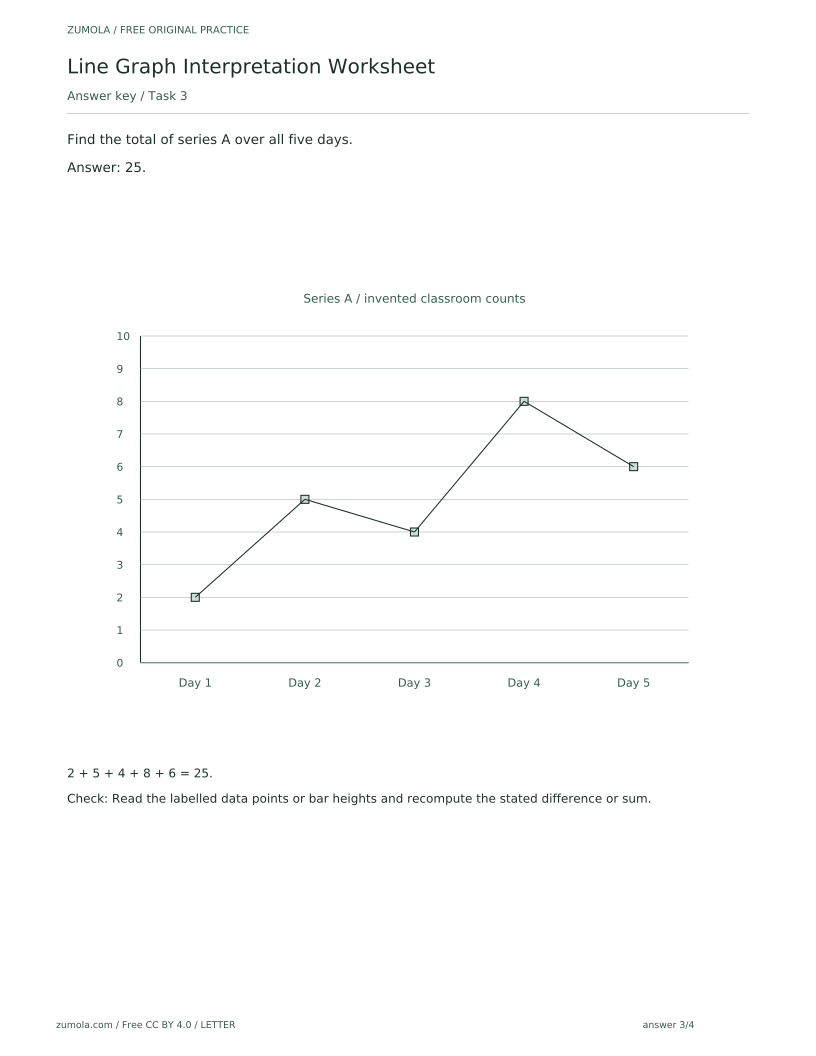
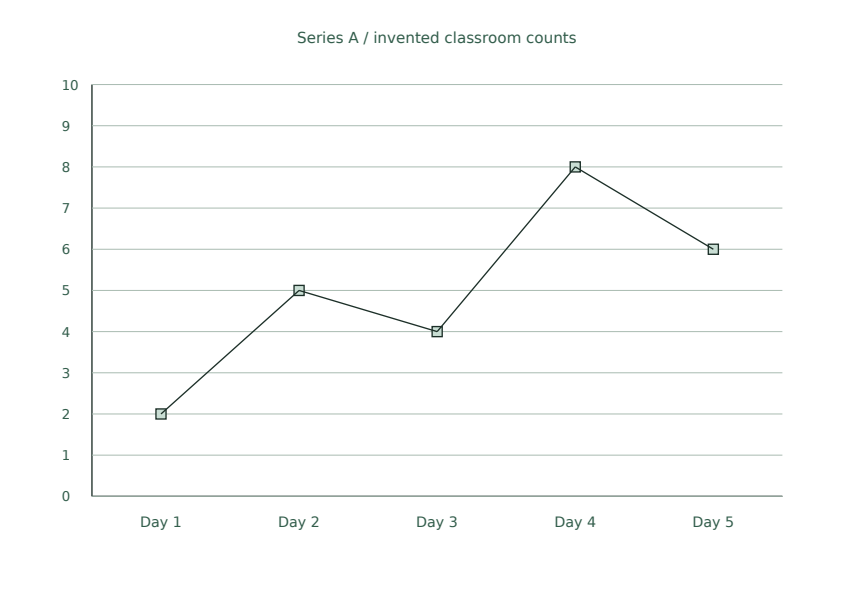
Find the total of series A over all five days.
Show answer 3
25.
2 + 5 + 4 + 8 + 6 = 25.
Check: Read the labelled data points or bar heights and recompute the stated difference or sum.
Task 4
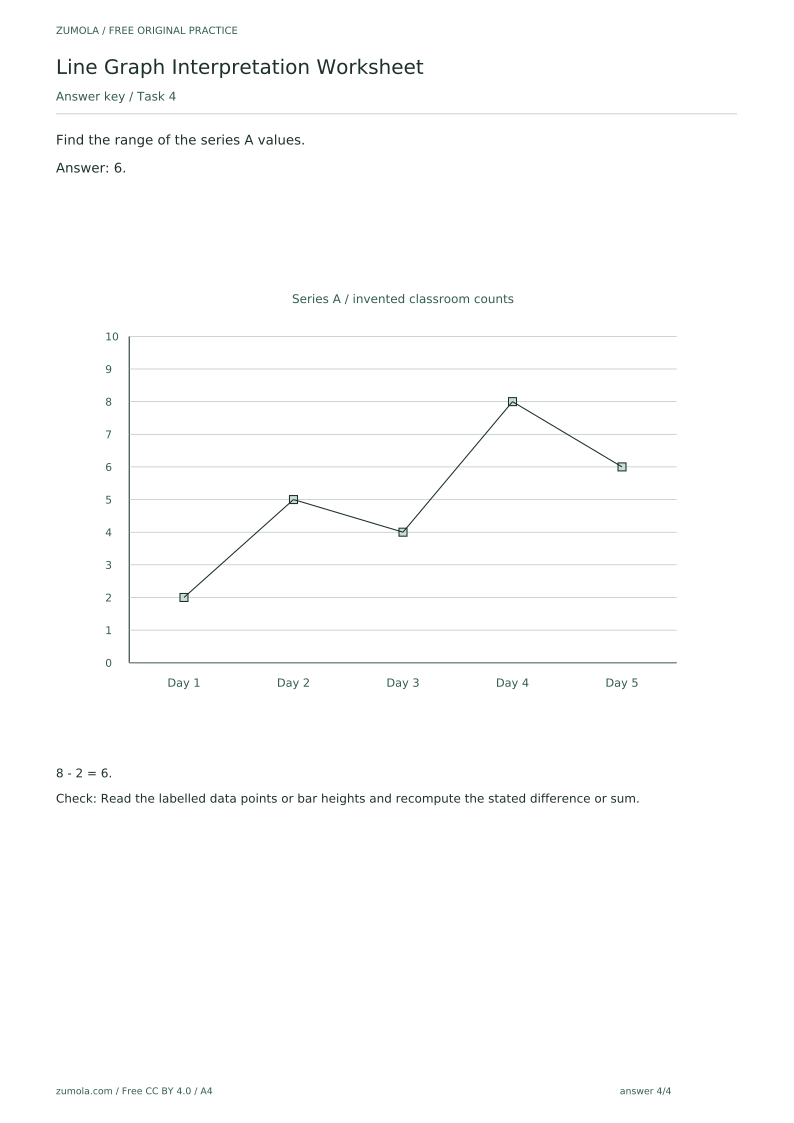
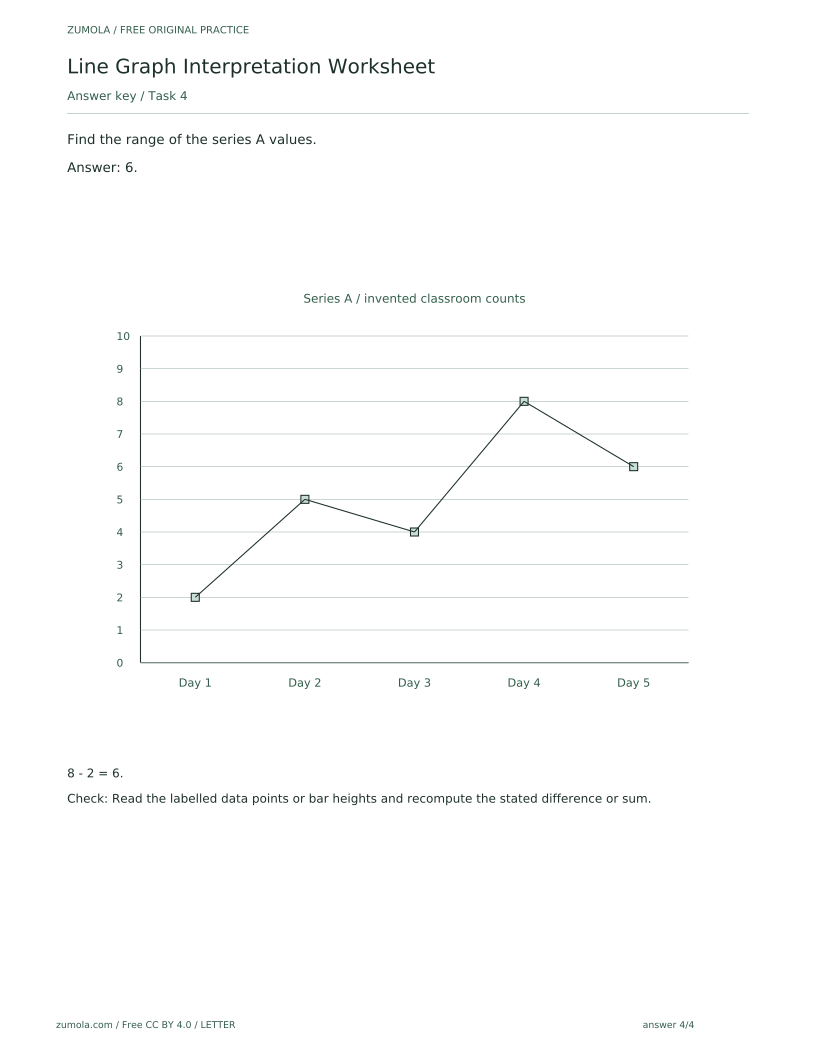
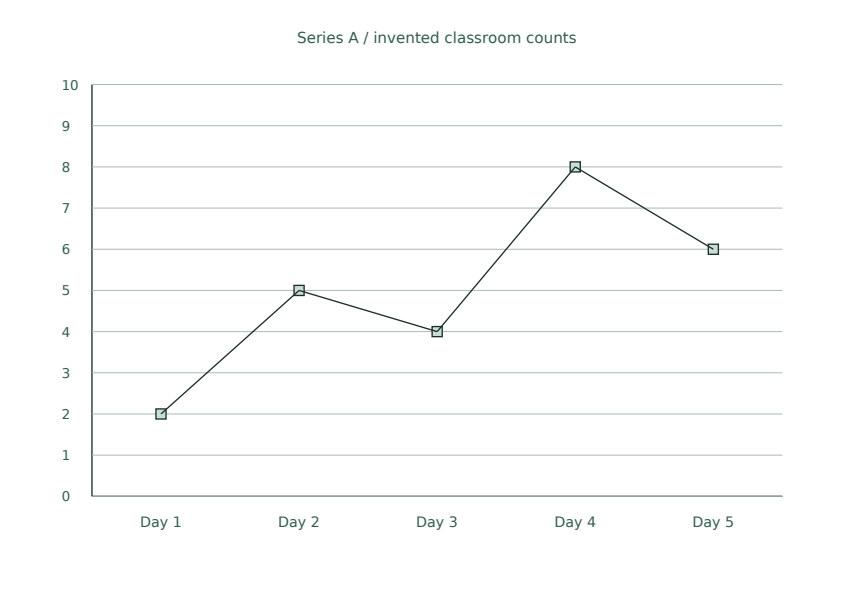
Find the range of the series A values.
Show answer 4
6.
8 - 2 = 6.
Check: Read the labelled data points or bar heights and recompute the stated difference or sum.
Useful checks
- Reading a point from the wrong day on the horizontal axis, which shifts every later comparison.
- Confusing an increase with a decrease when comparing consecutive days; note the changes are +3, -1, +4 and -2.
- Adding values incorrectly when finding the total, or subtracting the wrong pair when finding the range.
Questions about this resource
Is the worksheet free to print?
Yes. All six PDFs and the per-page SVGs are free, with separate A4 and US Letter versions.
Do the graph values come from real statistics?
No. The classroom counts are invented for practice, so the worksheet is about reading the graph, not interpreting real-world data.