Free graphing resources · Original practice
Line graph worksheets.
Follow the observations in order.
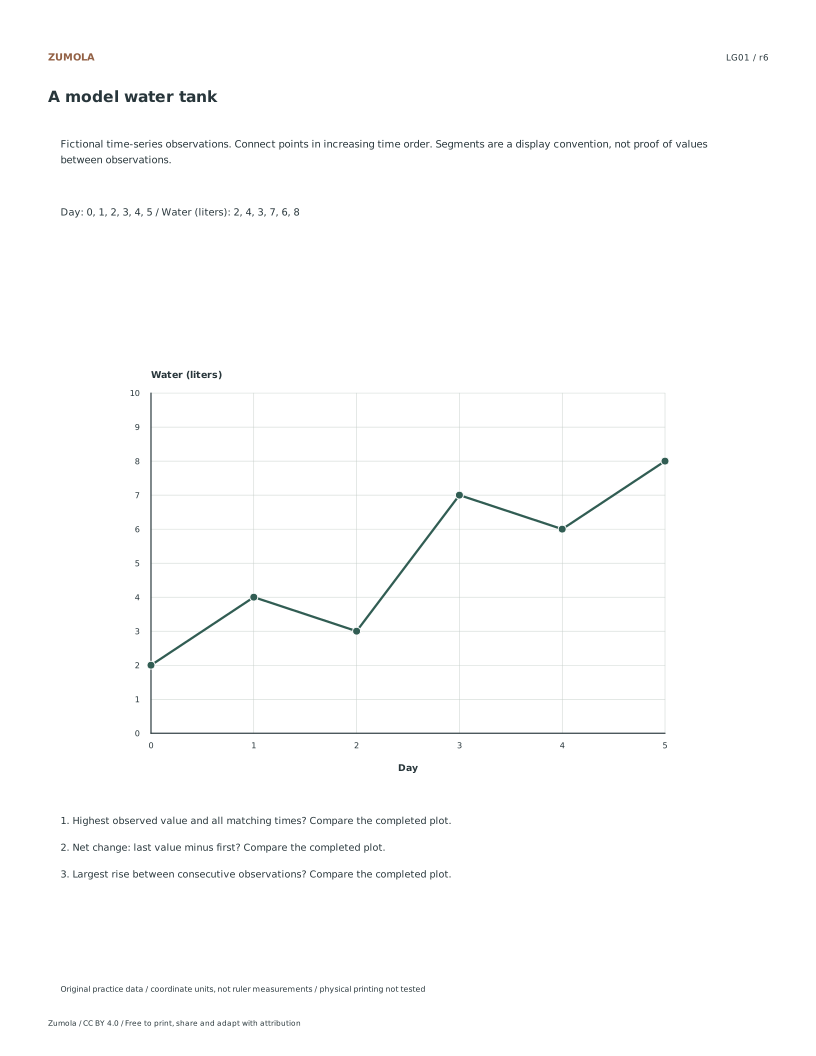
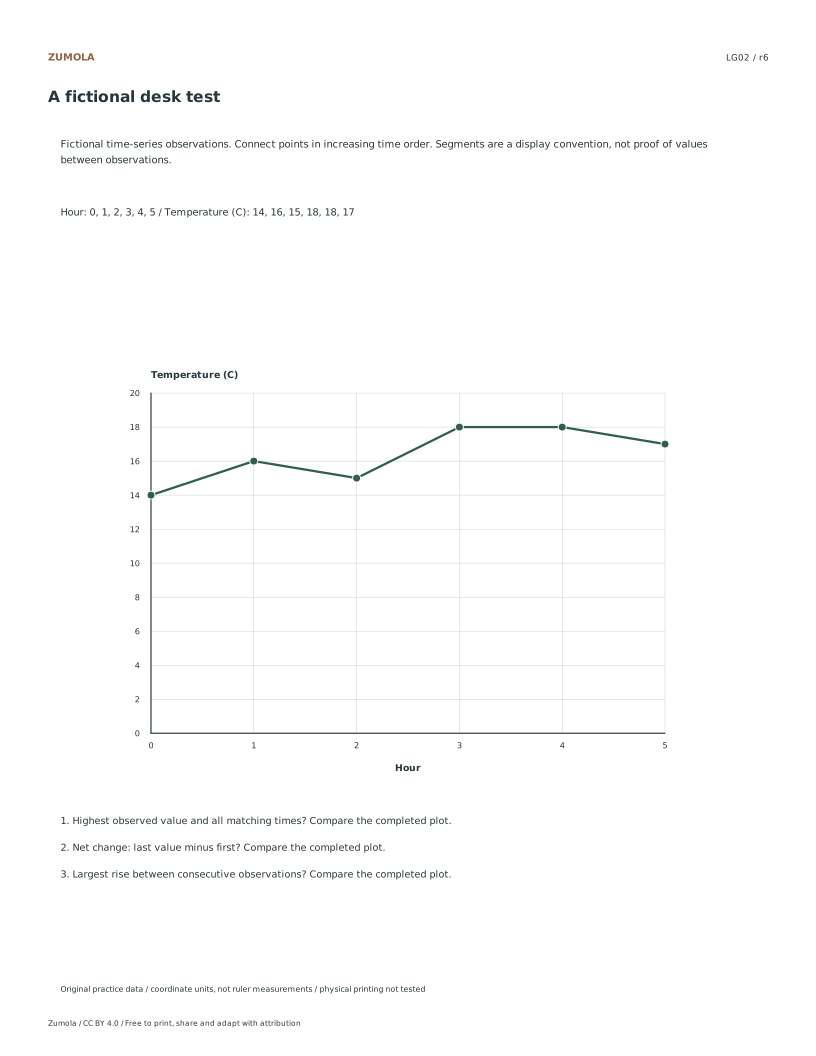
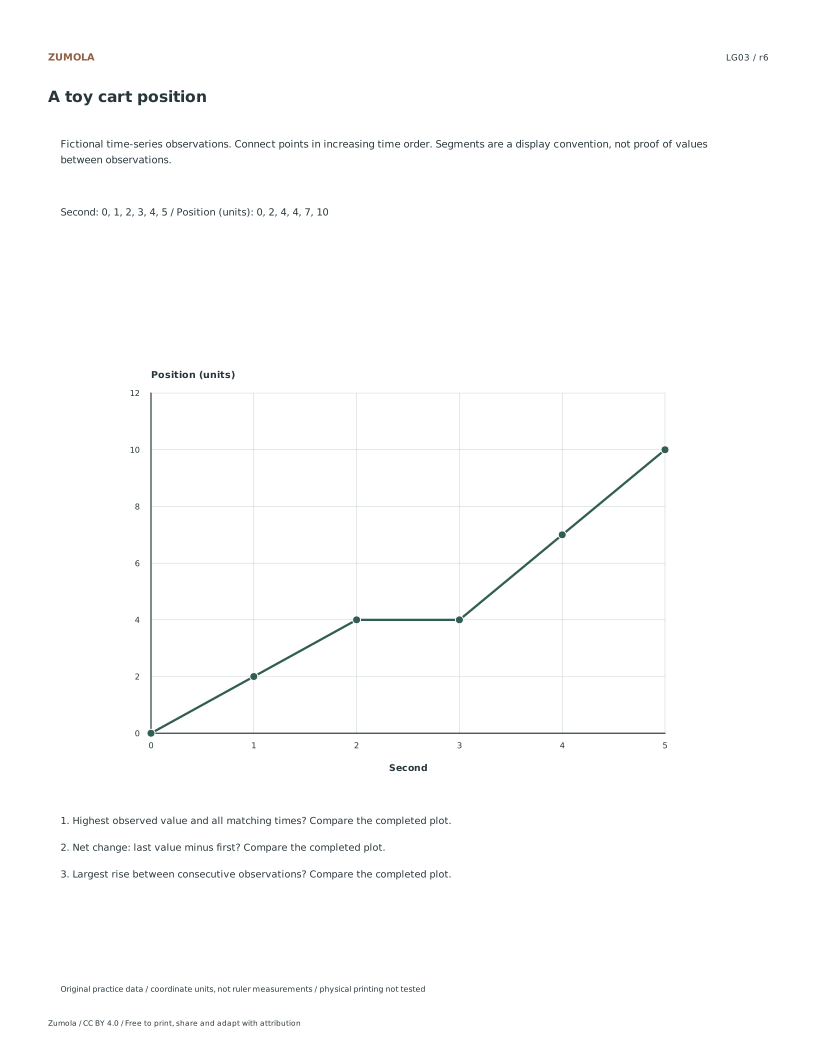
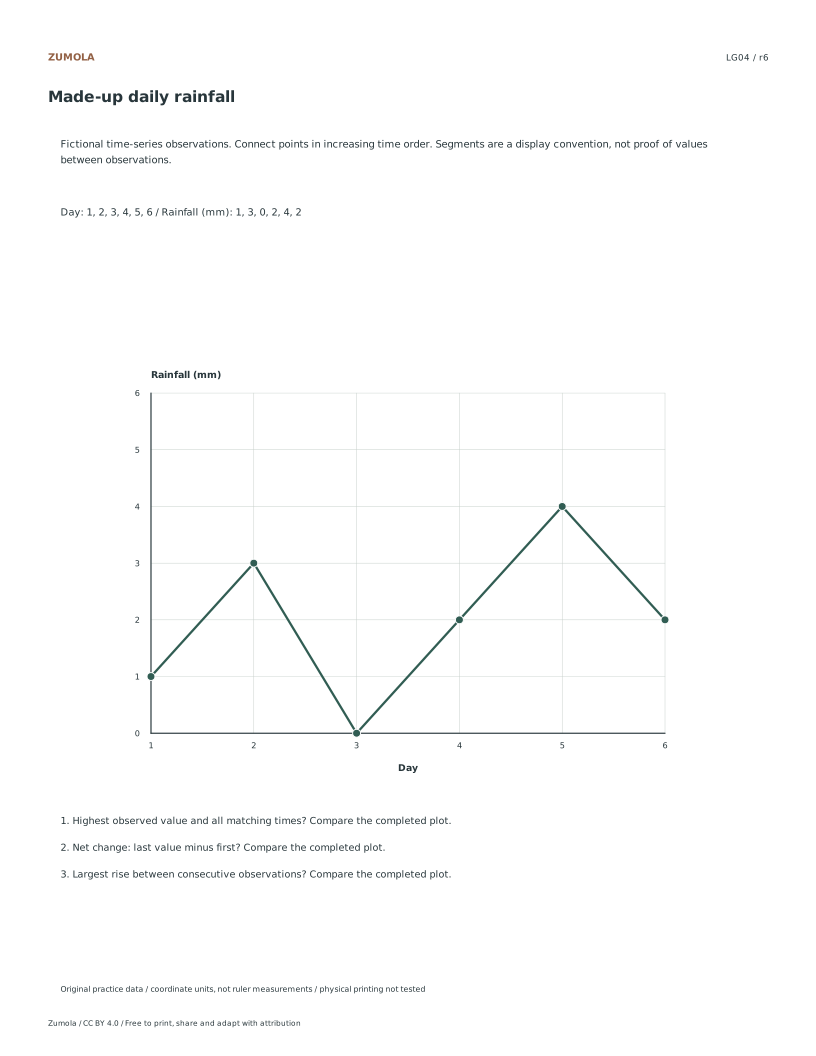
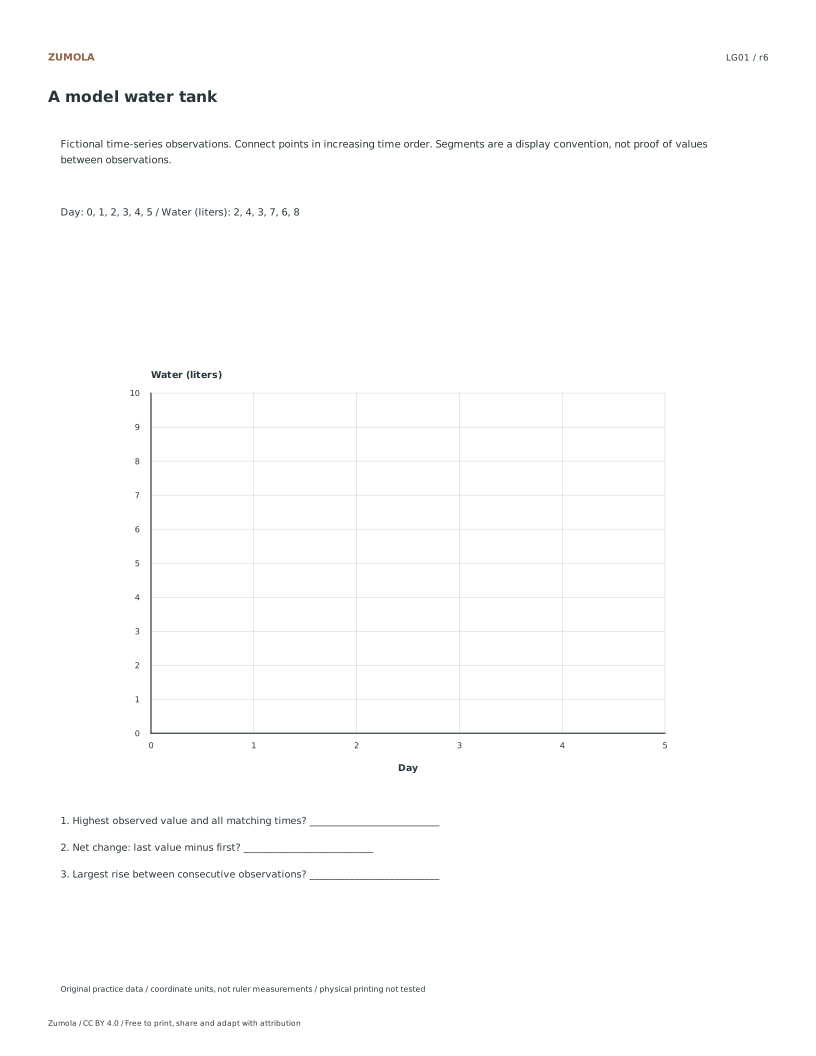
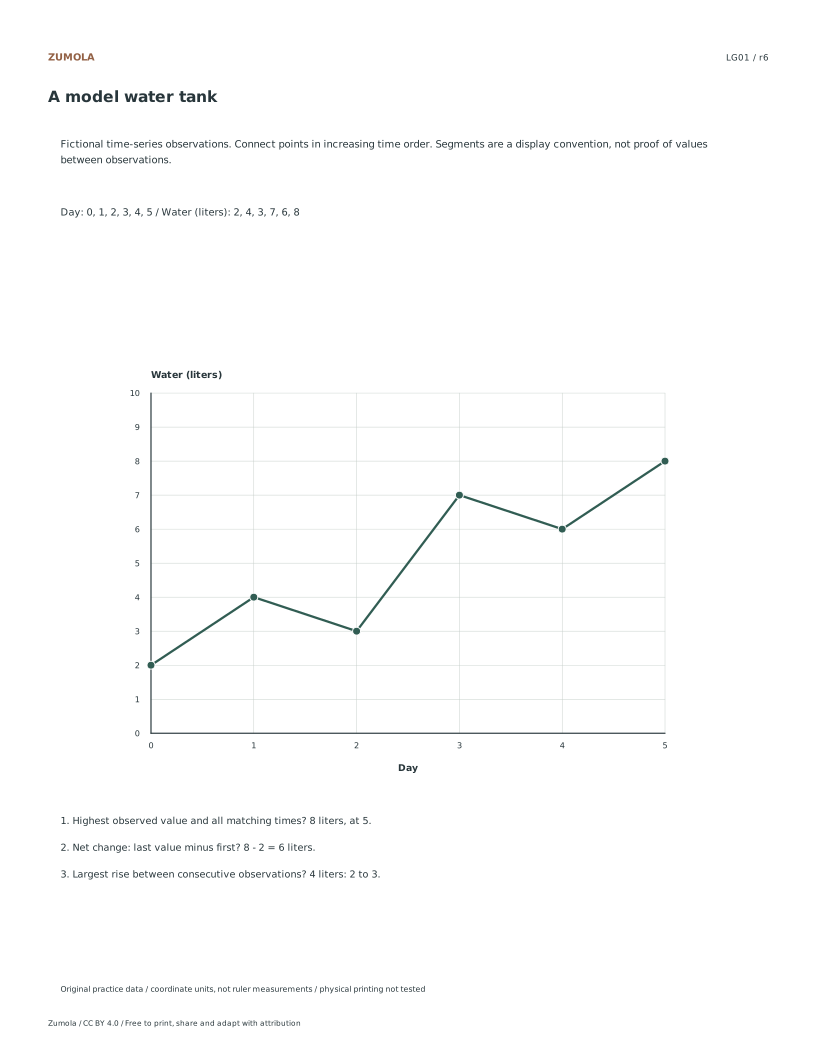
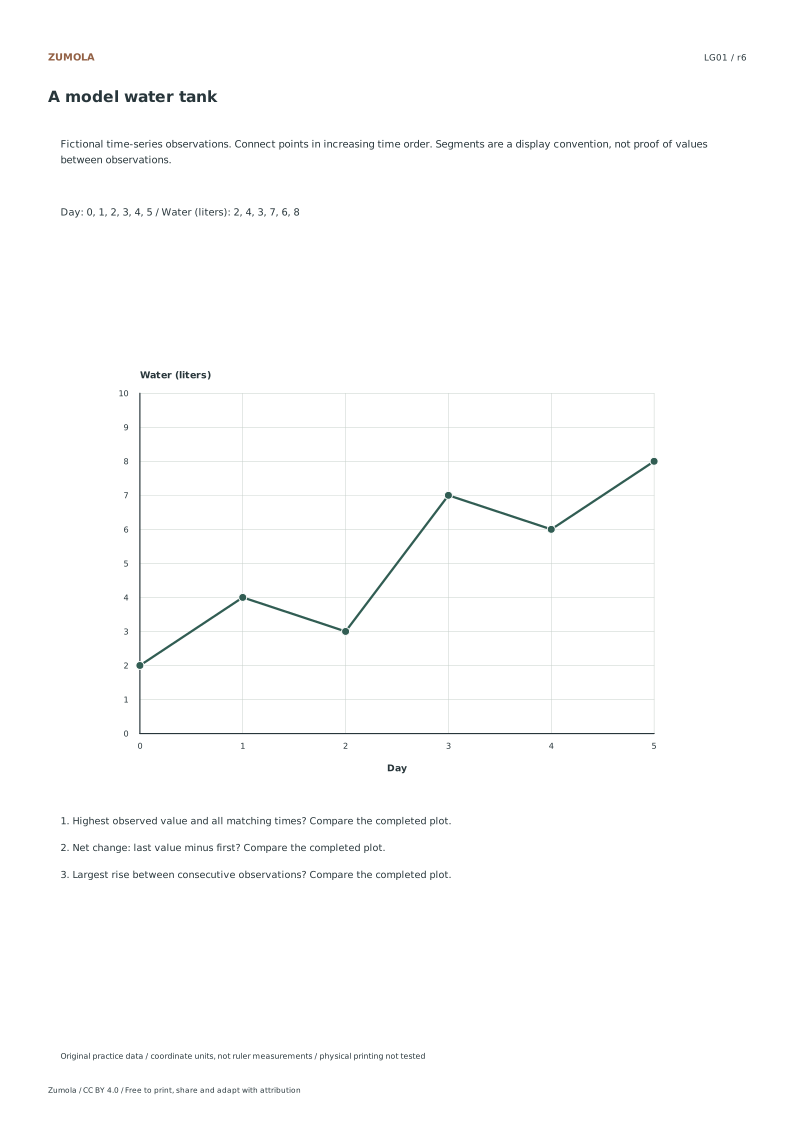
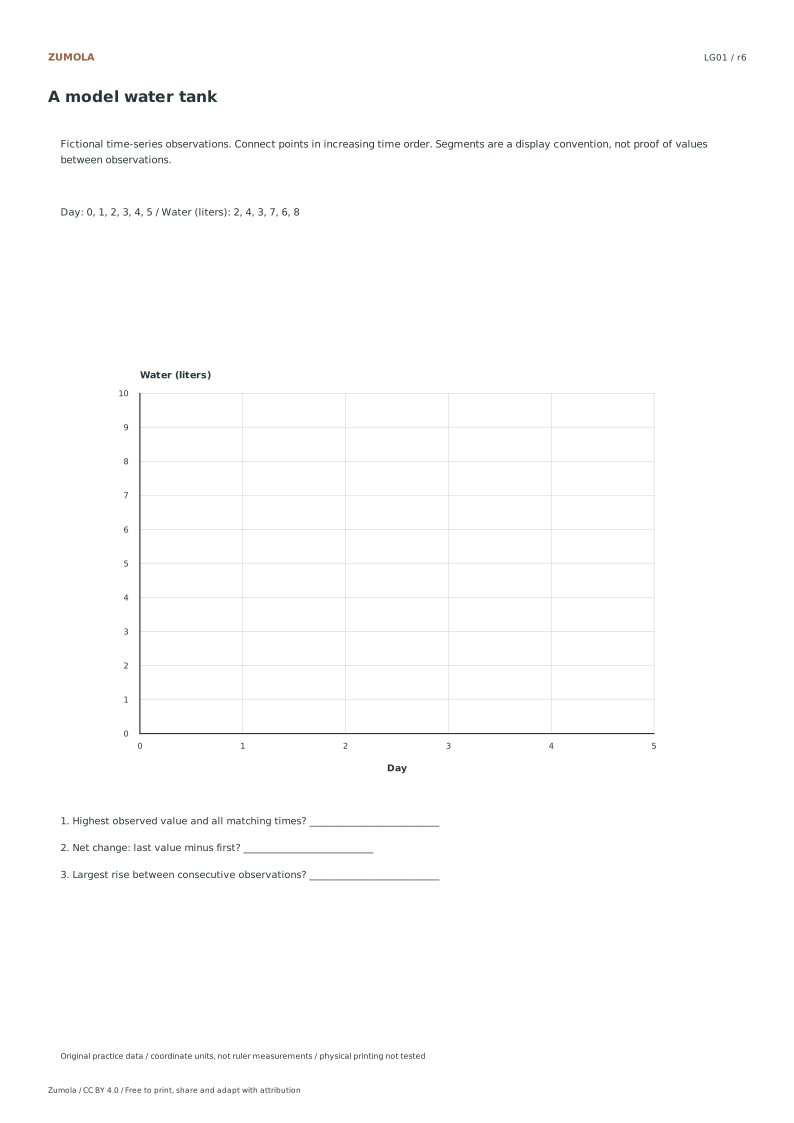
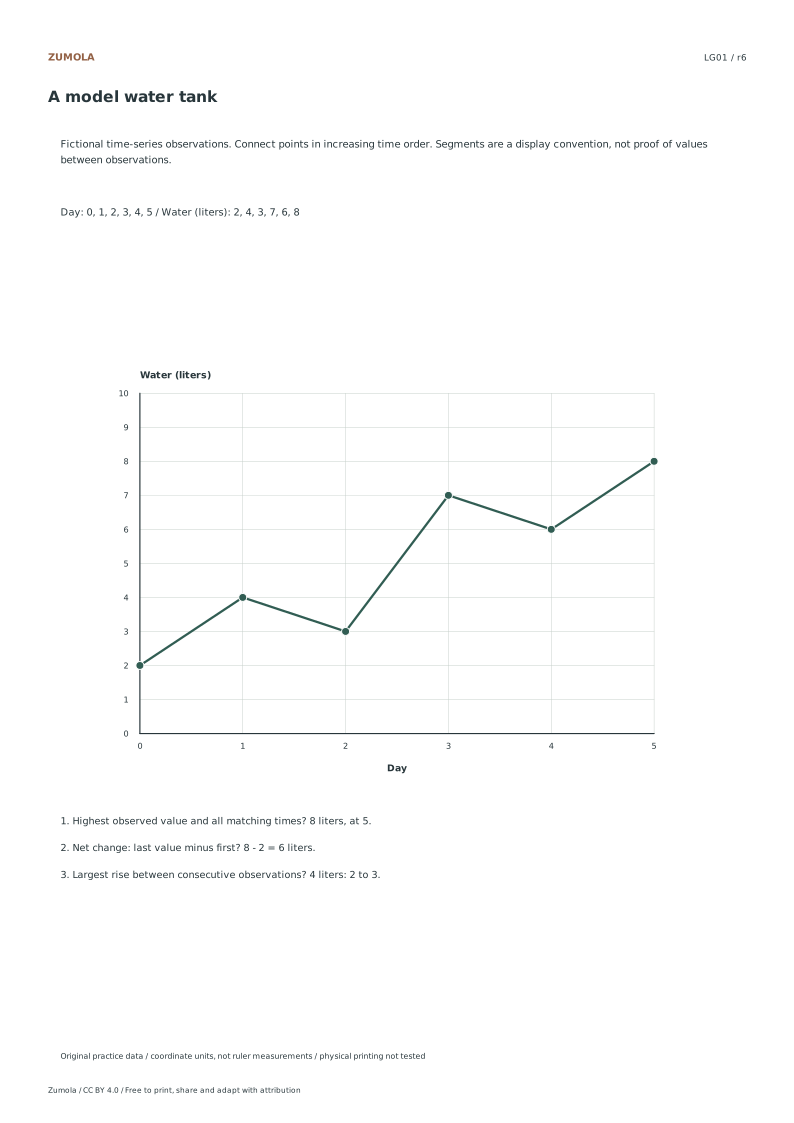
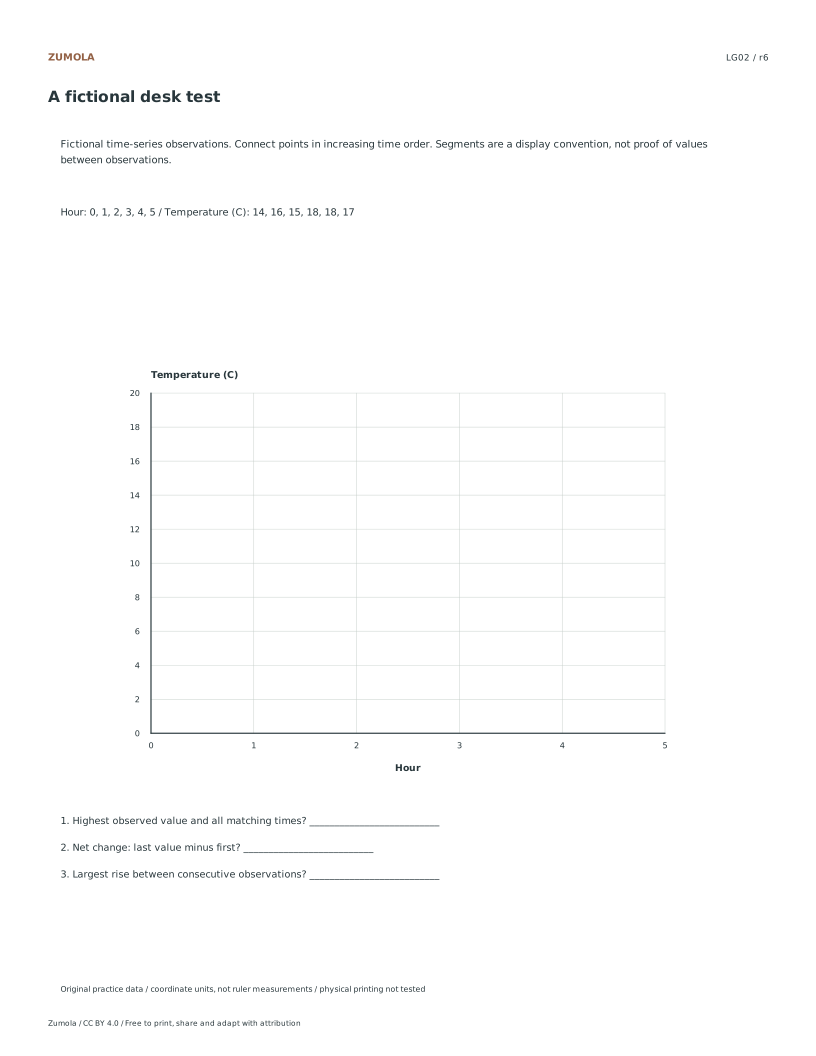
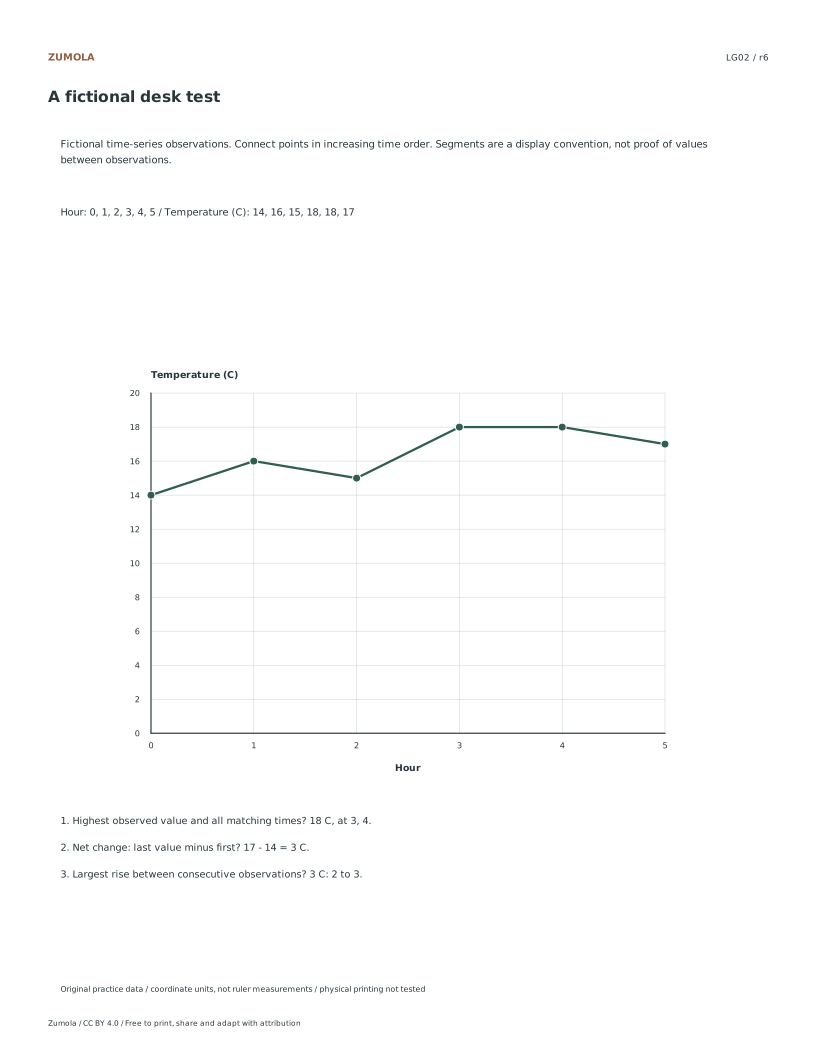
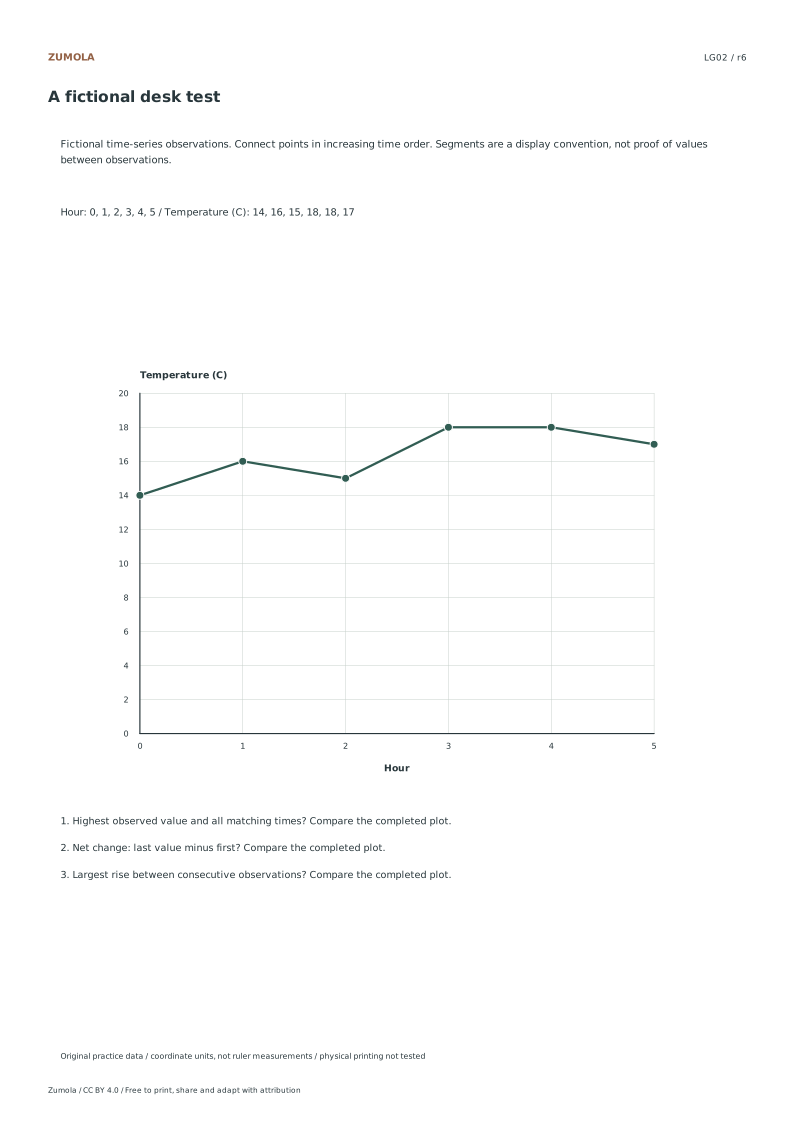
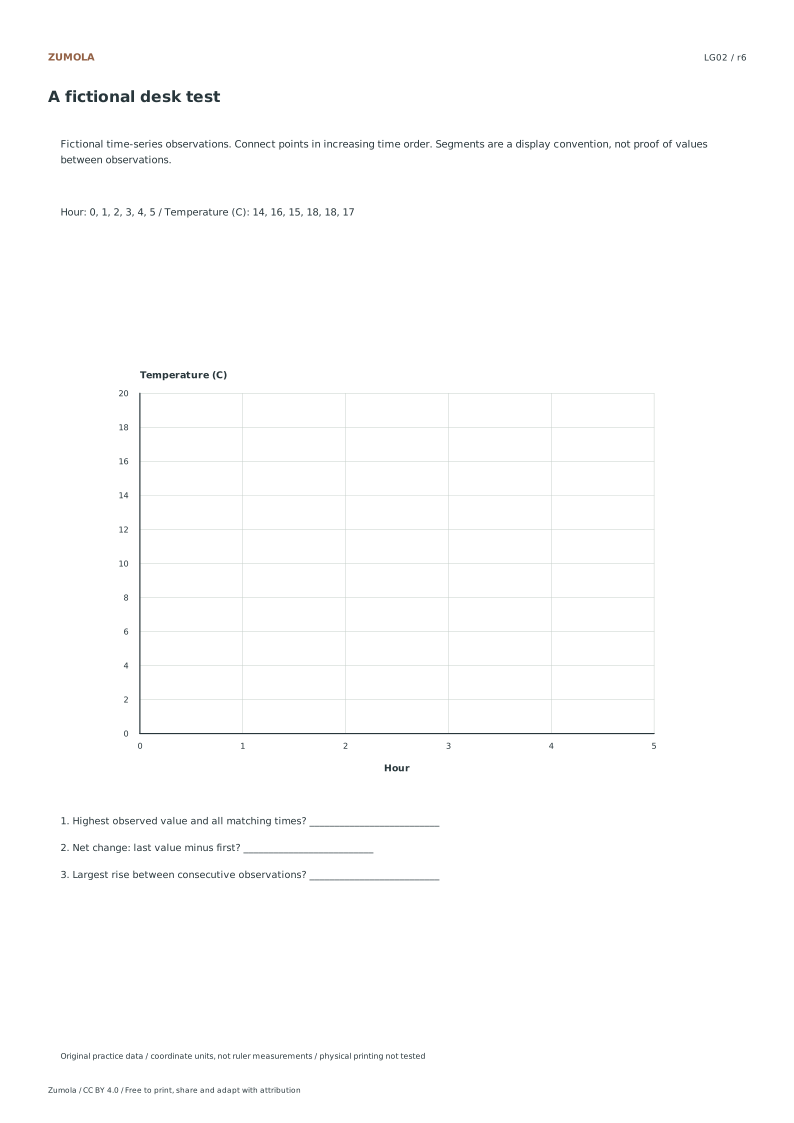
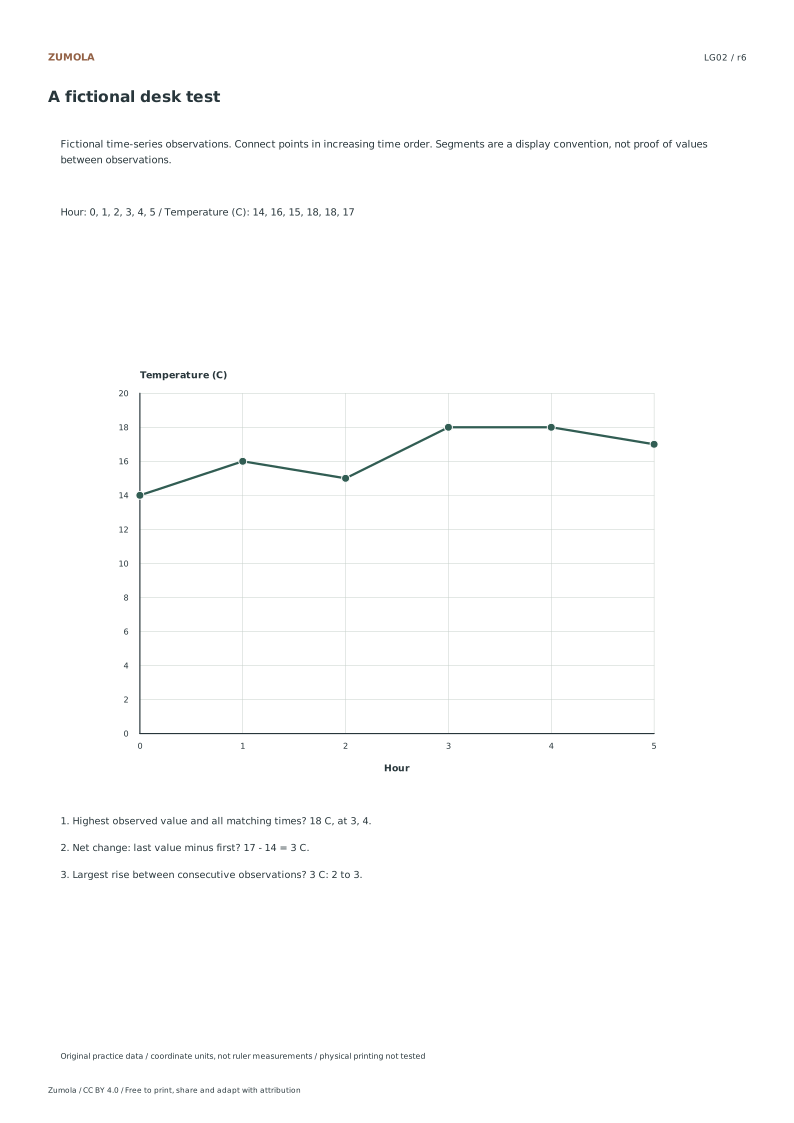
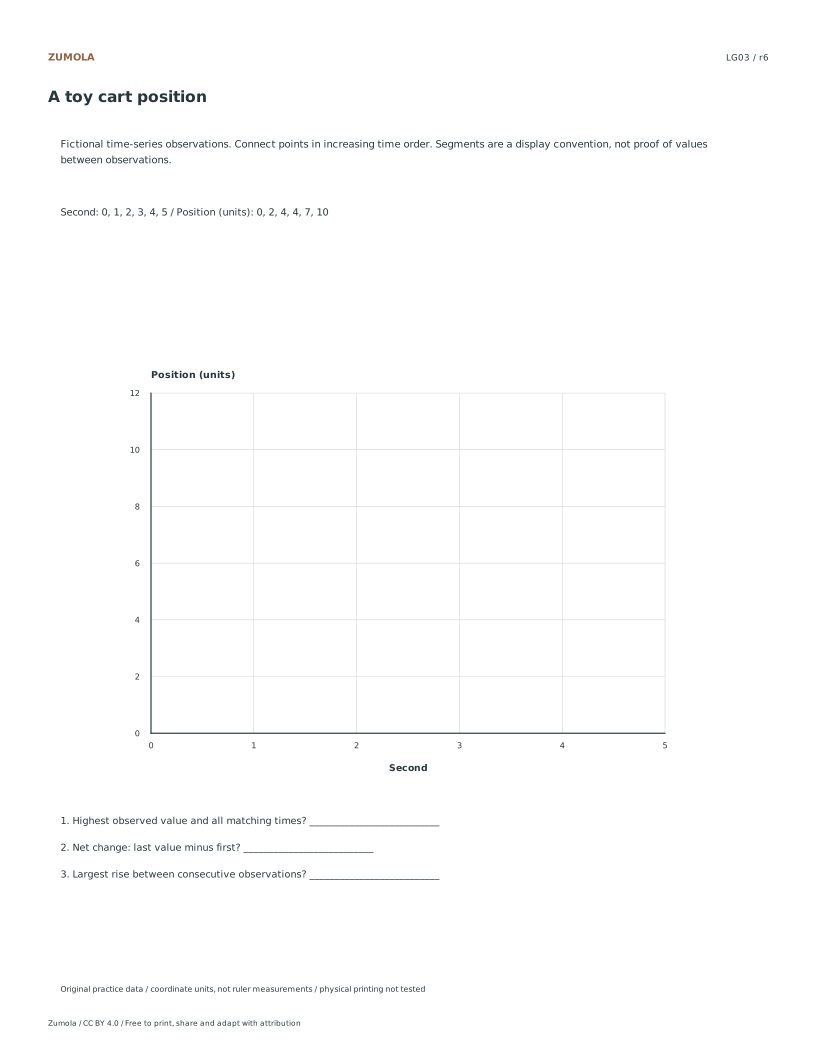
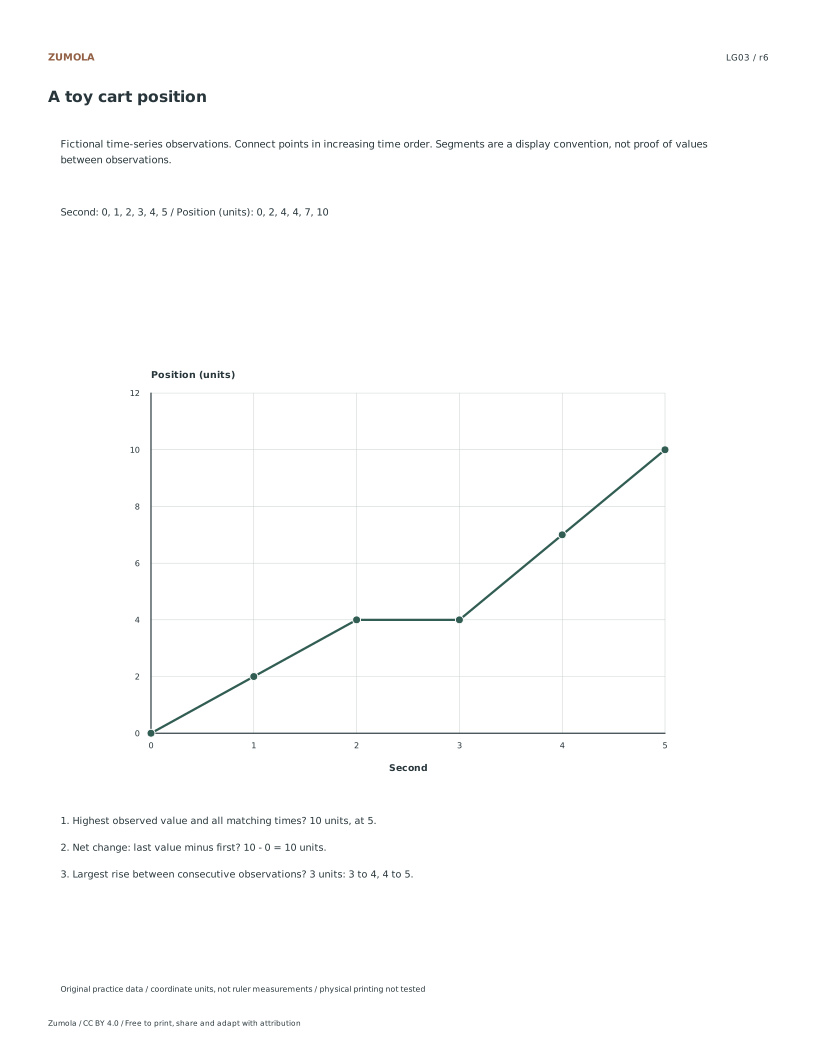
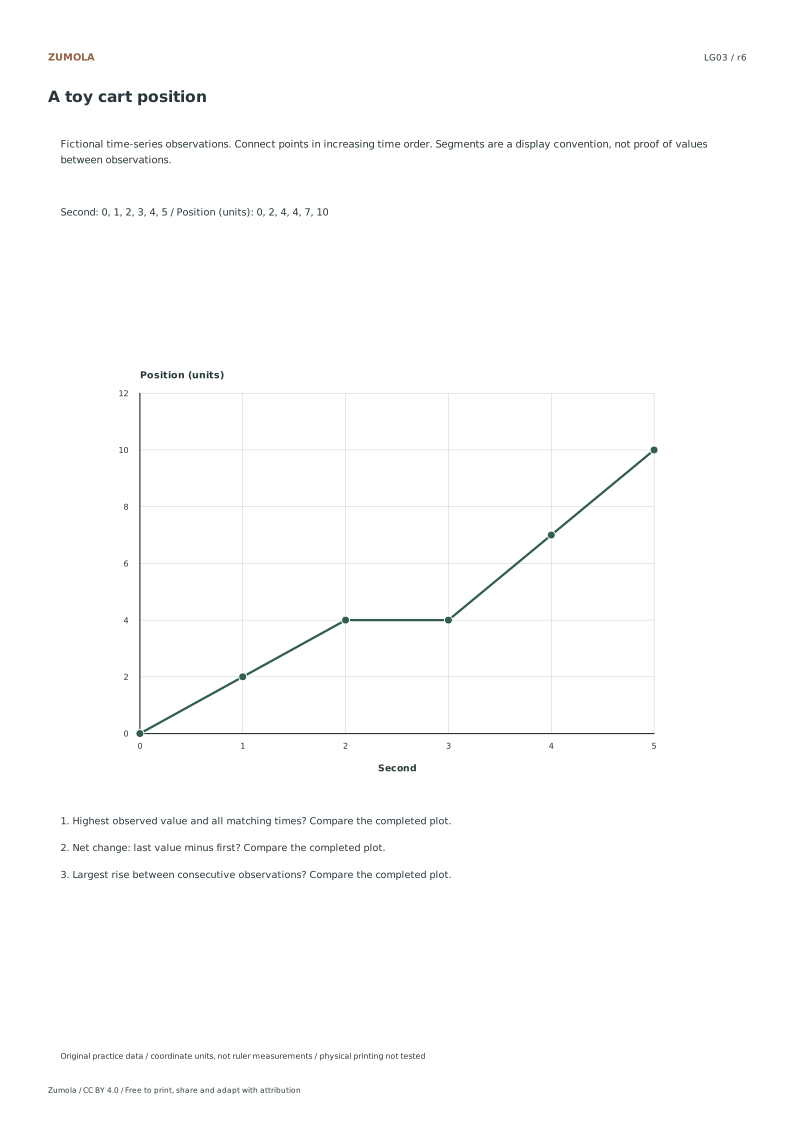
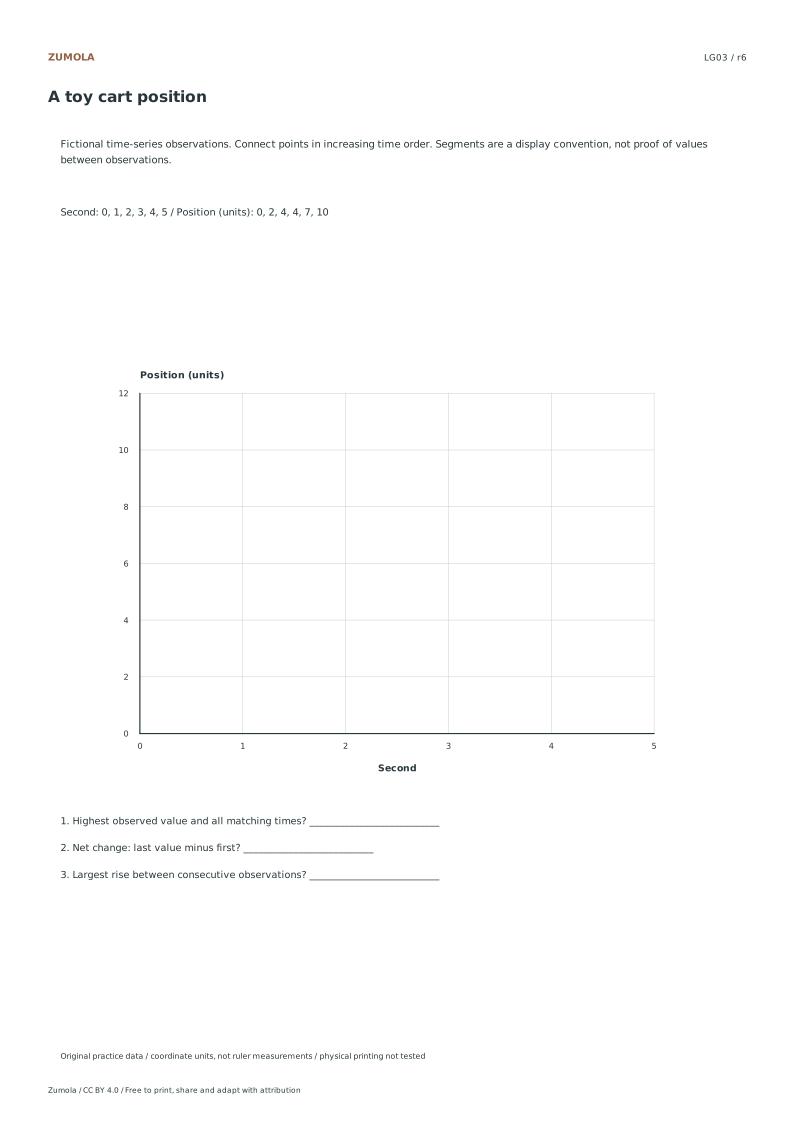
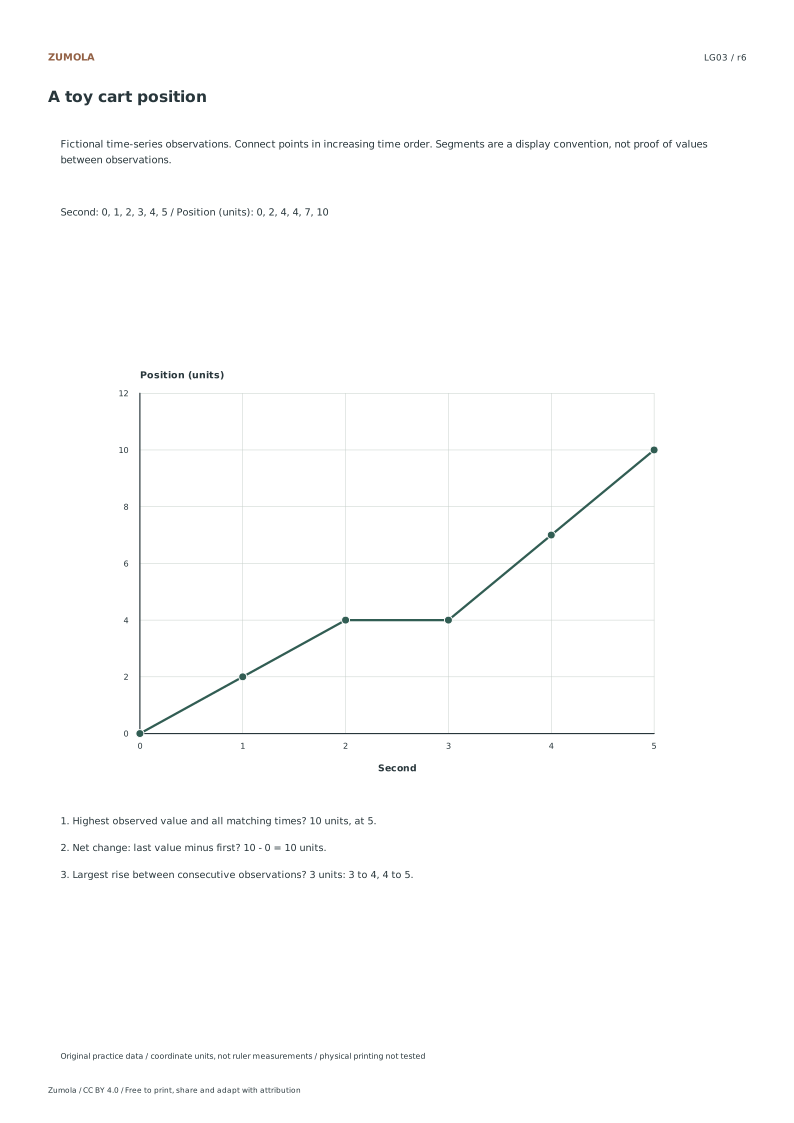
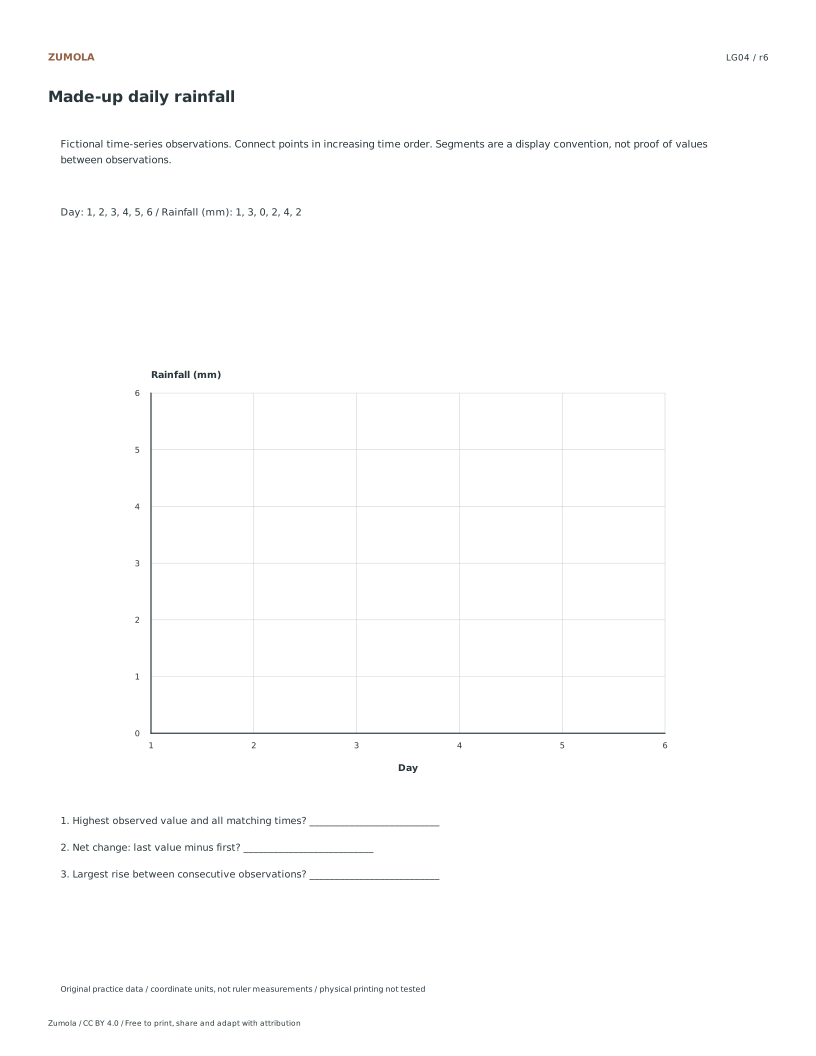
Draw four time-series line graphs from labeled tables. Read the highest observation, calculate net change and find every interval sharing the largest rise.
4 time-series tasks.
Plot, compare and check ties.
More ways to practice
Match the mark to the data type
A line graph joins observations taken along a continuous ordered scale, usually time. The connecting segment implies change between neighbouring readings, so the order of points matters. A bar chart compares separate categories, and its bars need not touch. A histogram groups continuous measurements into bins; its bars touch because the bins are adjacent intervals, and the height is a frequency, not a reading at one moment.
Before drawing, write the data type beside the table: time series, category counts, or binned measurements. If the x-values are labels such as colours or names, a line is misleading. If the x-values are bin edges, a histogram is the honest choice. State the bin width and whether bins are inclusive on the left or right, because a value on a boundary must land in exactly one bin.
For any frequency display, keep raw counts and the total consistent. Add the bin frequencies and compare with the stated total; if they differ, the table or the bins are wrong. For quartiles, declare the method: for n ordered values, the lower quartile can be taken as the median of the lower half when n is even, and the median of values below the overall median when n is odd. Different conventions give different answers, so name yours.
- Label each column as time, category, or binned measurement.
- Decide the mark: line for ordered time series, bars for categories, touching bars for bins.
- Write the bin width and boundary rule if bins are used.
- Sum frequencies and check the total against the stated sample size.
- State the quartile rule before computing any quartile.
Read intervals, not just endpoints
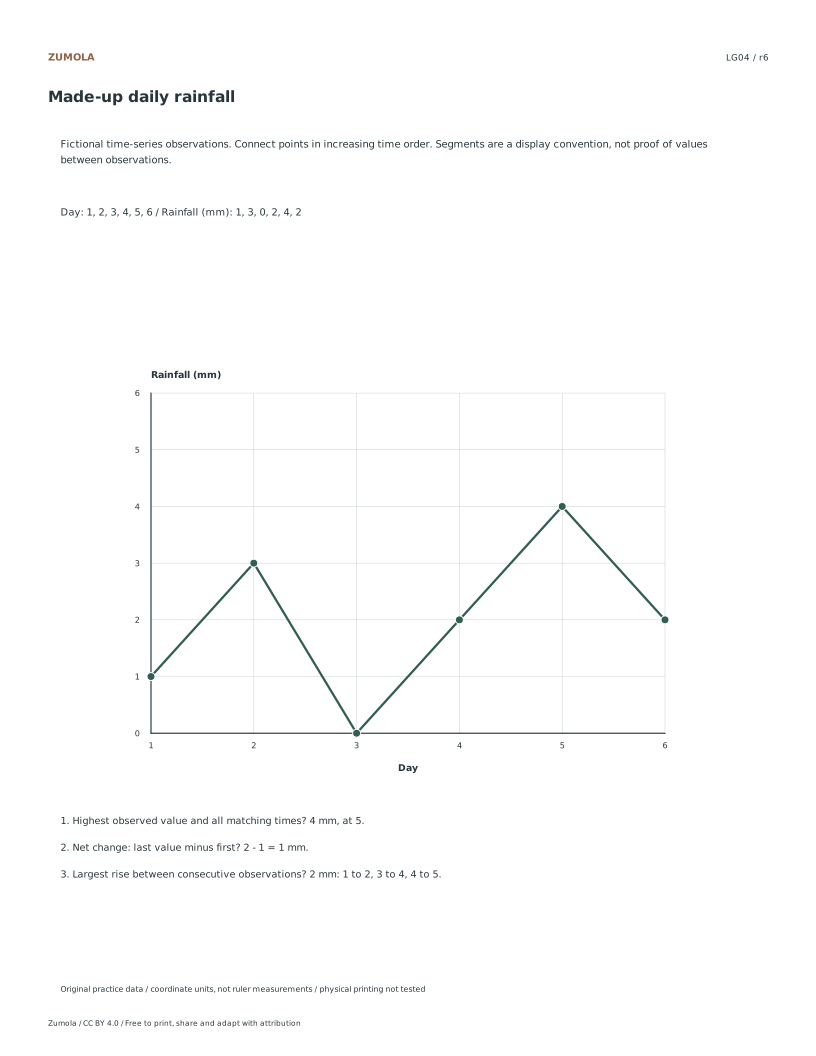
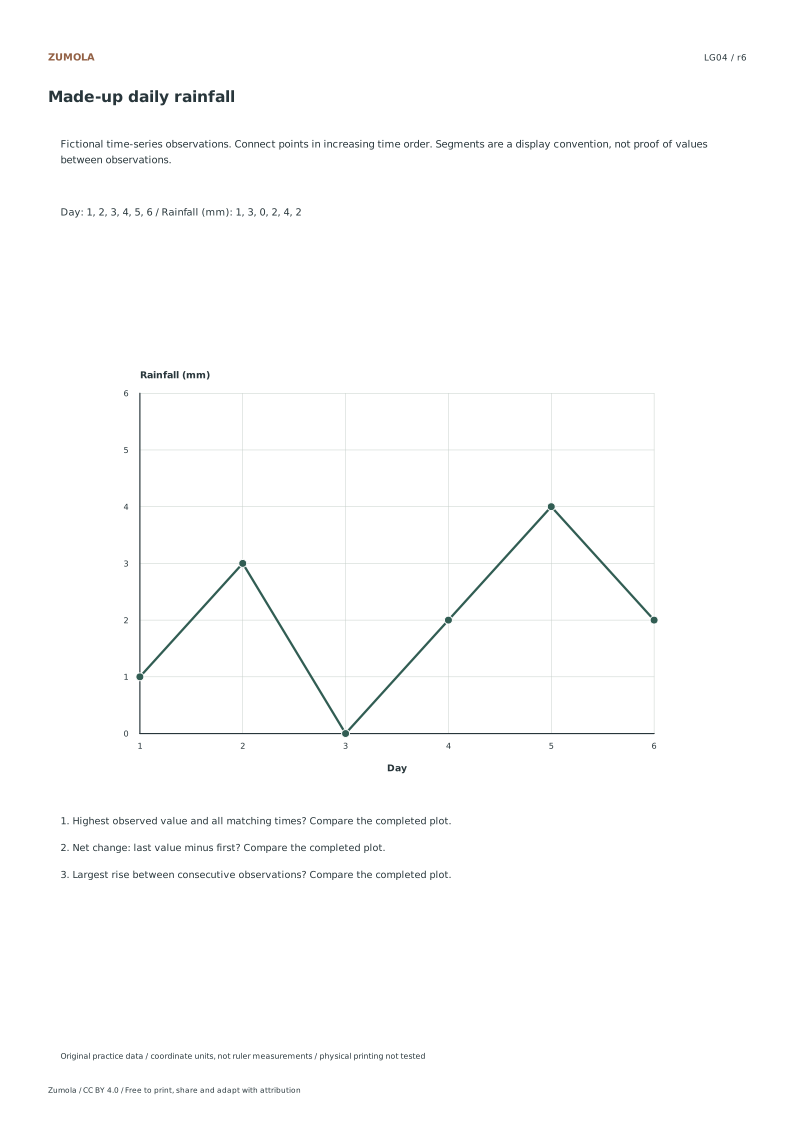
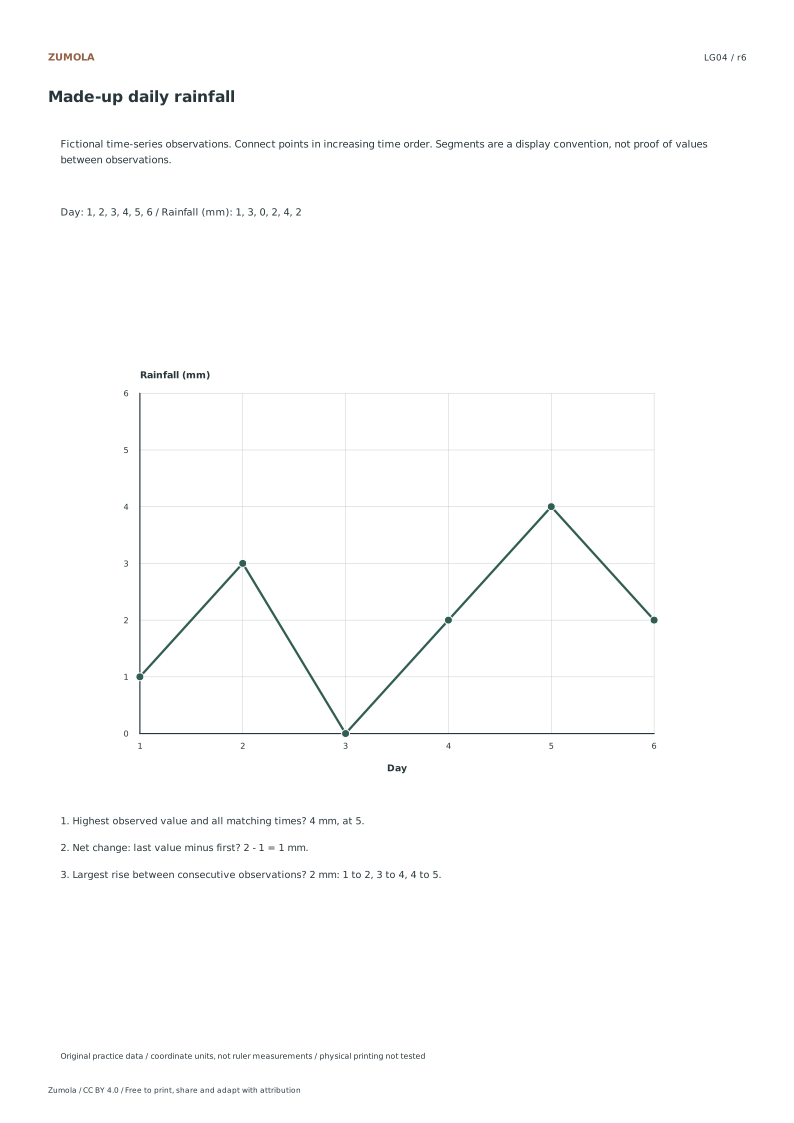
A line graph question often asks for the largest rise. That is a comparison of intervals, not of point heights. For each consecutive pair, subtract the earlier value from the later one. A fall gives a negative change; do not count it as a rise. If two intervals tie, list both rather than picking one.
Net change over the whole record is the last value minus the first, which can differ from the sum of rises because falls cancel part of the gain. Keep the units attached: a change of 4 in a rainfall table measured in millimetres is 4 mm, not 4 hours.
When reading a drawn line, use the axis scale to convert a vertical distance into a value. Count grid steps between labelled ticks, divide the tick difference by the number of steps, and multiply by the steps you measured. Record the assumption that the scale is linear and evenly spaced.
- List consecutive pairs in order.
- Subtract earlier from later for each pair and keep the sign.
- Identify the maximum positive difference and note every tie.
- Compute net change as last minus first.
- Convert grid steps to values using the stated axis scale.
A new worked case with a diagnostic check
The case below is separate from the existing examples. It mixes a rise, a fall and a flat interval so that endpoint reading alone gives the wrong answer. After solving, run the diagnostic: does your largest-rise interval match the subtraction, and does your net change match last minus first? If either fails, the error is usually in sign or in reading the axis backwards.
Art has multiple valid outcomes, so judge the drawing with the rubric rather than expecting one exact picture. A tidy graph with correct labels and a defensible scale can look quite different from another student's and still be right.
- Copy the table and mark units on both axes.
- Plot each point at its ordered position.
- Join points in order with straight segments.
- Answer the interval question by subtraction.
- Check the total change and the units before finishing.
Separating practice from answers
Keep the attempt sheet and the reference apart so that reading the answer does not replace the reasoning. A useful self-check is to write the subtraction for each interval before looking at any supplied answer. If your interval list disagrees, find the first pair where the signs diverge; that locates the mistake faster than re-reading the whole graph.
For printing, check a calibration bar at 100% before trusting measured distances on paper. A shrunken print changes apparent slopes even when the numbers are unchanged.
- Complete all subtractions on the attempt sheet first.
- Compare interval lists and mark the first disagreement.
- Recheck axis direction and units at that pair.
- Print at 100% only after the calibration bar matches.
Try this example
A toy cart's recorded position in metres at 0, 1, 2, 3 and 4 seconds is 2, 6, 5, 9 and 9. Find every interval with the largest rise and the net change from start to finish.
Show the worked explanation
Subtract consecutive values: 6-2=4, 5-6=-1, 9-5=4, 9-9=0. The largest rise is 4 m, occurring in the intervals 0 to 1 s and 2 to 3 s, so both must be listed. The net change is 9-2=7 m, which is less than 4+4 because the fall of 1 m cancels part of the gain. Units stay in metres throughout.
Common mistakes
- Joining category labels with a line, such as fruit names on the x-axis. Use separate bars for categories; reserve lines for ordered values like time or position.
- Reporting the tallest point as the largest rise. Subtract each earlier value from the next and compare the differences, including ties.
- Summing bin frequencies that do not equal the stated total. Recount each bin, confirm boundary rules, and correct the table before drawing.
Check your work
- Axes are labelled with quantity and unit, and the scale is evenly spaced.
- Points are plotted at their ordered positions and joined in sequence.
- Largest-rise answers show subtraction for each interval and include all ties.
- Net change is computed as last minus first with units stated.
- Frequency totals match the stated sample size, and any bin or quartile rule is declared.
- The drawing is legible, with readable labels and margins, and judged against these criteria rather than one exact picture.
Questions before you start
When should I use a histogram instead of a line graph?
Use a histogram when values are grouped into adjacent bins of continuous measurements and you want frequencies. Use a line graph when each point is a reading at an ordered position such as time.
How do I handle a tie for the largest rise?
List every interval with the same maximum positive difference. A tie is a complete answer, not an error to resolve by choosing one.
Why do quartile answers differ between worksheets?
Different conventions split the ordered data differently. State the rule you use, such as median of the lower half for an even count, so the answer can be checked.