Graphing quadratics. Find the turn, then the curve.
Plot six parabolas from vertex-form equations. Use the vertex, paired table points and a symmetry line to distinguish shifts, opening direction and relative width.
6 quadratic cases. Vertex + five points + symmetry.
A graph, a task and a worked check
Plot six parabolas from vertex-form equations. Use the vertex, paired table points and a symmetry line to distinguish shifts, opening direction and relative width.
Use the student pack for an attempt, then compare the separate reference or worked answer. Every case is original. All PDF and editable SVG resources are free without signup; each collection pack repeats its individual sheets in the same order.
Choose your paper and download
Download paper size
Every worksheet and answer is free. No signup.
The complete collection
Keep practice and answers separate.
Use the student pack first, then compare the reference or answer. Packs are PDFs; individual sheets below also include editable SVG files. The paper choice applies to every download.
The examples and datasets are made for these worksheets. They are not measured classroom results, published textbook questions or evidence about real people. Axis values and the supplied data determine the answers; paper measurements do not replace those numbers.
Check the first case
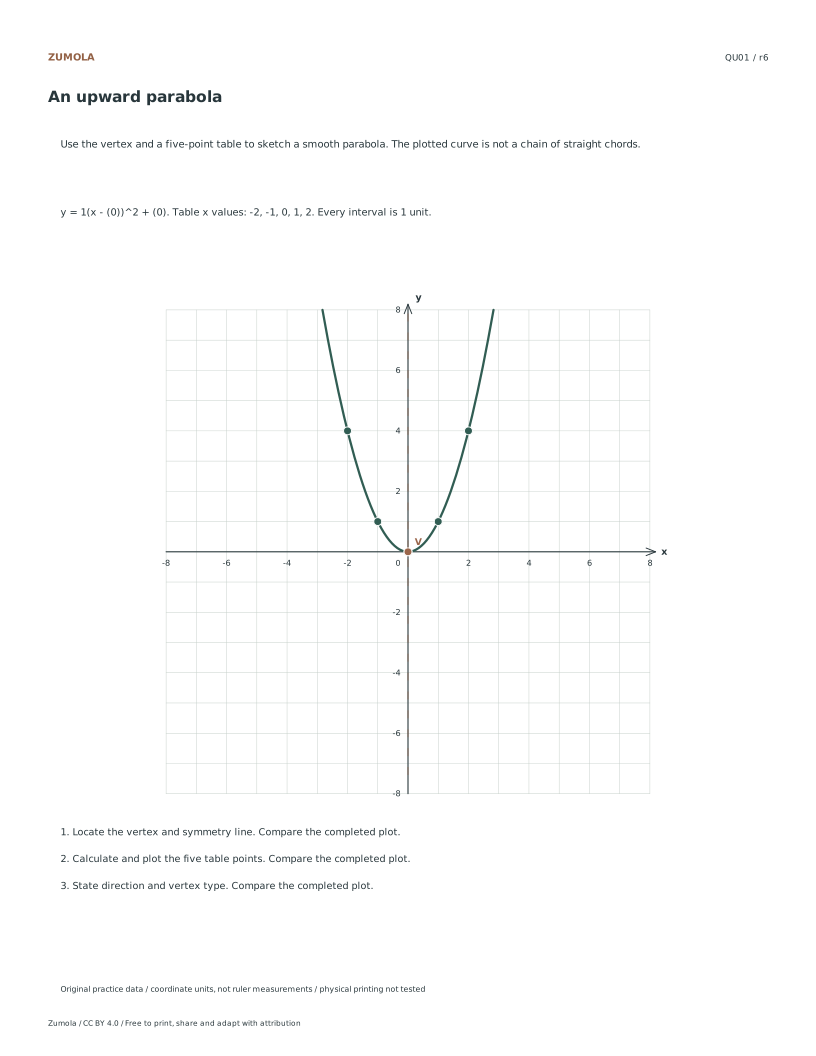
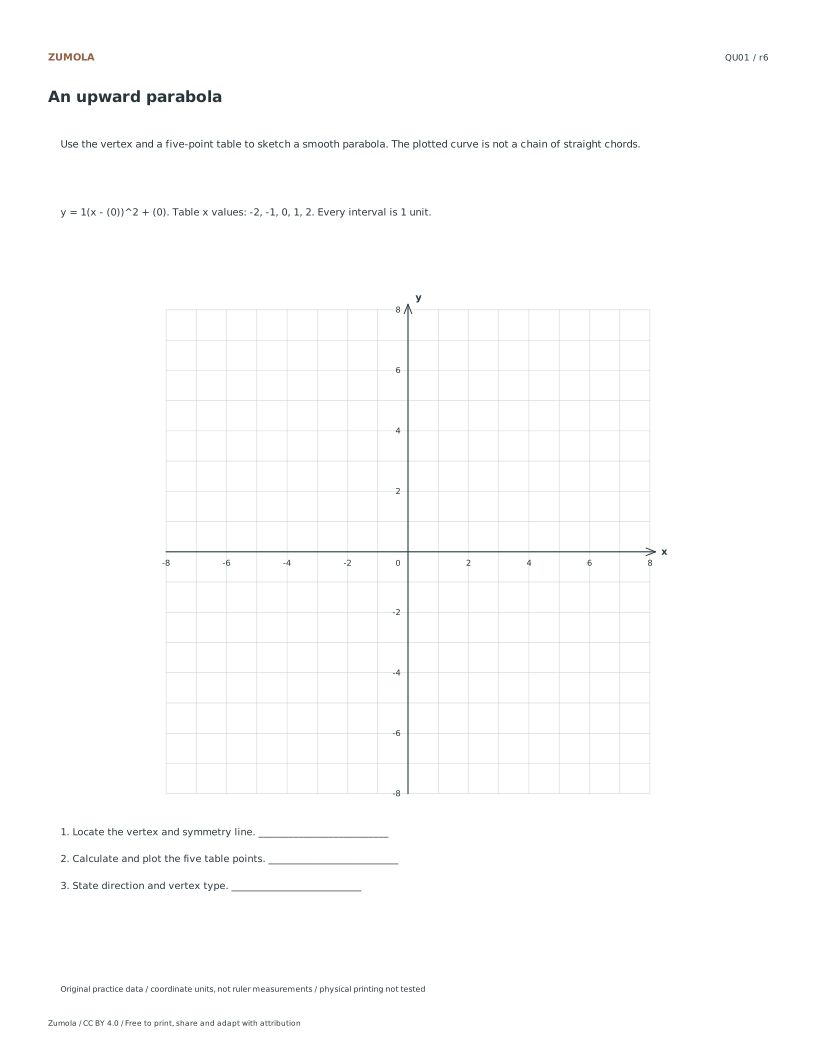
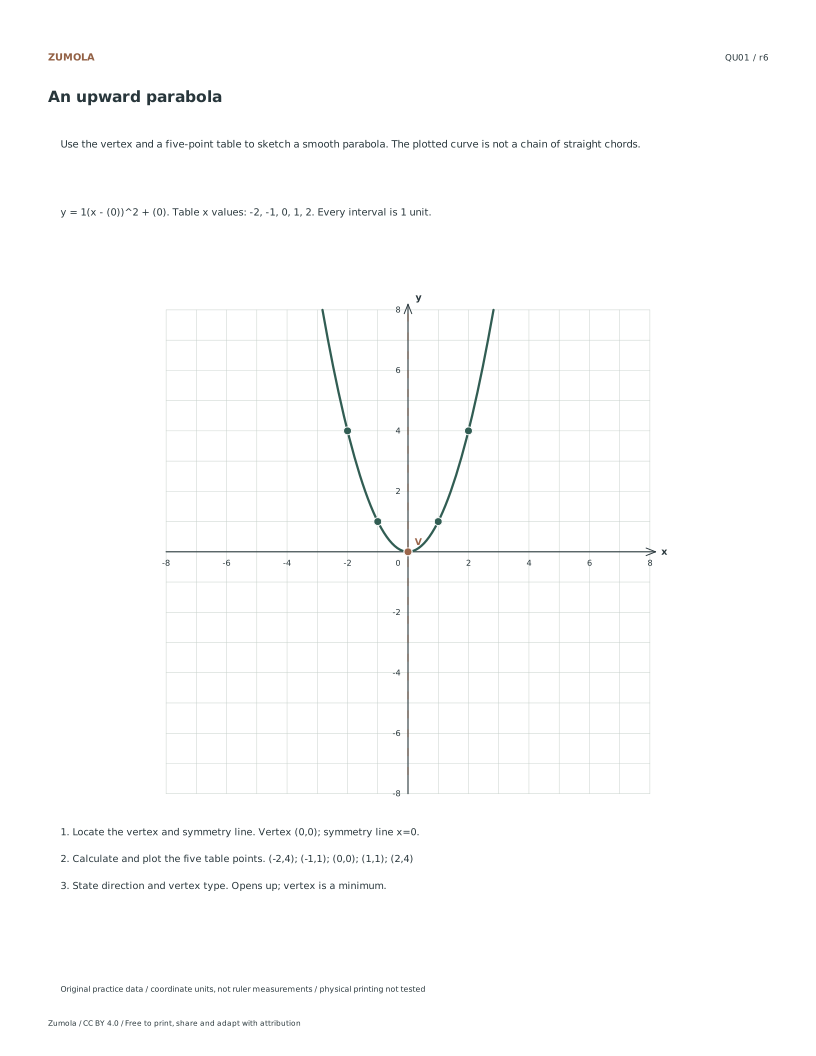
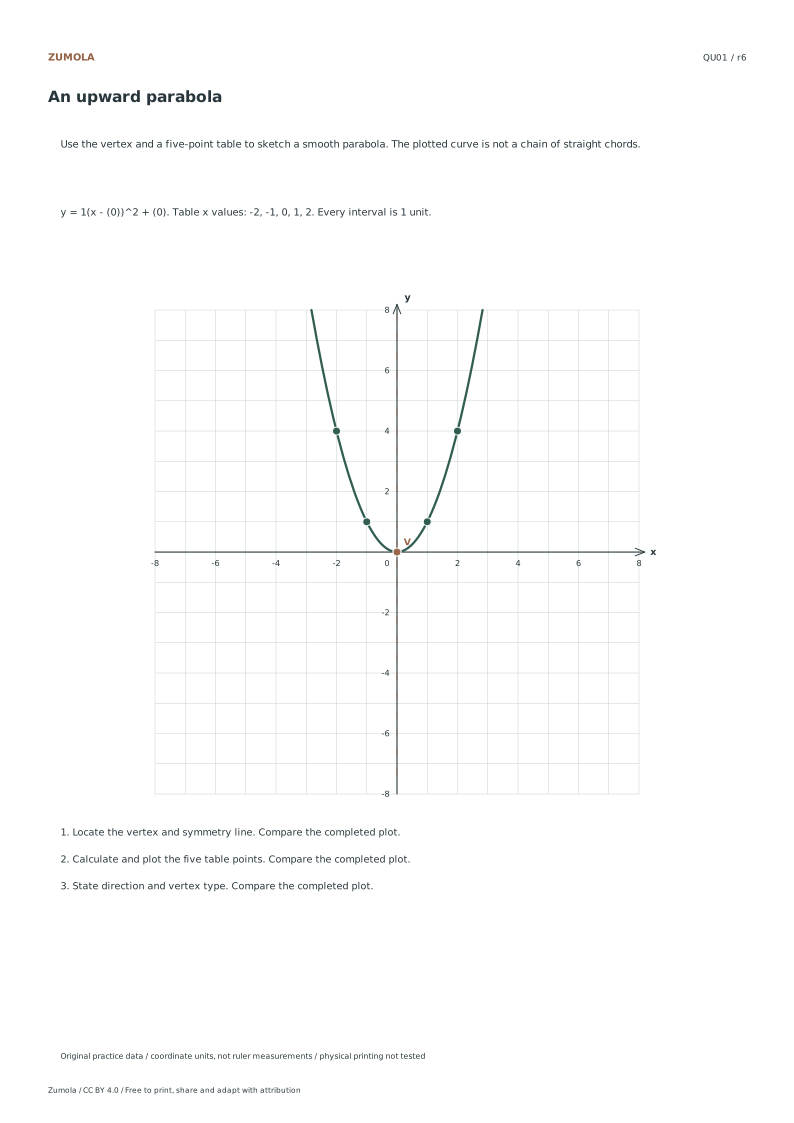
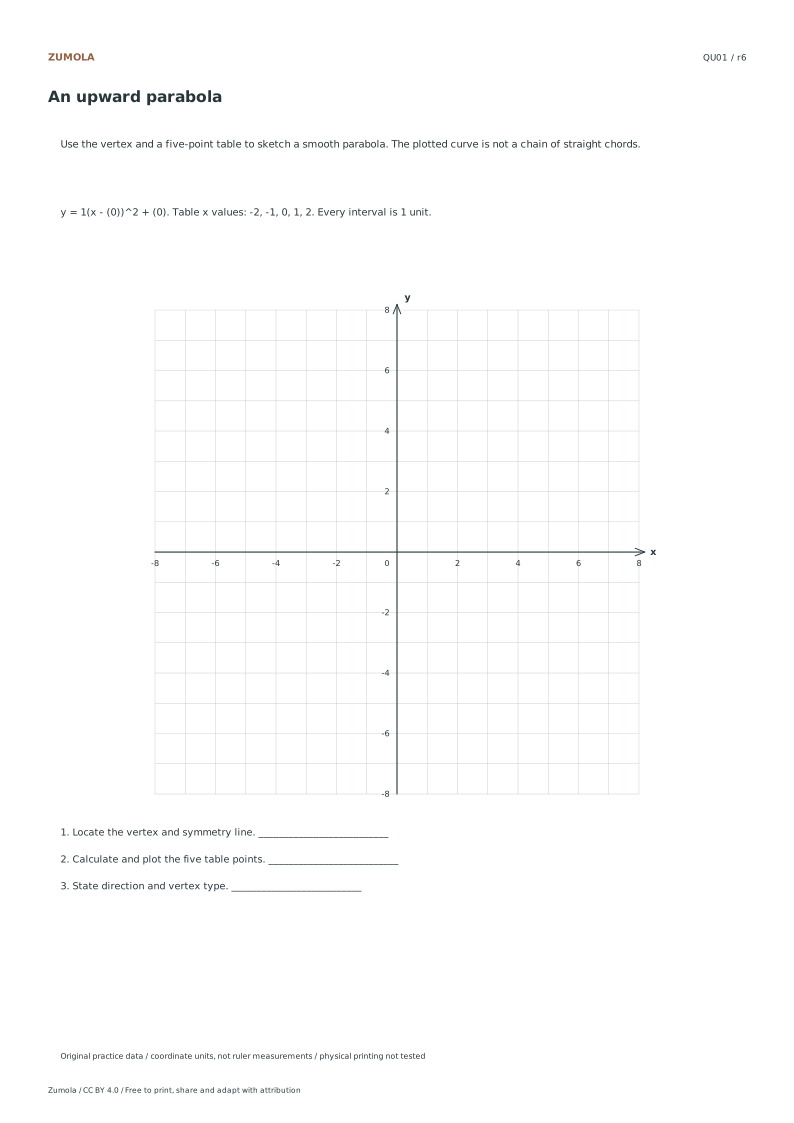
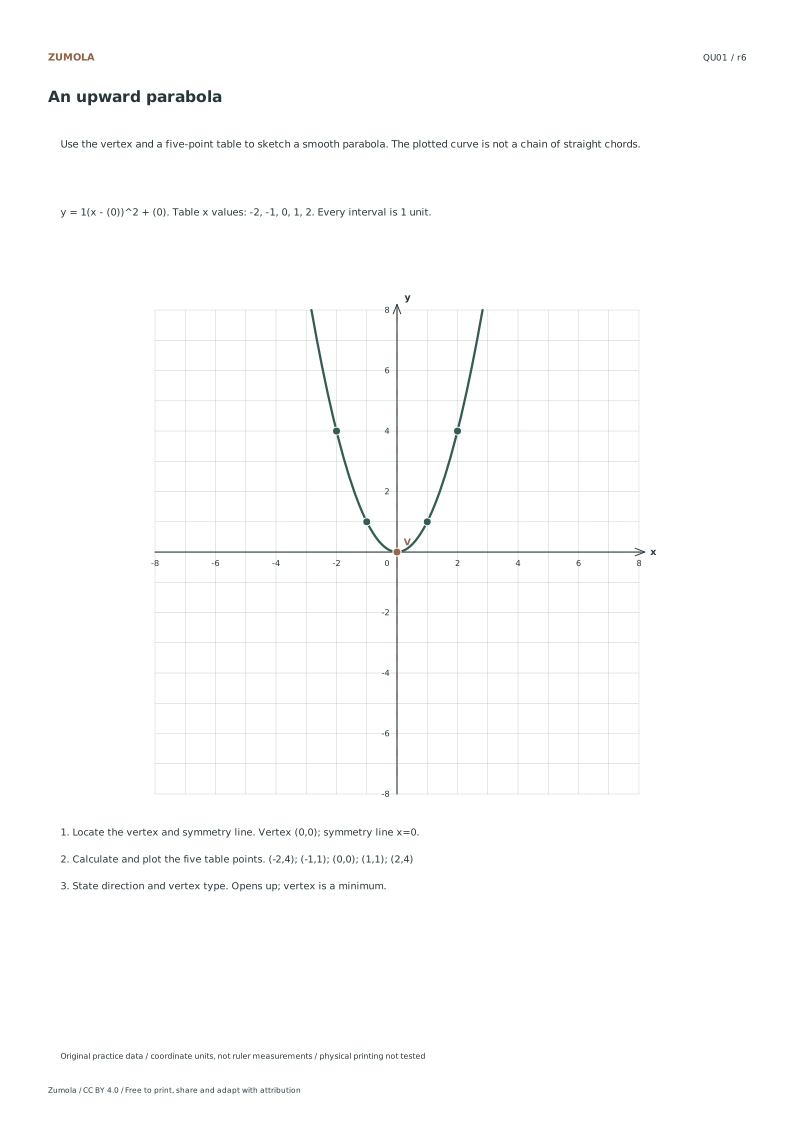
QU01: An upward parabola
Check
Worked result
1
Vertex (0,0); symmetry line x=0.
2
(-2,4); (-1,1); (0,0); (1,1); (2,4)
3
Opens up; vertex is a minimum.
The table gives one worked case so you can check the method. The separate answer files contain the completed plots and results for every case. Use a smooth curve through the samples and compare the vertex and symmetry axis.
Work through the graph
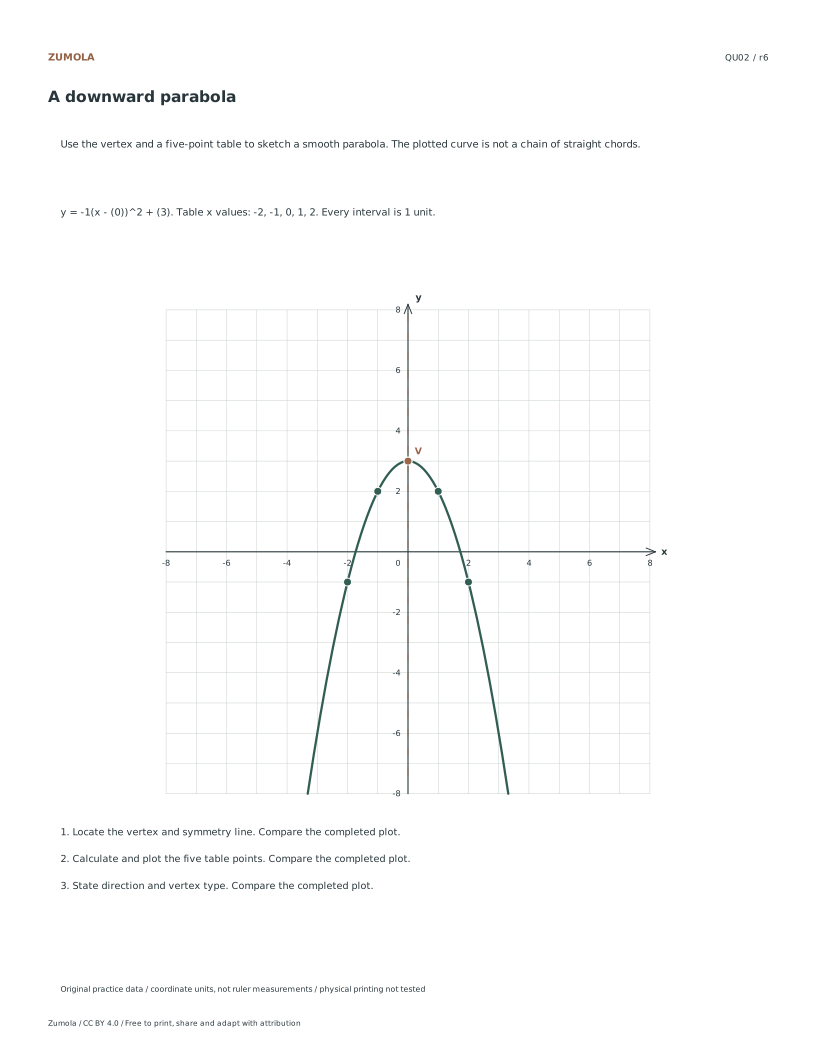
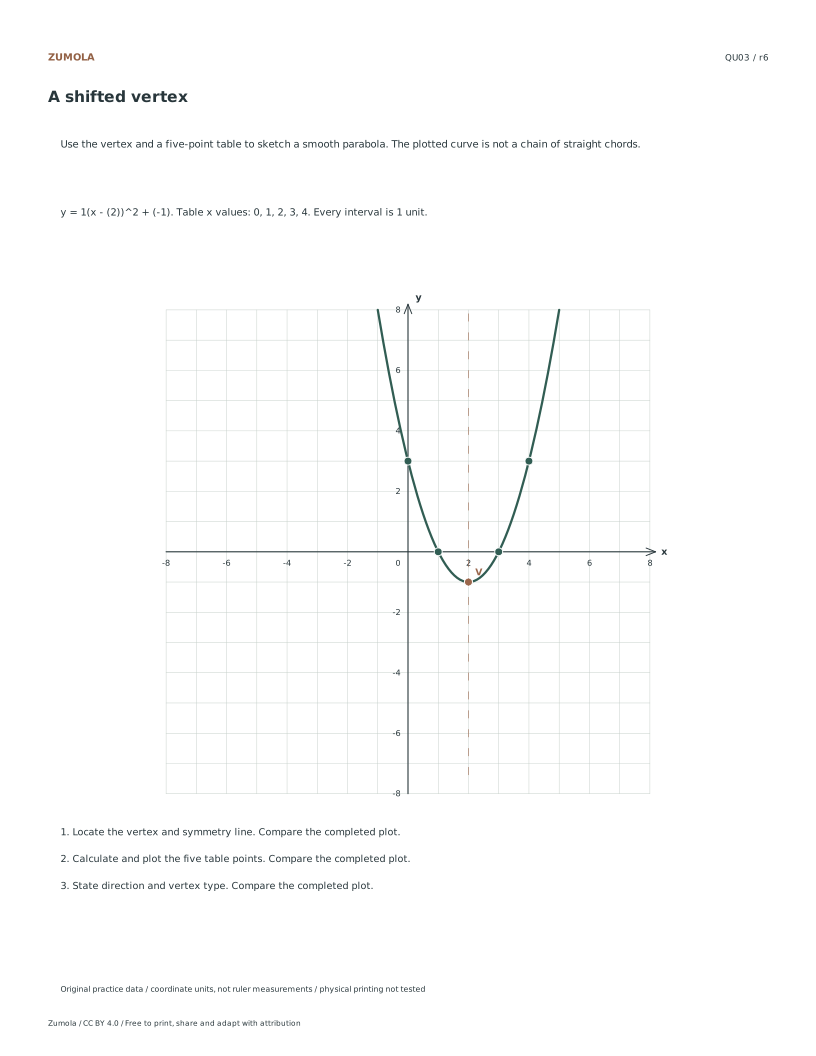
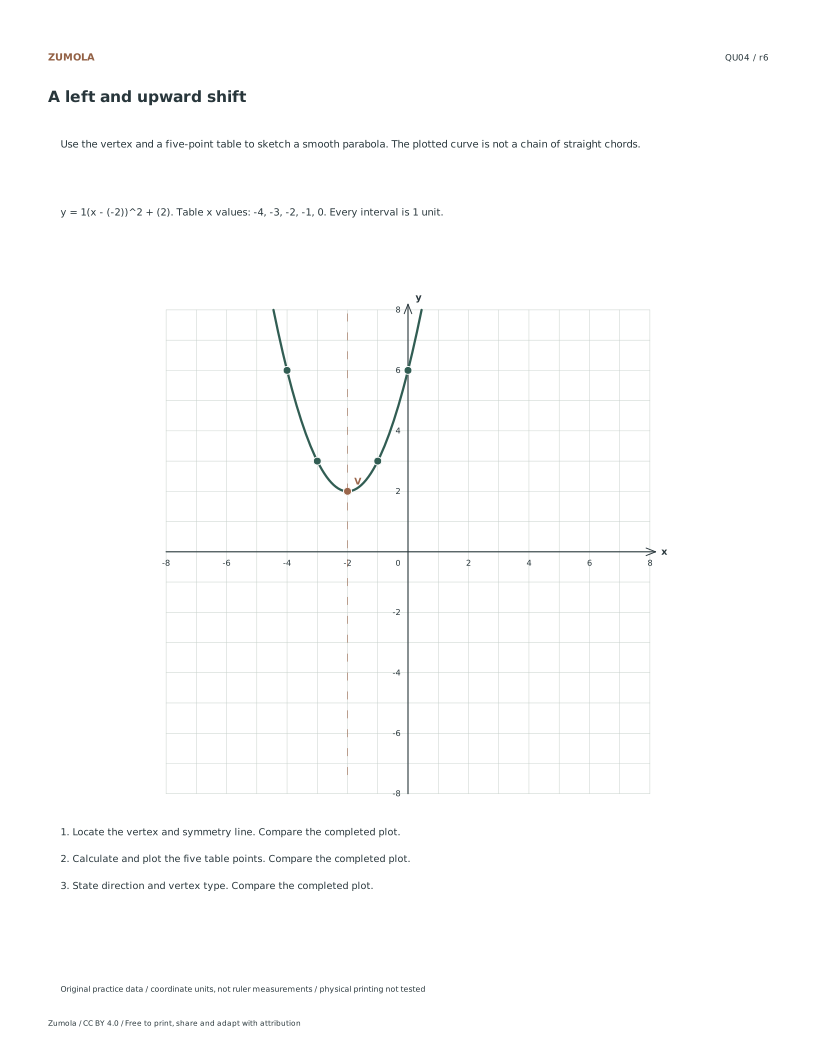
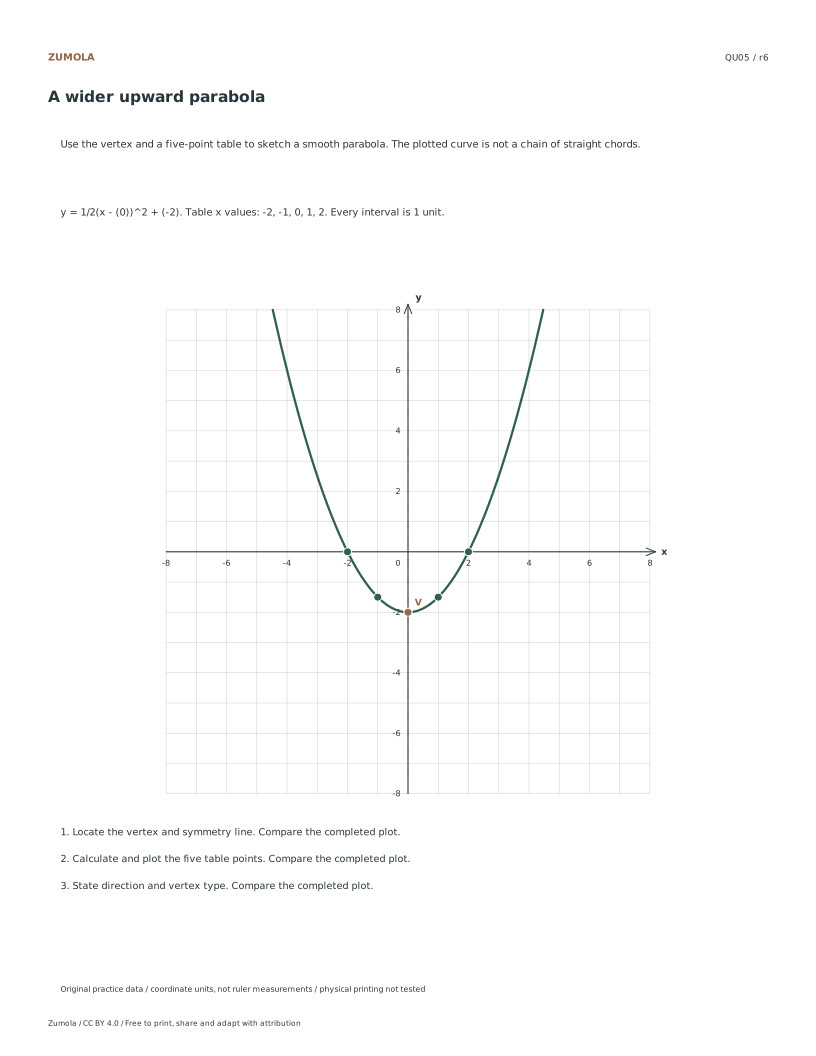
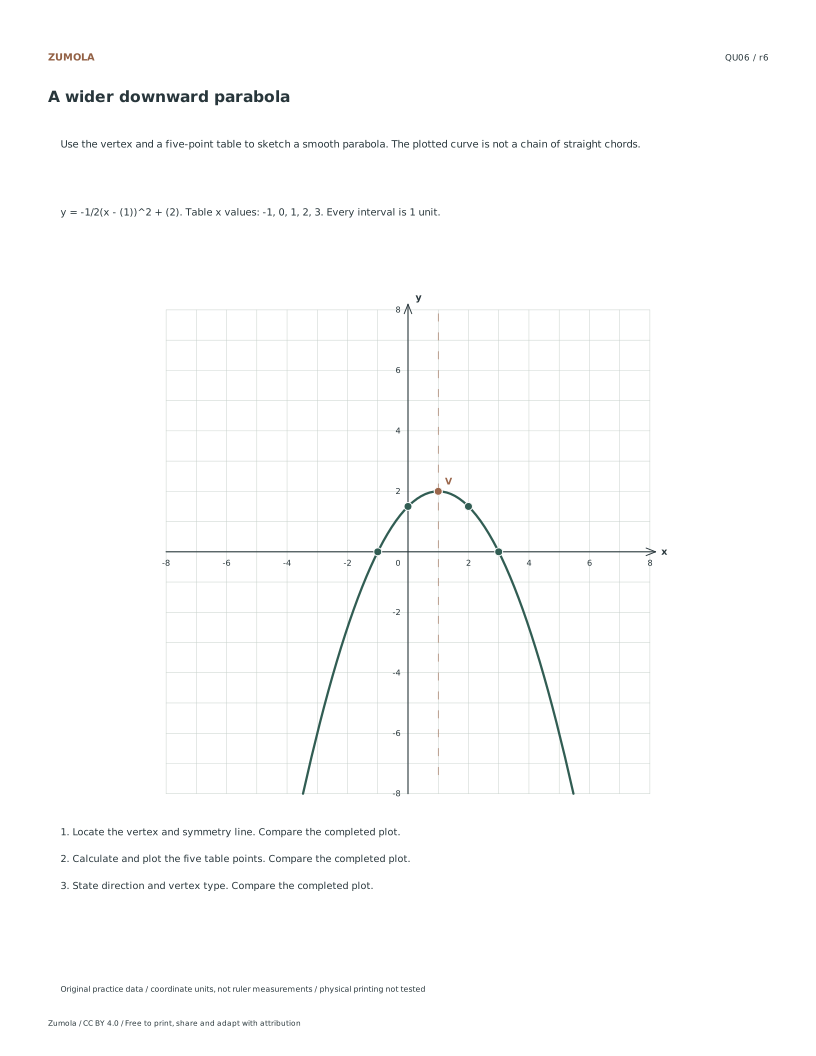
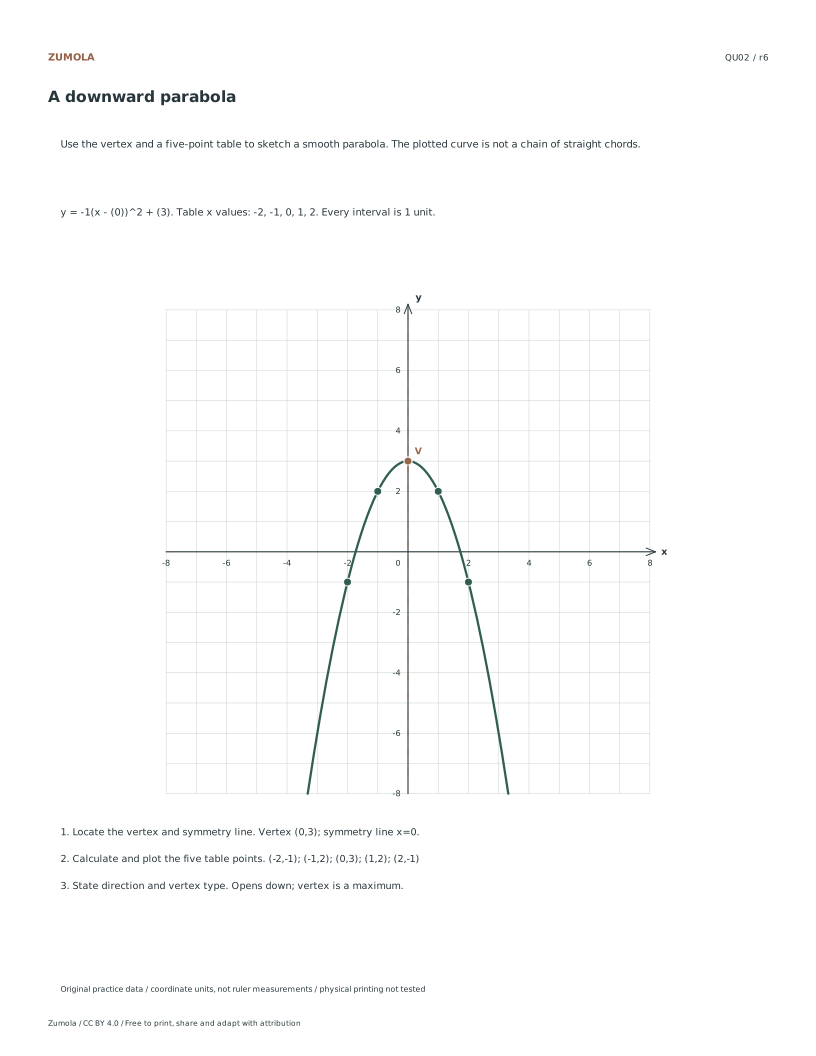
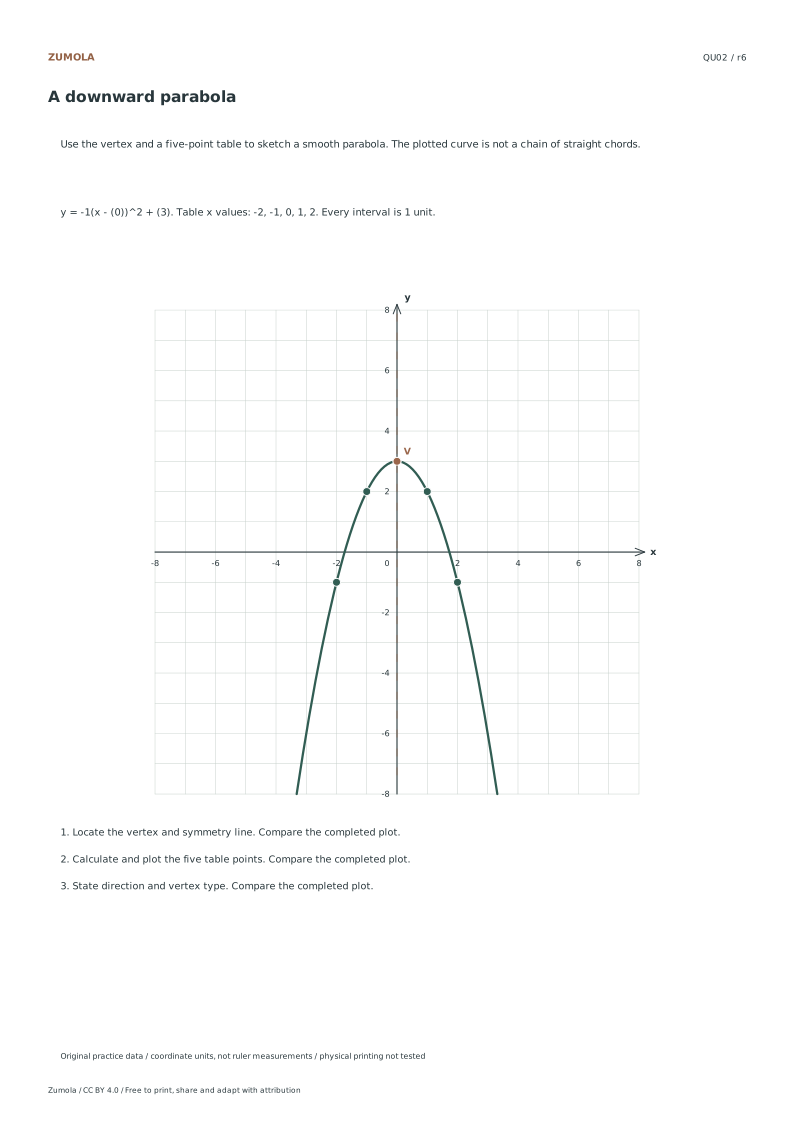
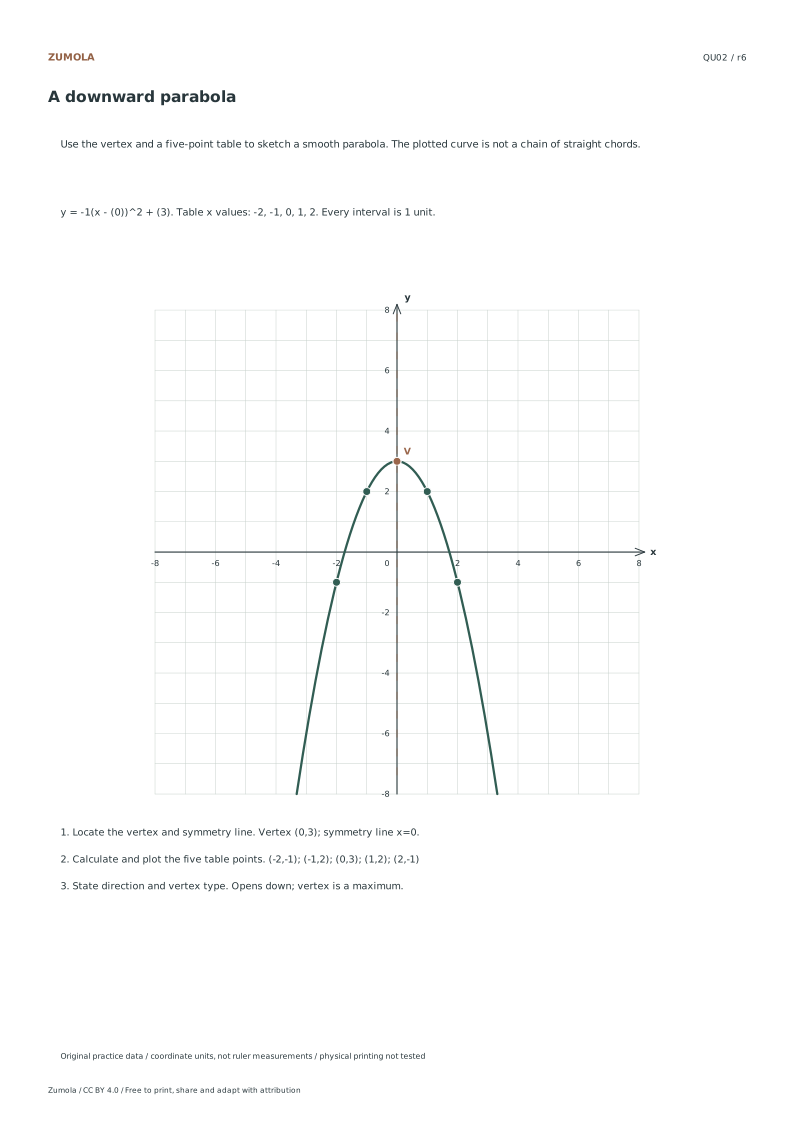
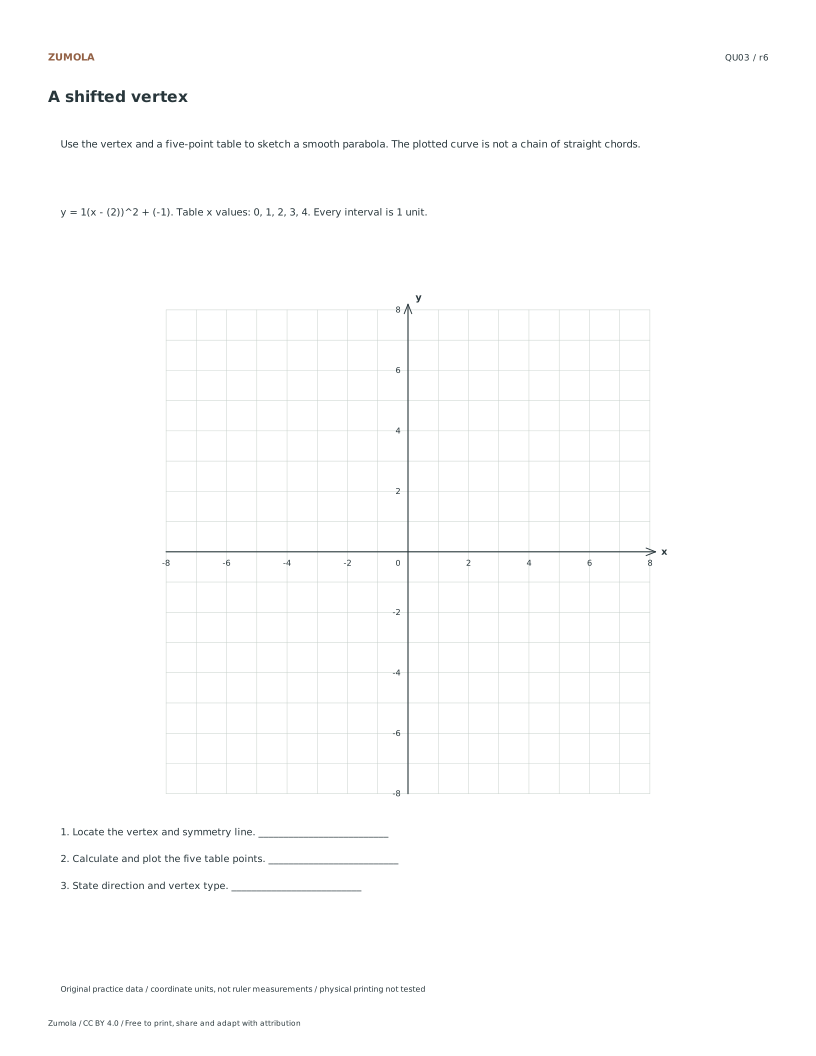
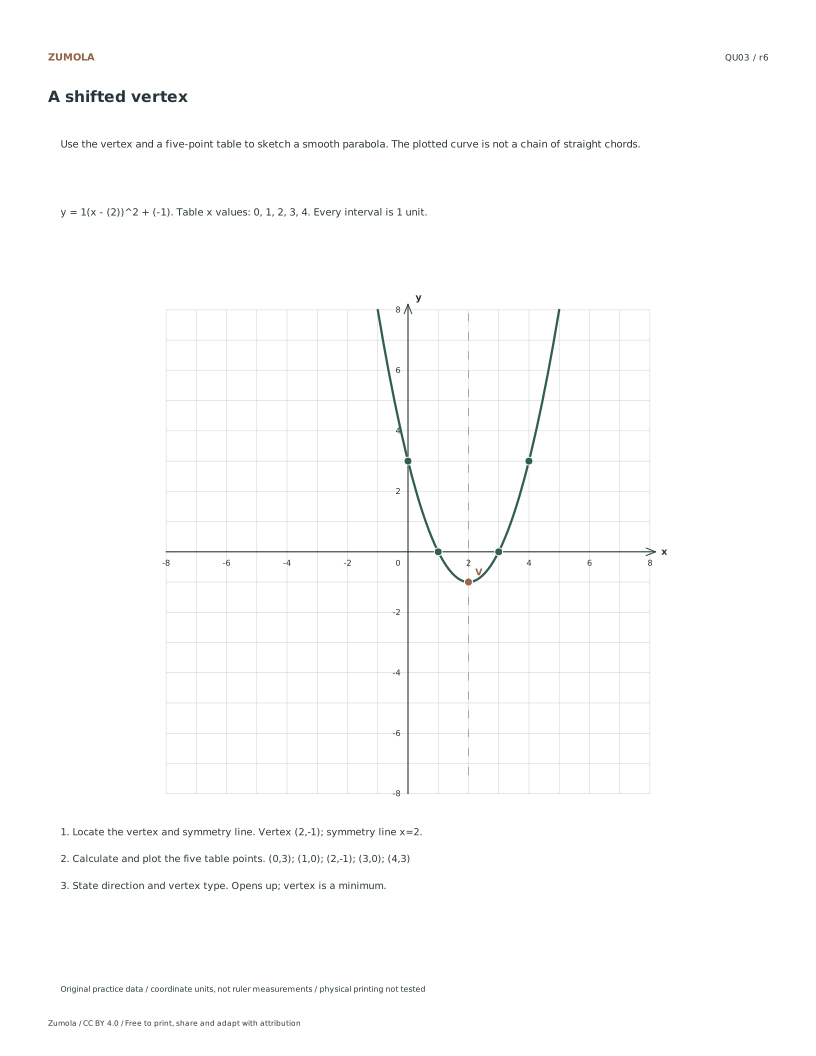
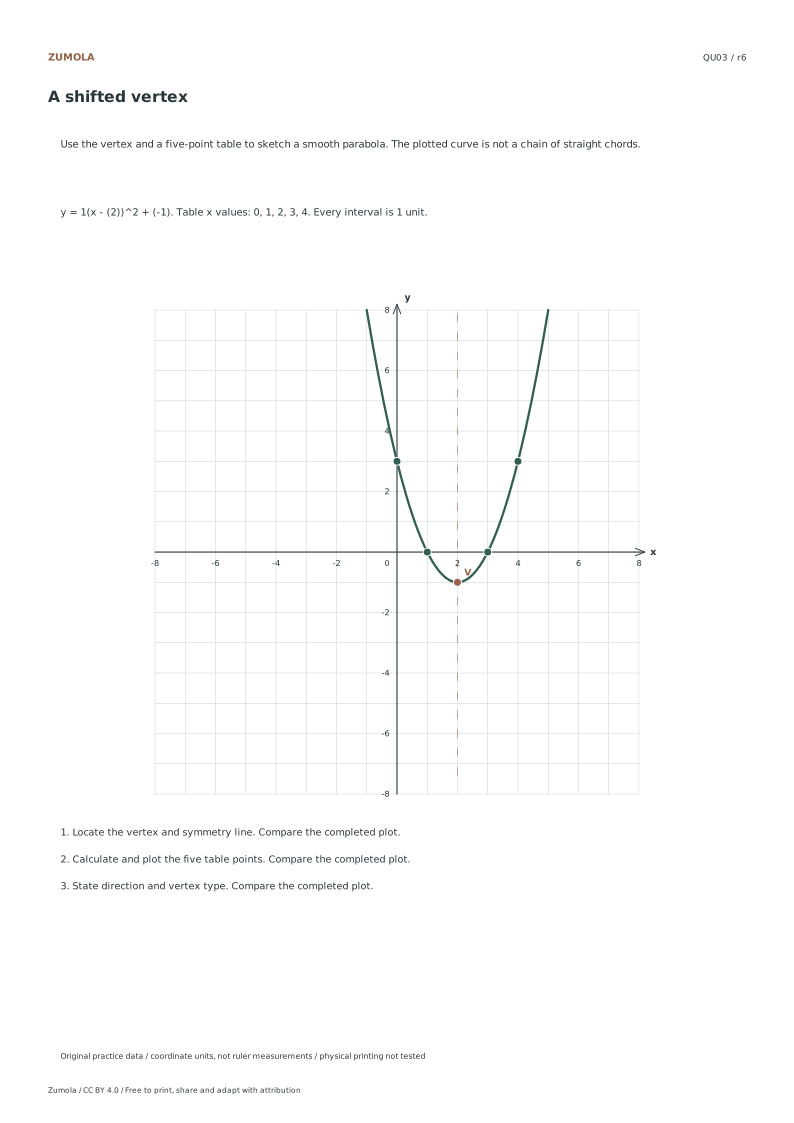
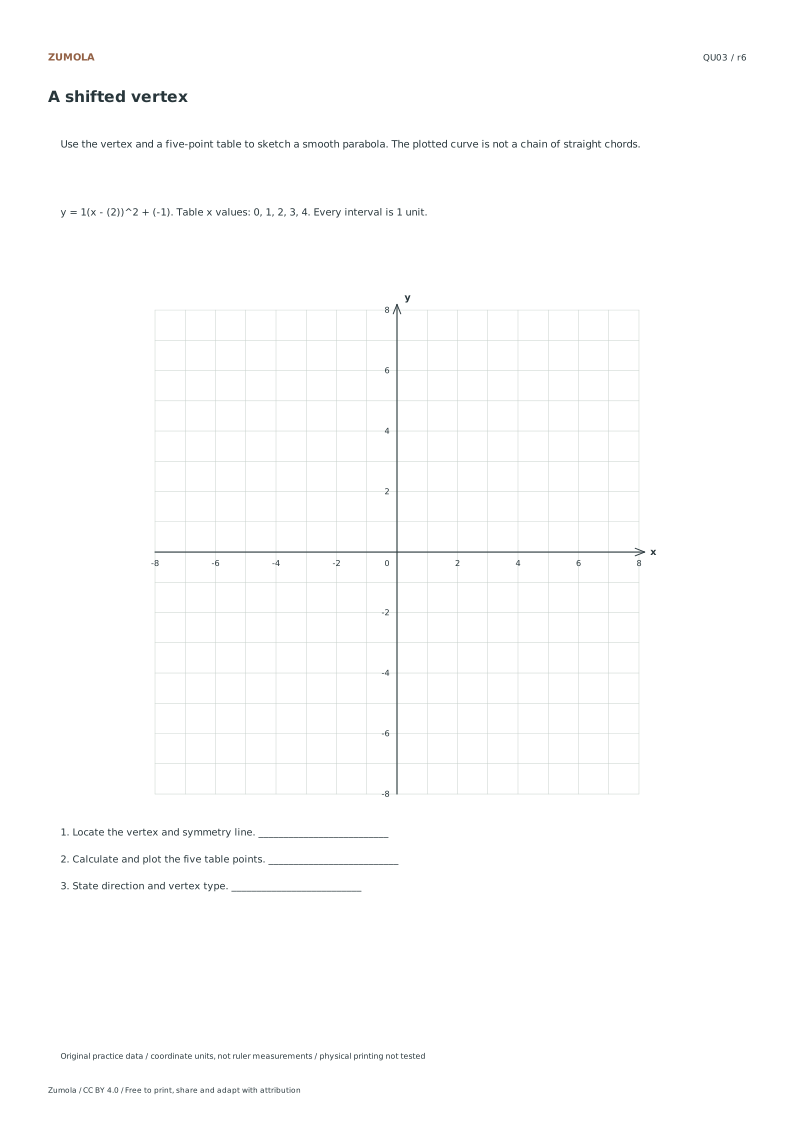
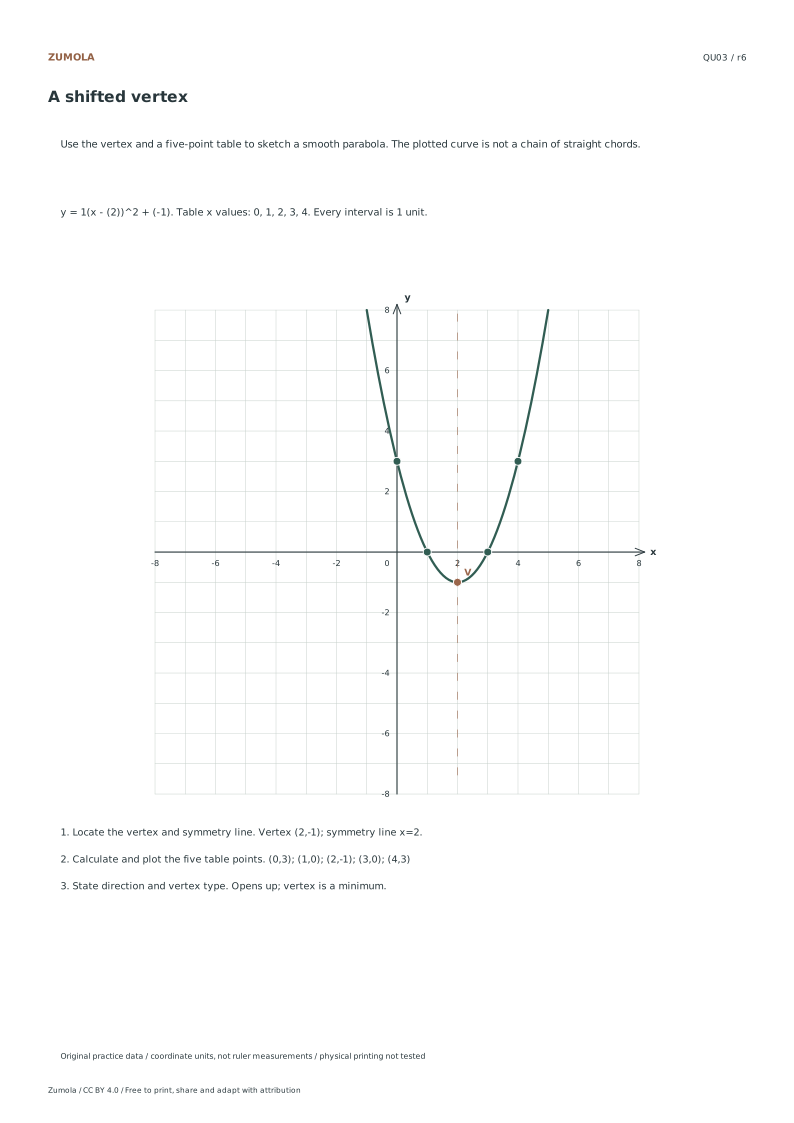
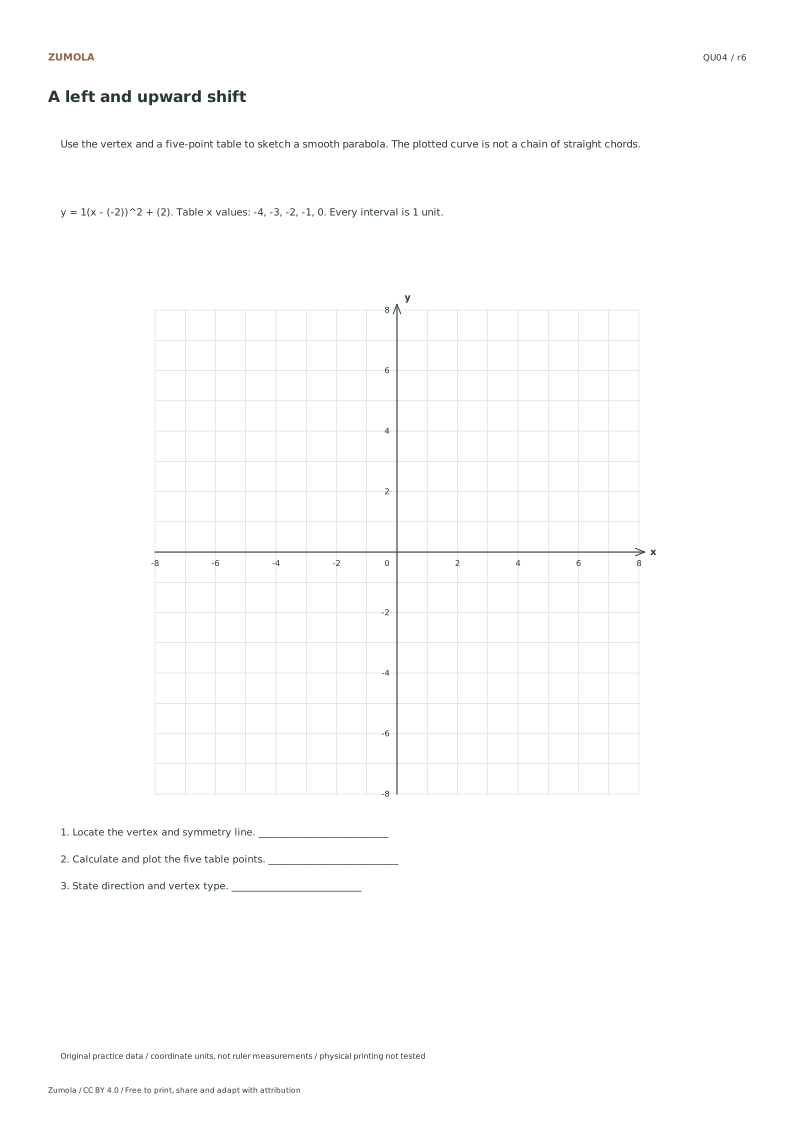
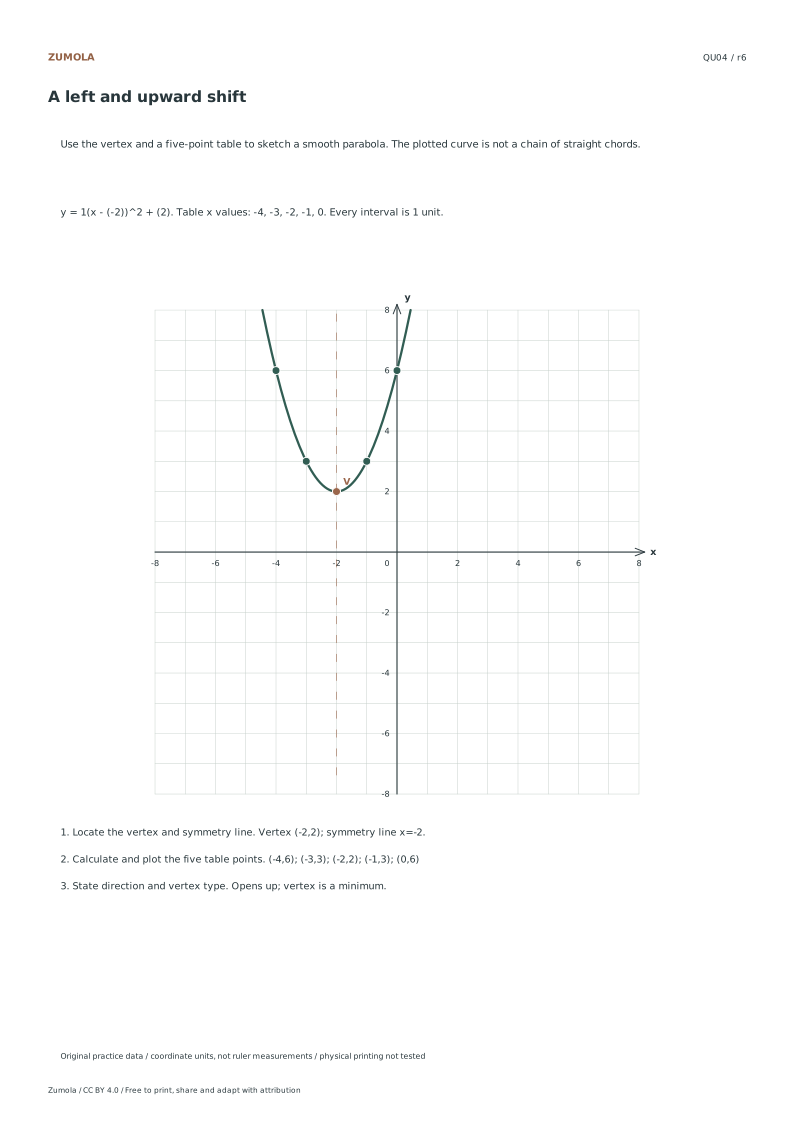
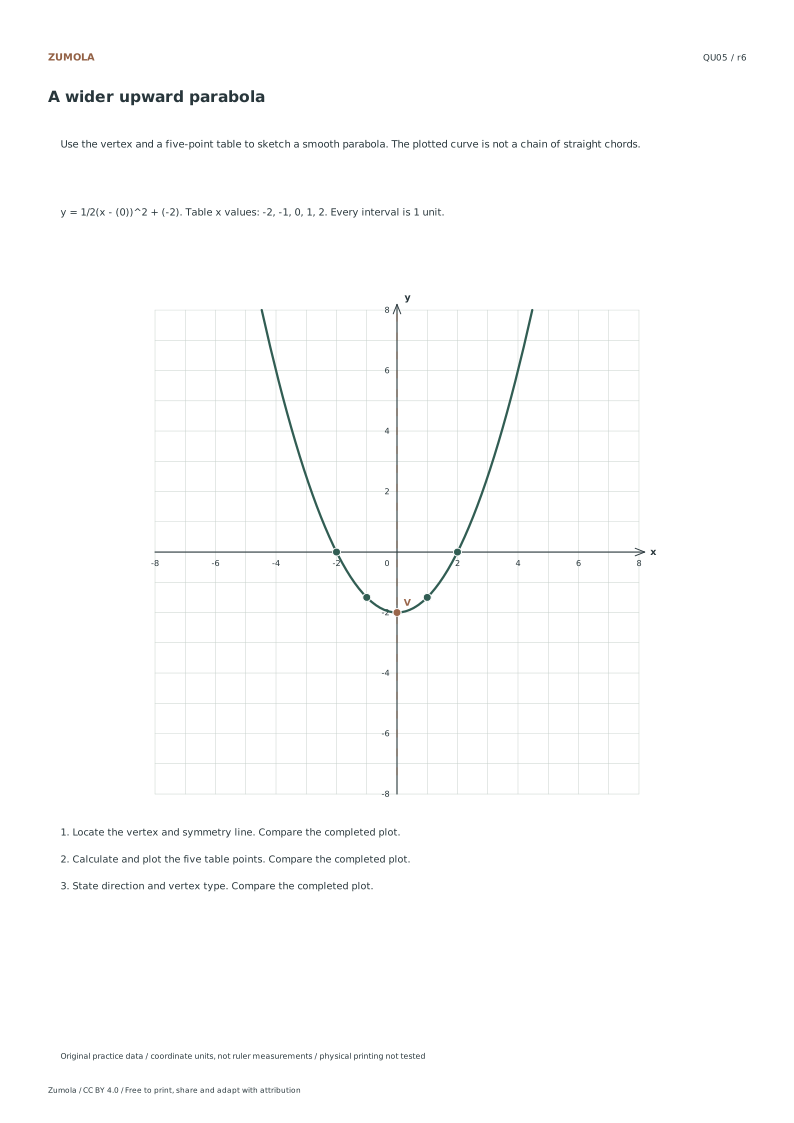
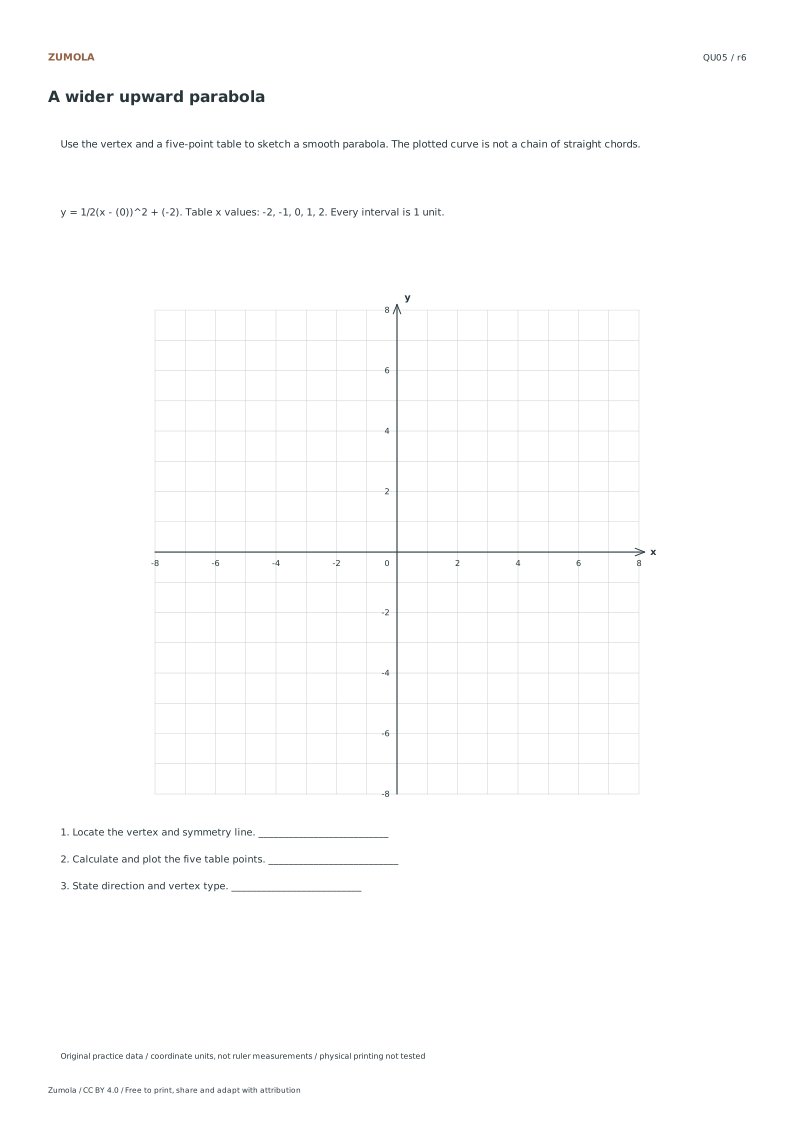
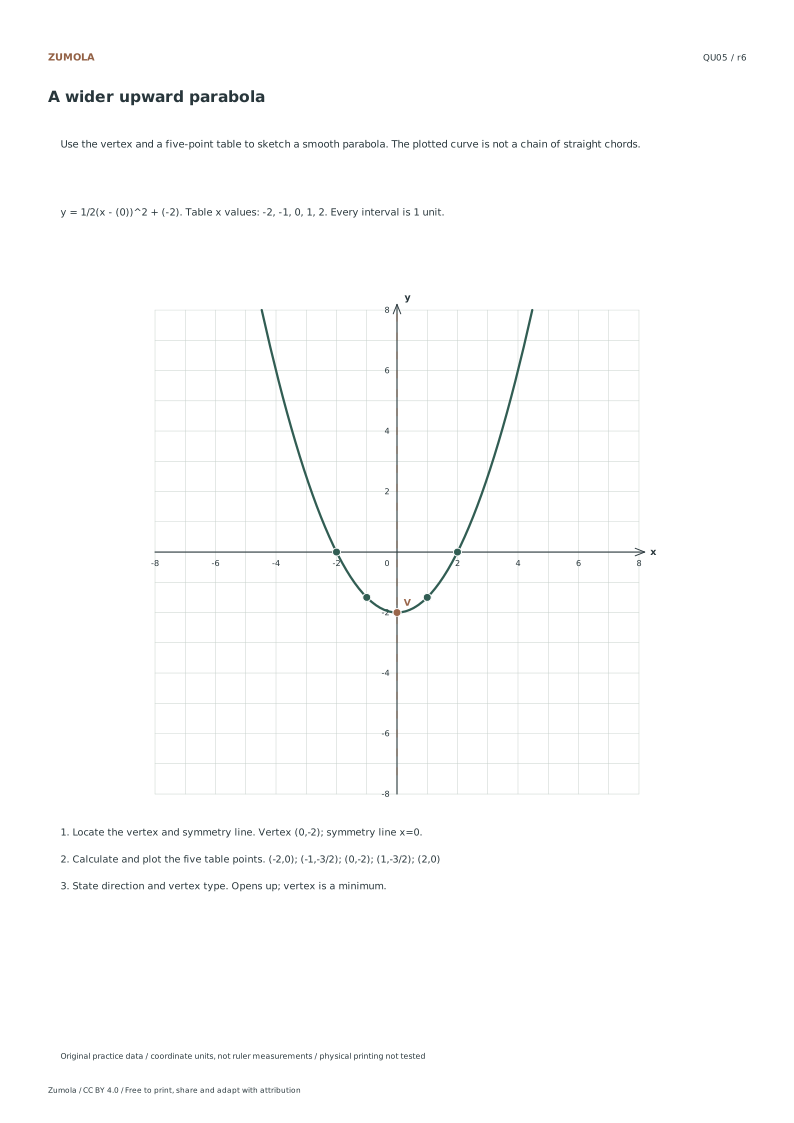
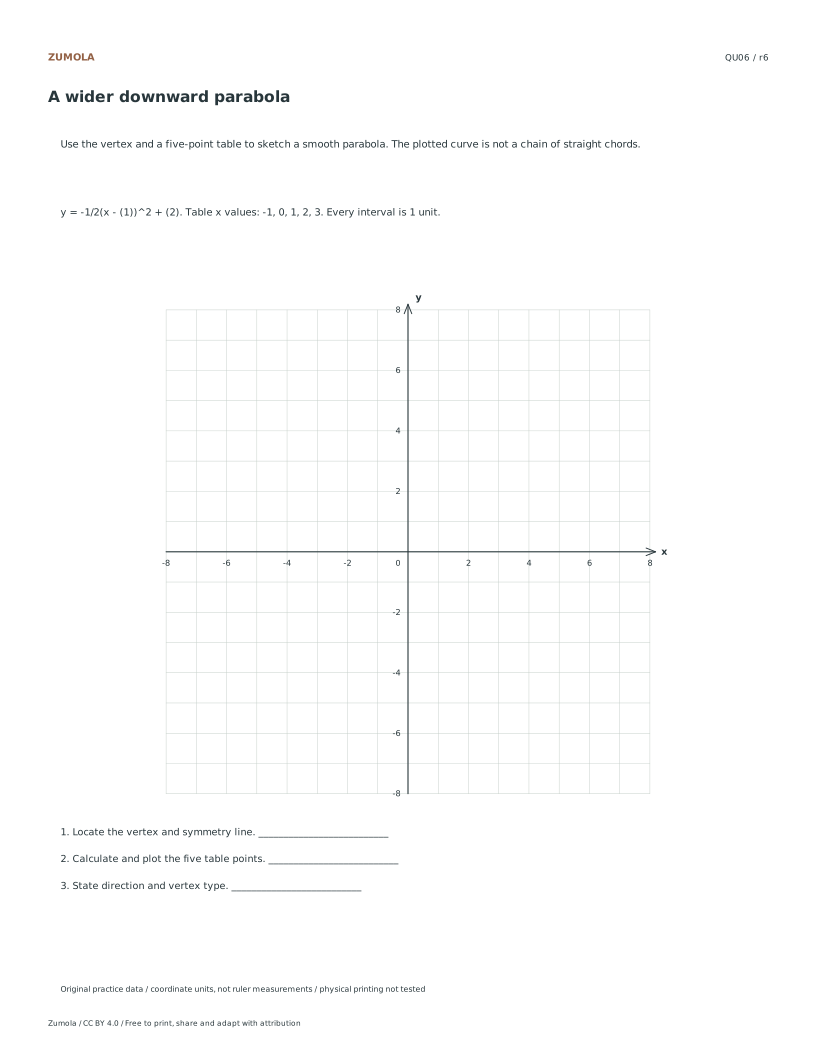
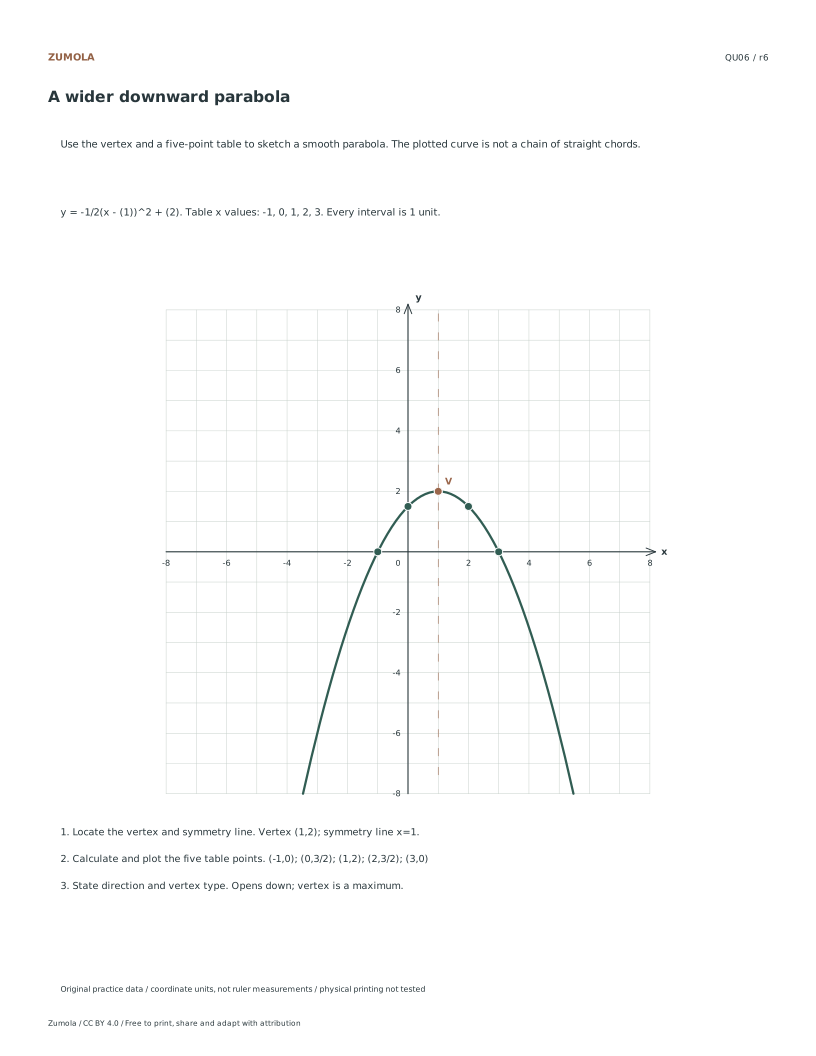
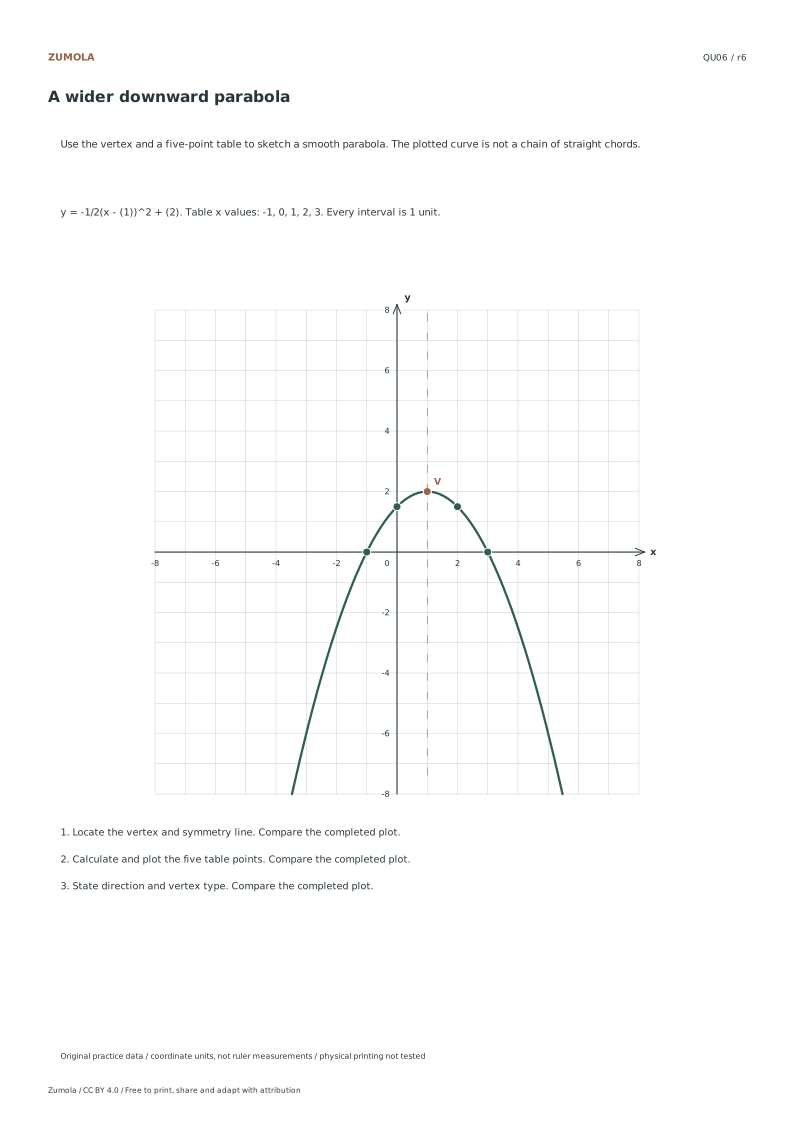
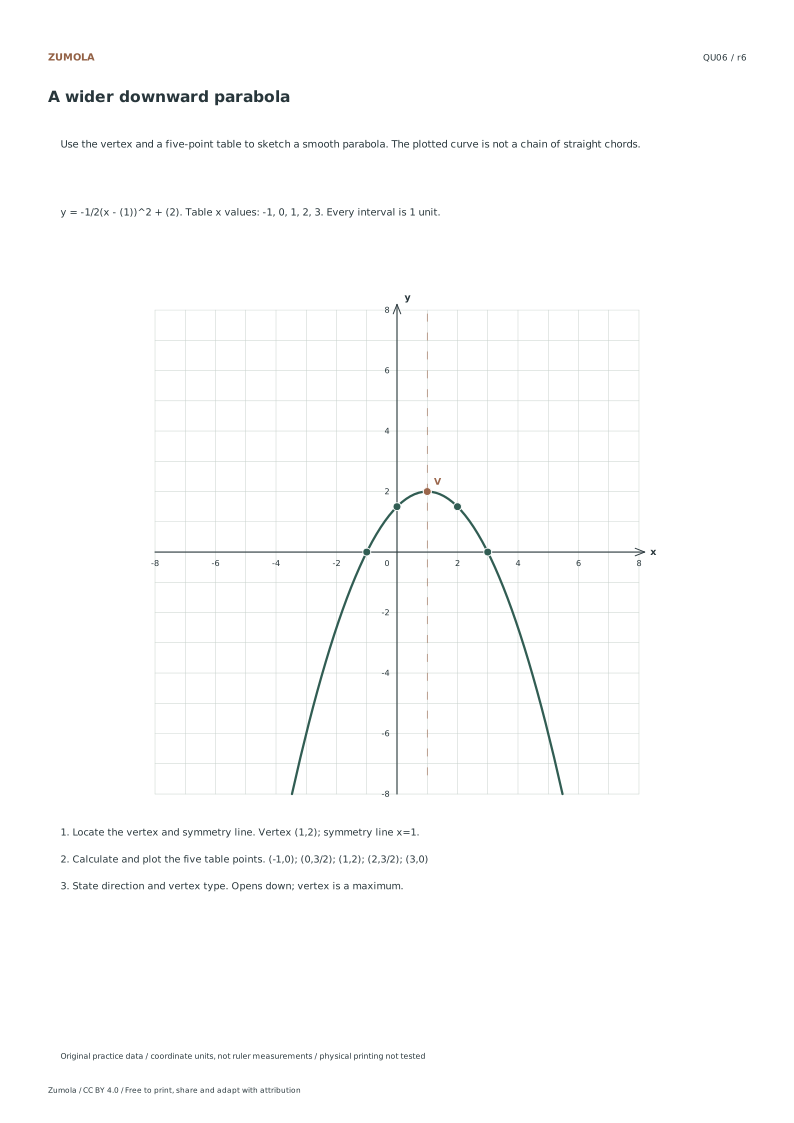
Identifying Vertex and Symmetry Begin by locating the vertex coordinates h and k for each of the six provided quadratic graphs. The vertex represents the turning point of the parabola, defined strictly by the values in the equation y=a(x-h)^2+k. For instance, in case QU03, the vertex sits at two negative one. Once identified, draw the vertical line of symmetry at x equals h. This line divides the parabola into two mirror images. Ensure you distinguish between upward opening curves where a is positive and downward opening curves where a is negative, as this orientation dictates the shape relative to the vertex.
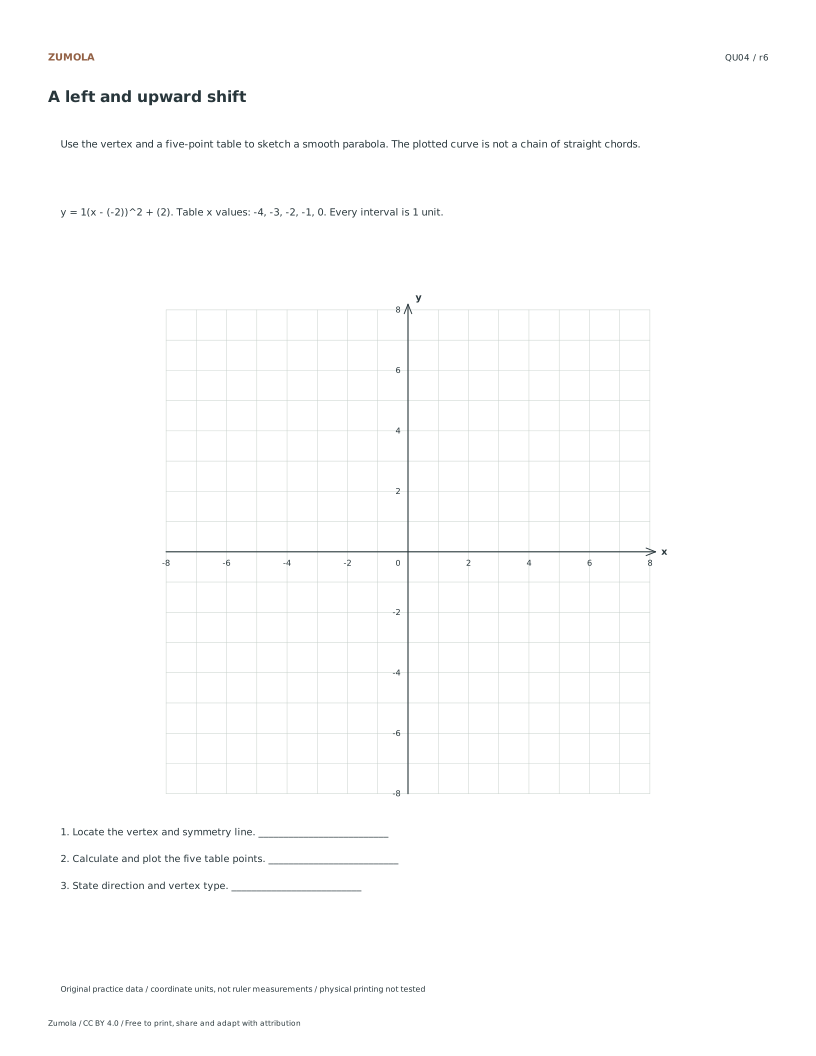
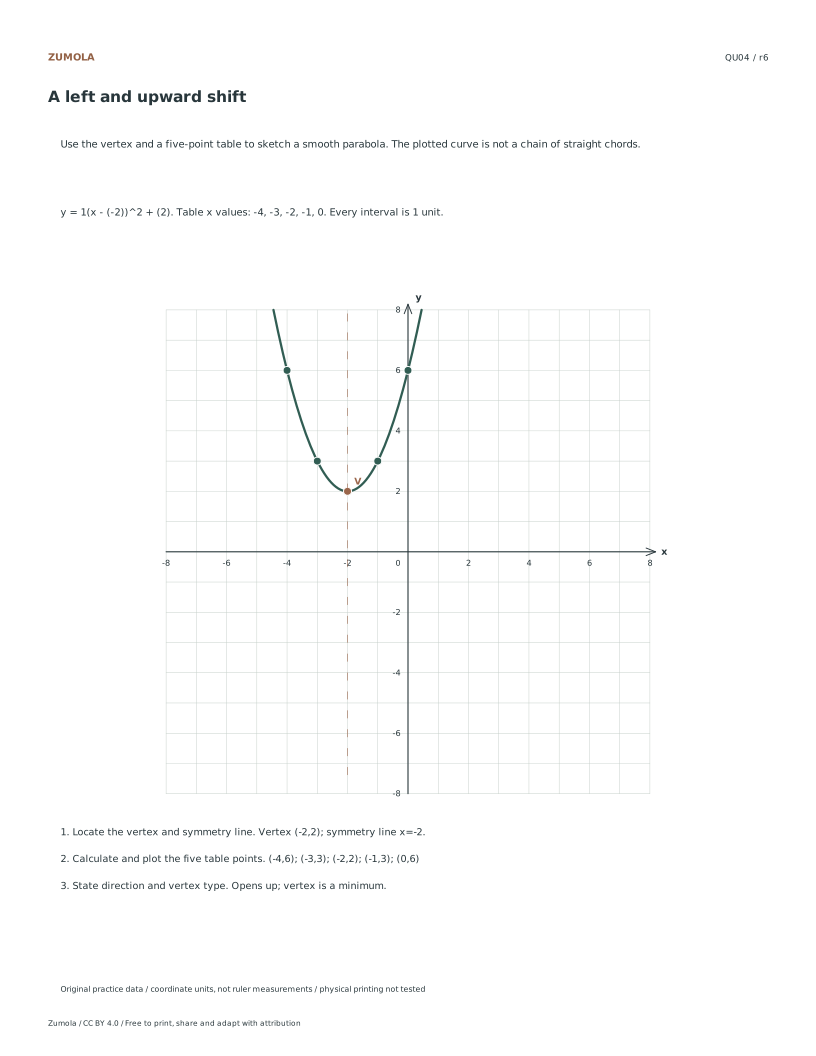
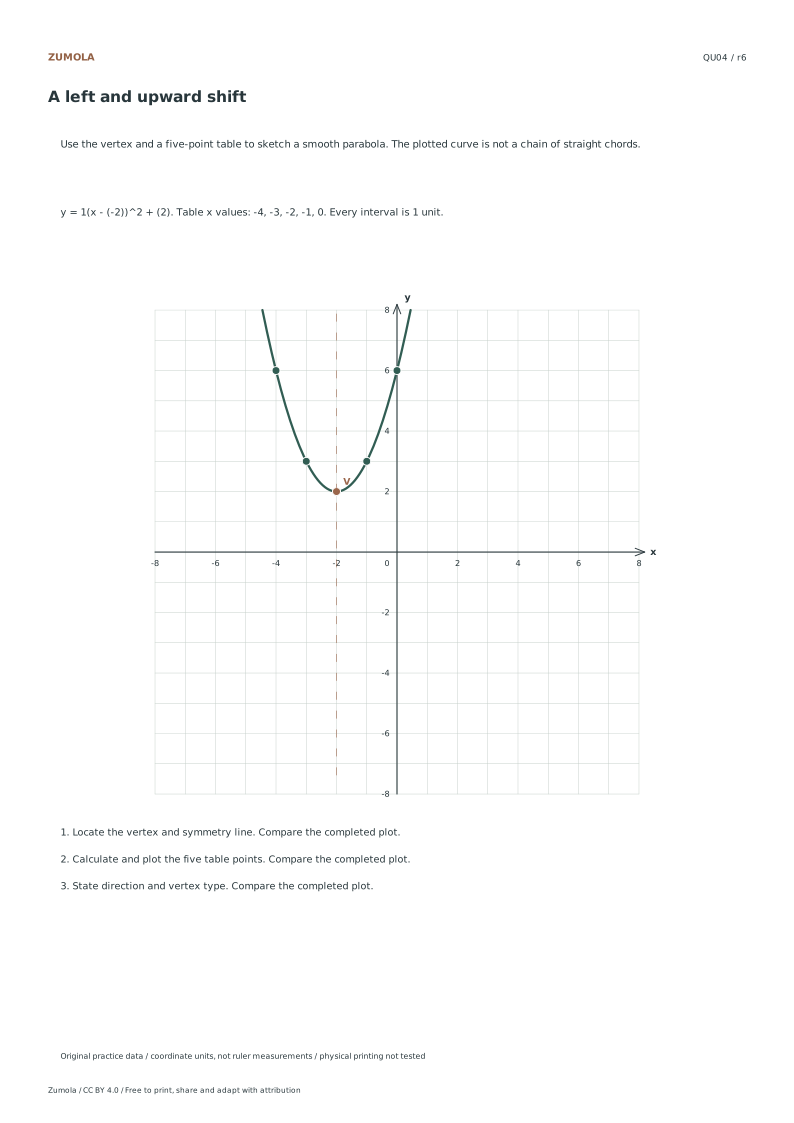
Plotting Table Inputs Correctly Use the five specific input values h minus two, h minus one, h, h plus one, and h plus two to generate coordinate points. Calculate the corresponding y values for each x input using the given quadratic formula. Plot these five points on the grid. Crucially, connect these points with a smooth parabola rather than straight line segments between each dot. This smooth curve reflects the continuous nature of the quadratic function. The axis units and plotting determine the final answer, so rely on the calculated coordinates rather than attempting to measure distances with a physical ruler on the printed page.
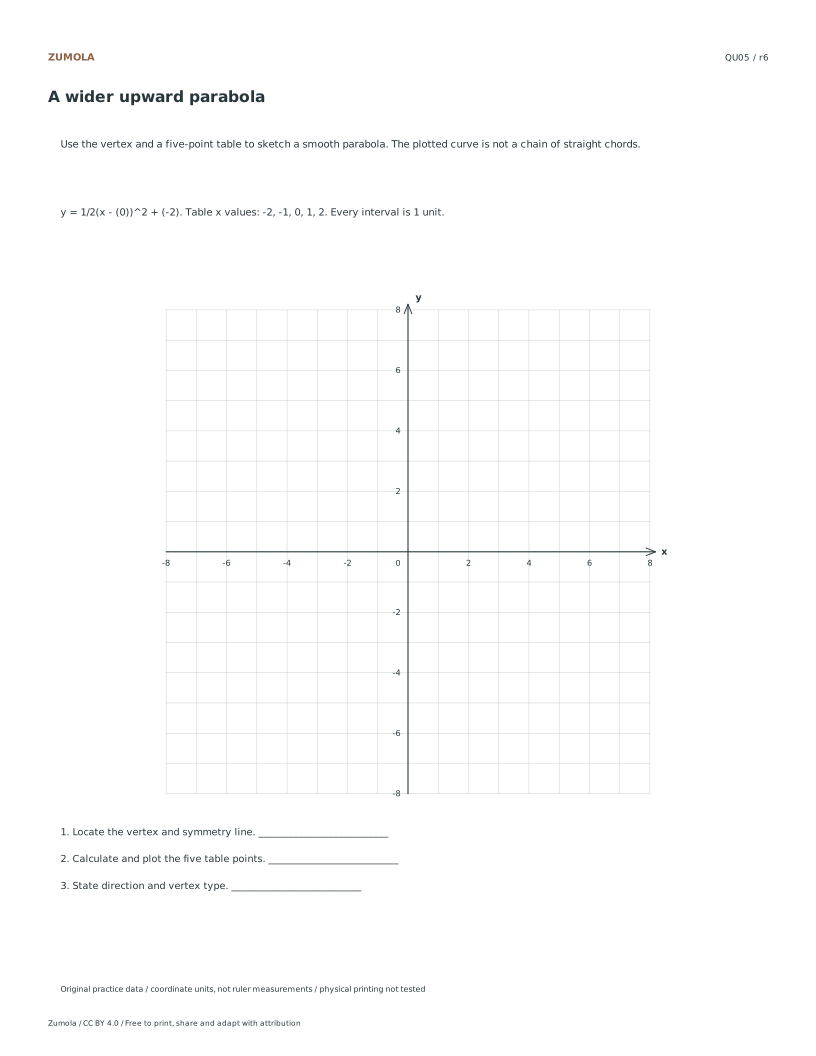
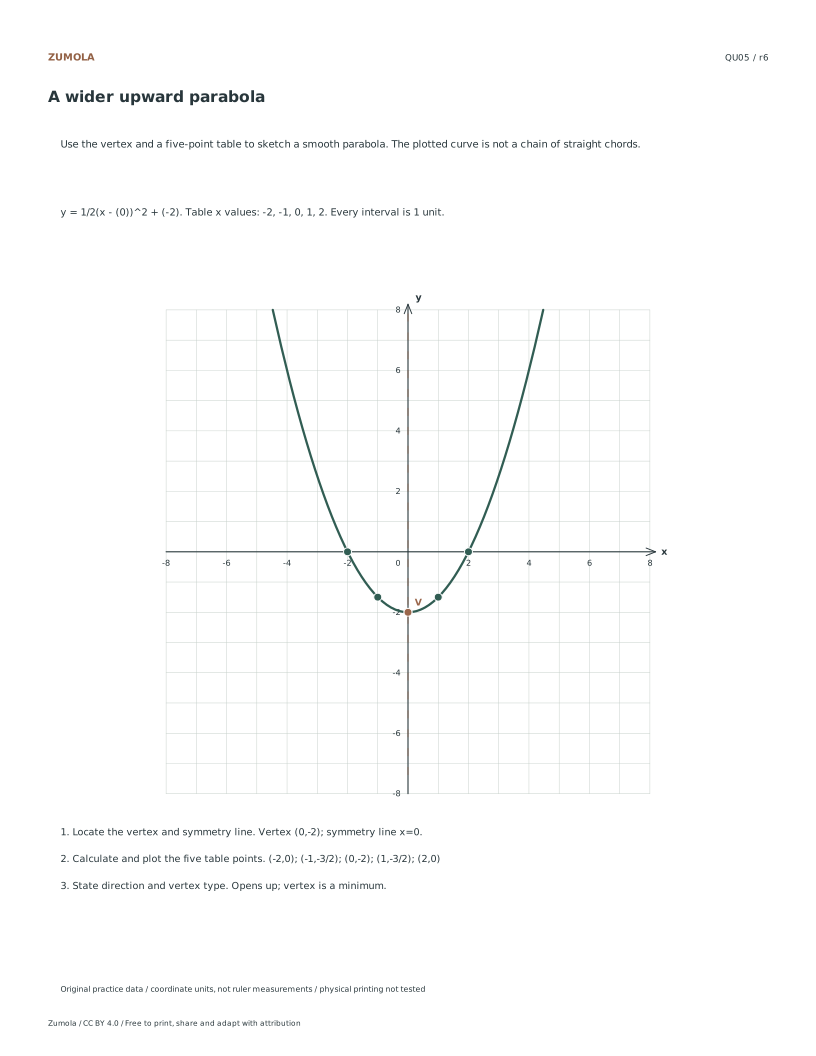
Compare width relative to the vertex First compare each curve with its own vertex and axis of symmetry. An upward-opening case has increasing y values as you move away from the vertex in either direction; a downward-opening one decreases. The cases with coefficient magnitude 1/2 spread farther horizontally for the same vertical change from the vertex than coefficient magnitude 1. Compare that relative change rather than absolute height on a shifted graph. The separate answer shows both the smooth curve and its sampled points, so you can check arithmetic and shape independently.
Checks that catch common errors
Watch for
Check instead
Connecting plotted points with straight line segments instead of a smooth curve.
Draw a continuous smooth parabola through the five calculated points to accurately represent the quadratic function's curvature.
Reading x-2 as a vertex x-coordinate of -2.
Match the expression with x-h. In (x-2)^2, h=2; in (x+2)^2, h=-2.
Using a physical ruler to measure distances on the printed graph to determine answers.
Rely on the digital units and plotted coordinates for accuracy, as the print does not guarantee physical measuring precision.
Keep the labels and margins readable
Choose the Letter or A4 file that matches your paper. Actual size / 100% preserves the designed layout; a different uniform print scale changes physical lengths but does not change the listed numbers or the arithmetic. Keep the whole chart and all labels inside the printable area. A ruler can help draw straight segments, but calculate from the stated numerical scale.
These files have digital geometry, arithmetic and page-boundary checks. Physical printer and classroom trials have not been completed. The resources are practice material, with no claim of curriculum certification or precision-instrument accuracy. The original files use CC BY 4.0: credit Zumola, link the license and indicate changes.
Useful answers
Is the vertex of y=(x-2)^2-1 at negative two?
No. Vertex form is y=a(x-h)^2+k, so that example has h=2 and k=-1. Its vertex is (2,-1).
Why should I avoid straight segments between table points?
Those points sample a quadratic curve. Straight chords give a piecewise-linear drawing; sketch a smooth parabola through the correctly plotted samples instead.
What does a negative coefficient a change?
It opens the parabola downward. The vertex is then a maximum rather than a minimum. A translation changes the location, while the magnitude of a controls width relative to the vertex.
Are the answer files and editable graphs free?
Yes. Reference, student and worked-answer files are all free without an account. Single sheets include PDF and SVG; collection packs are PDF files. Analytics consent is not required to download.
Optional Google Analytics helps us understand which free resources are useful. It is off until you allow it. Drawing tools and downloads work with either choice. Privacy details