Free graphing resources · Original practice
Number line worksheets.
Give fractions a position.
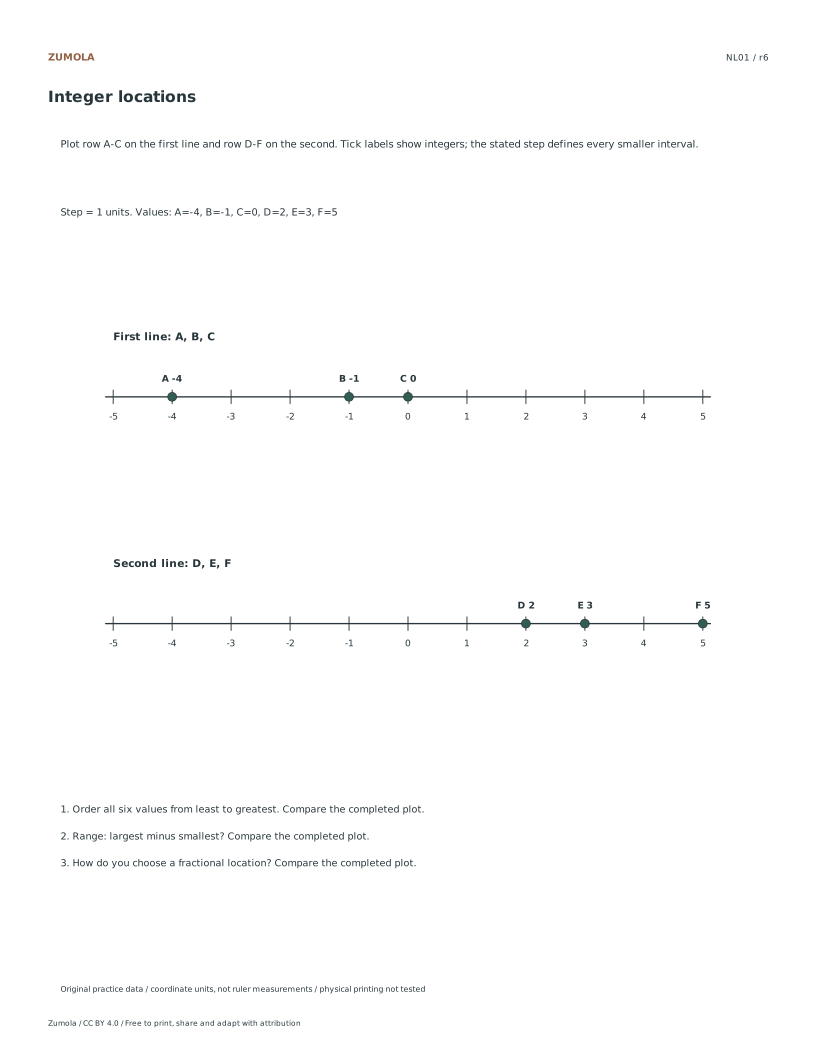
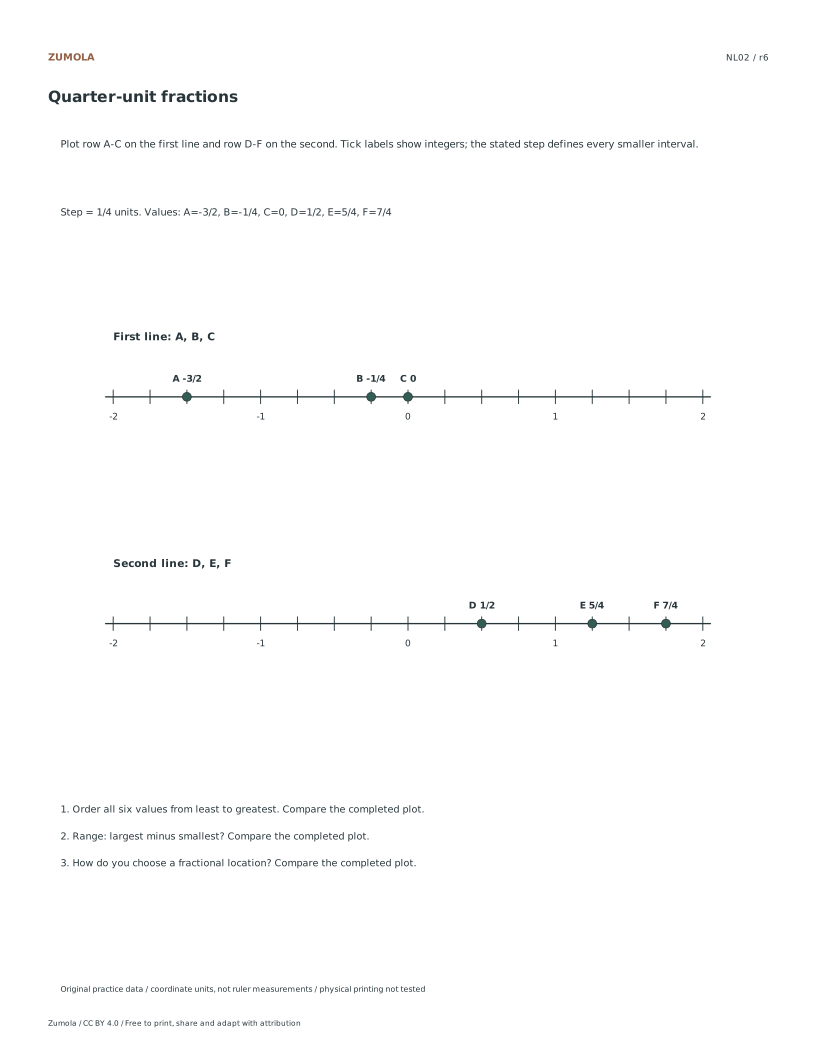
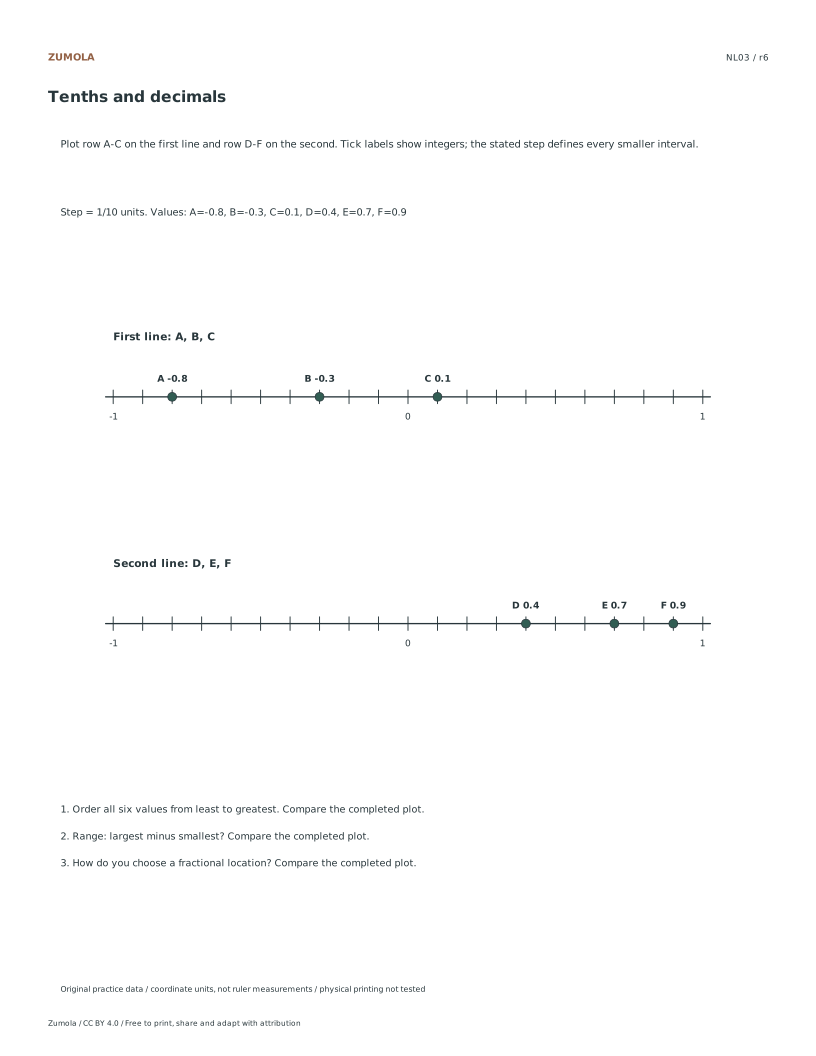
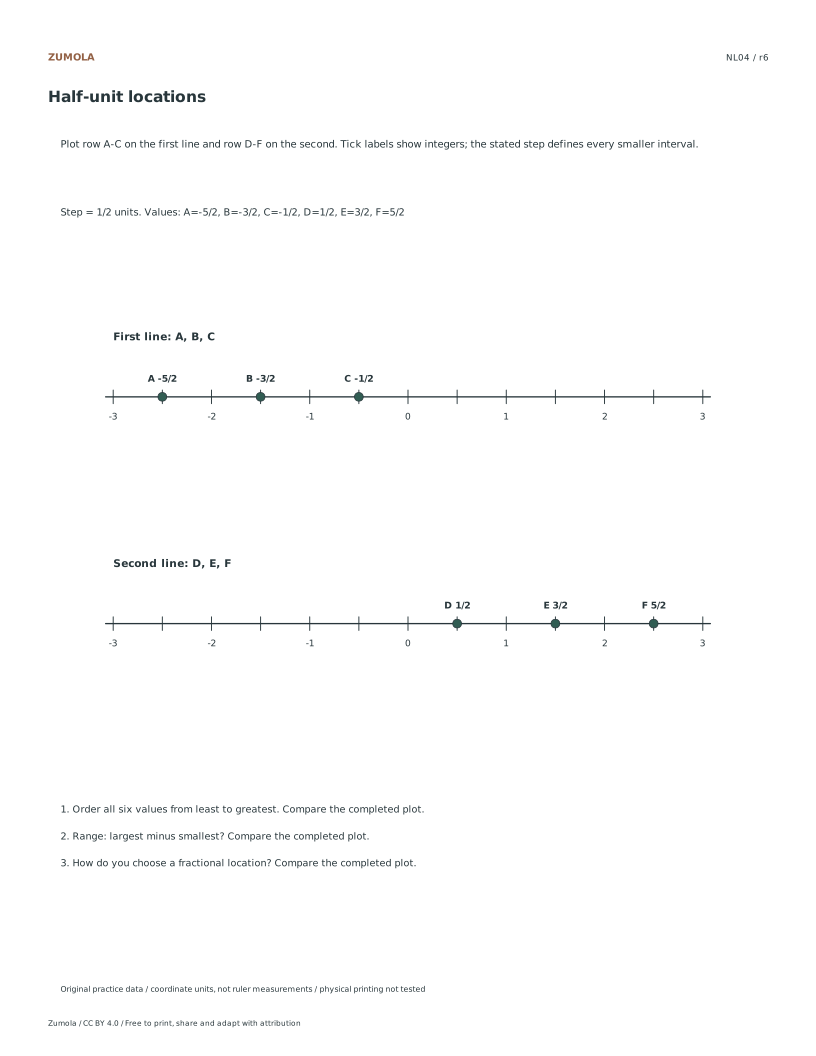
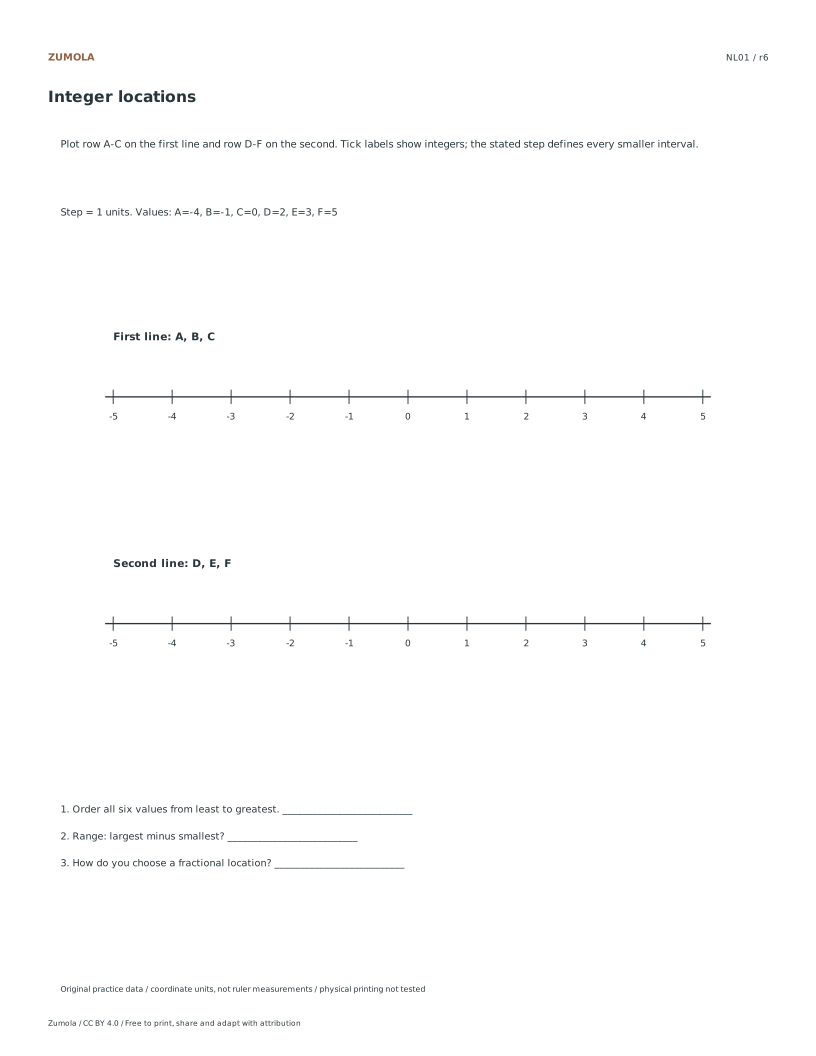
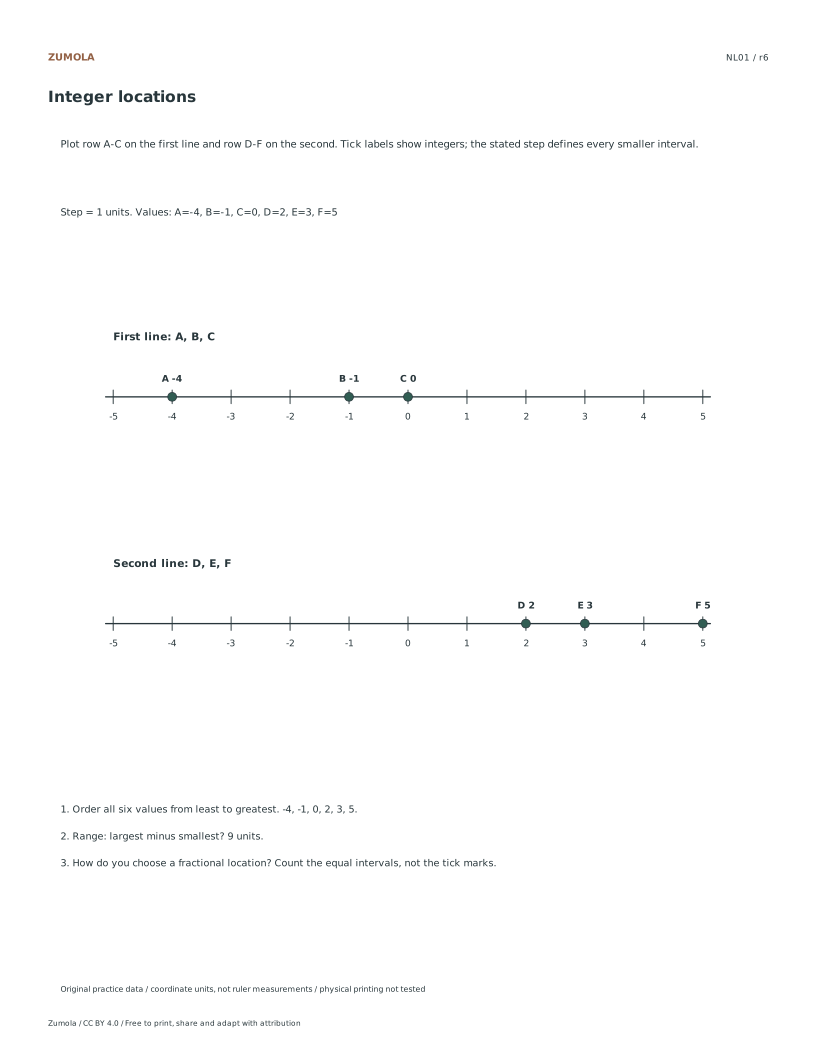
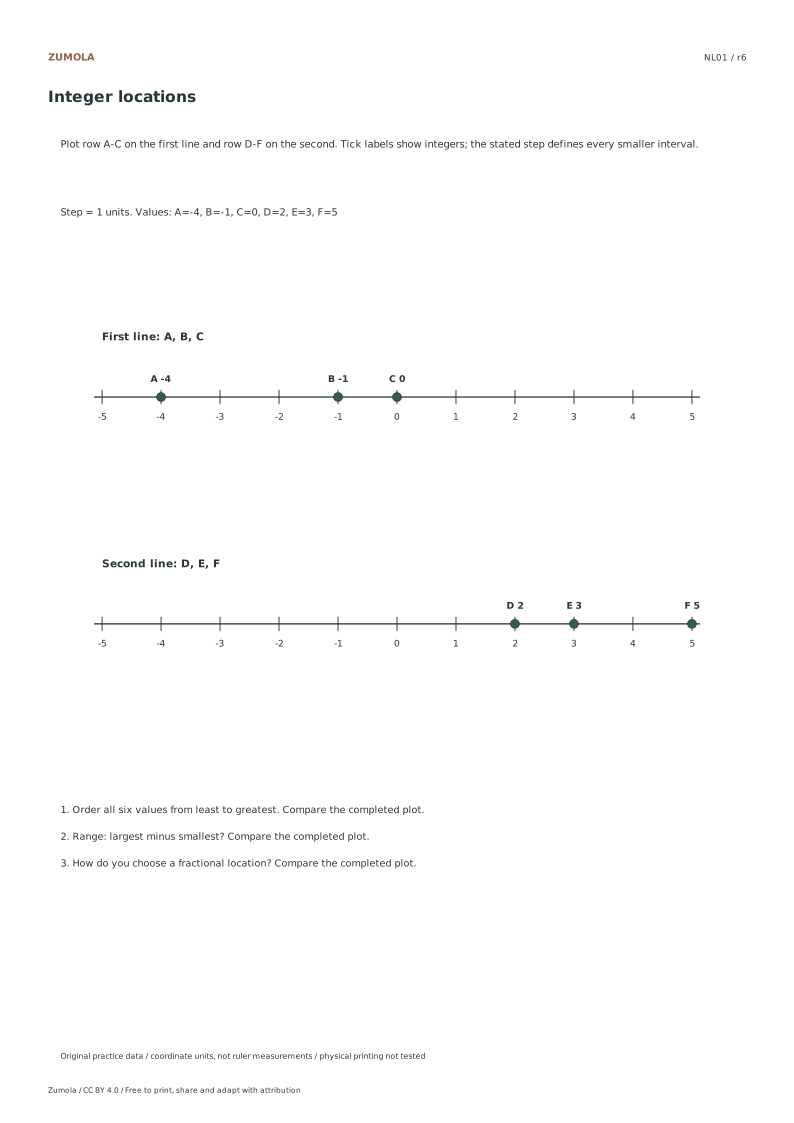
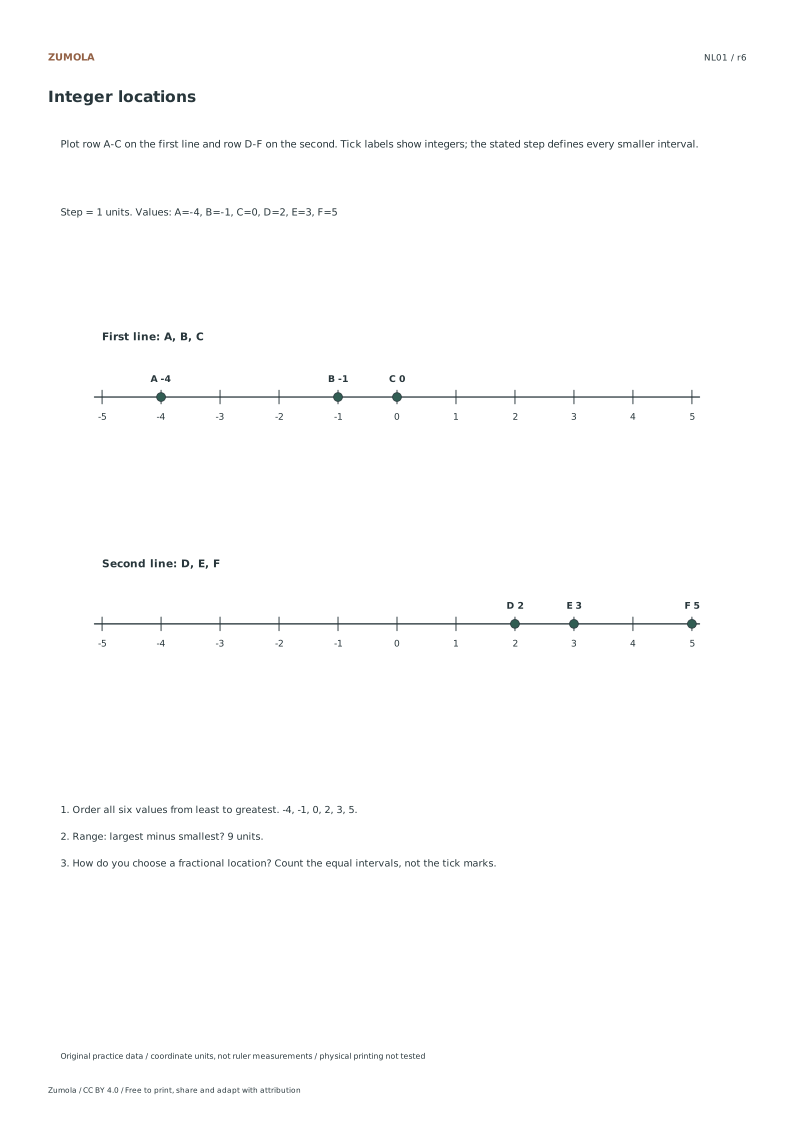
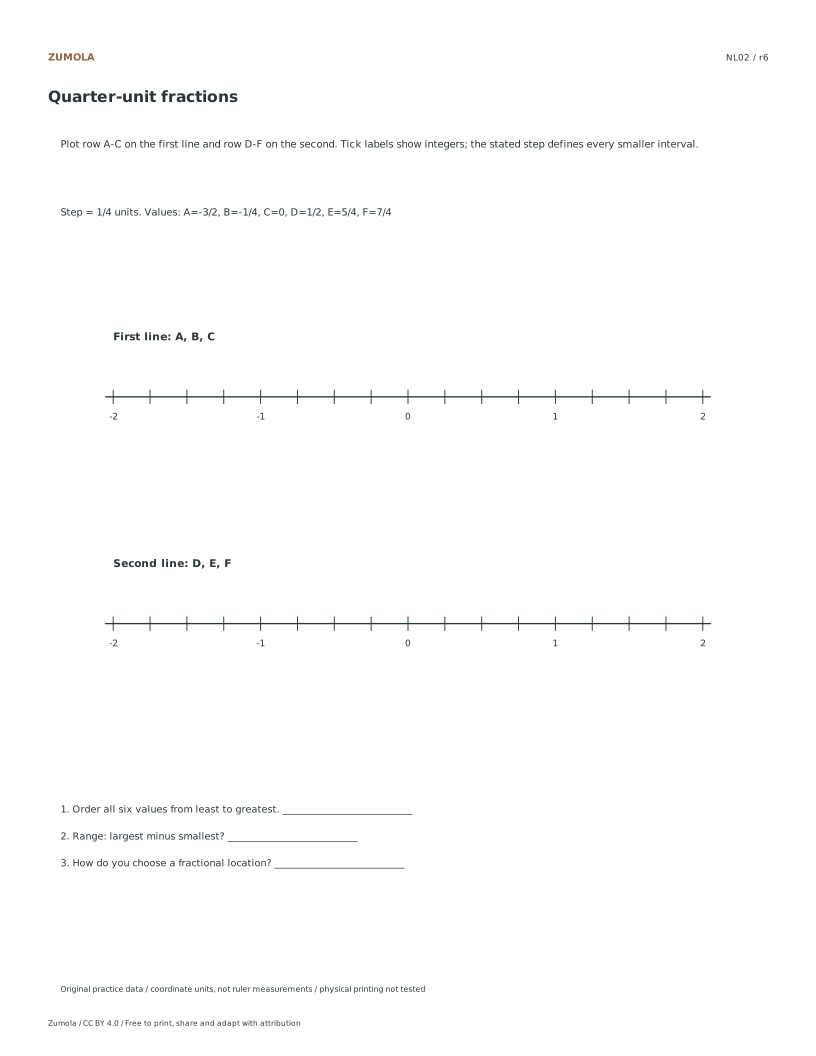
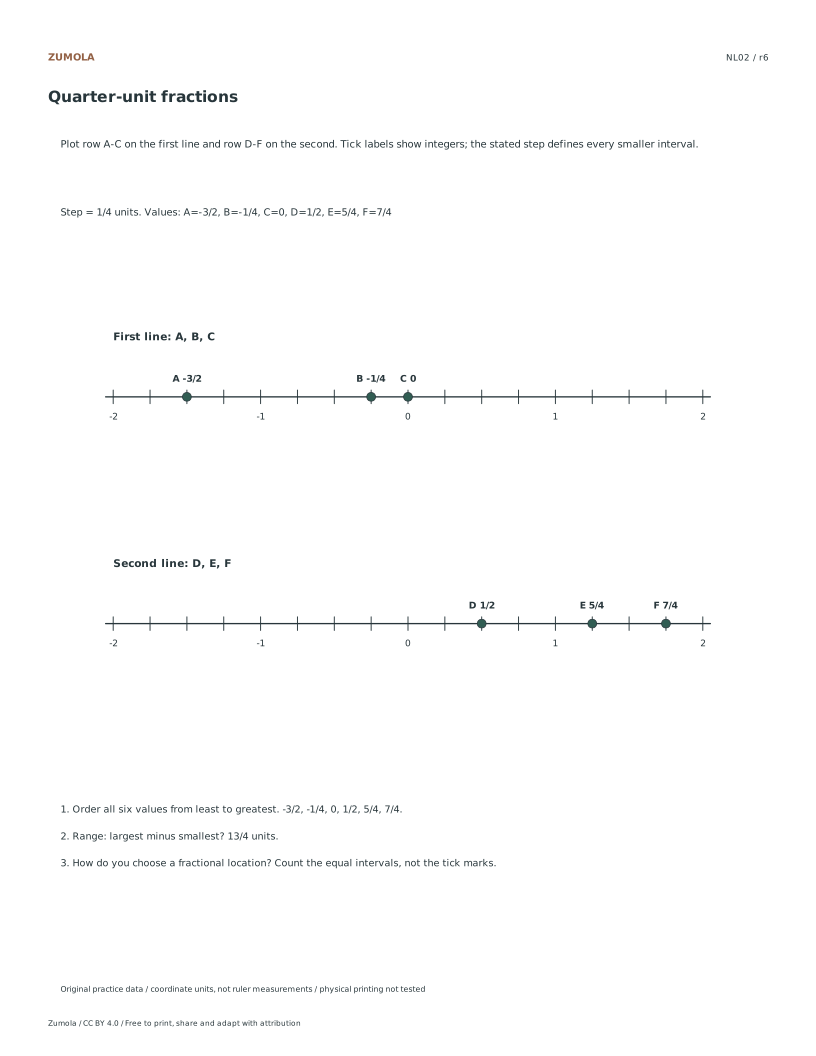
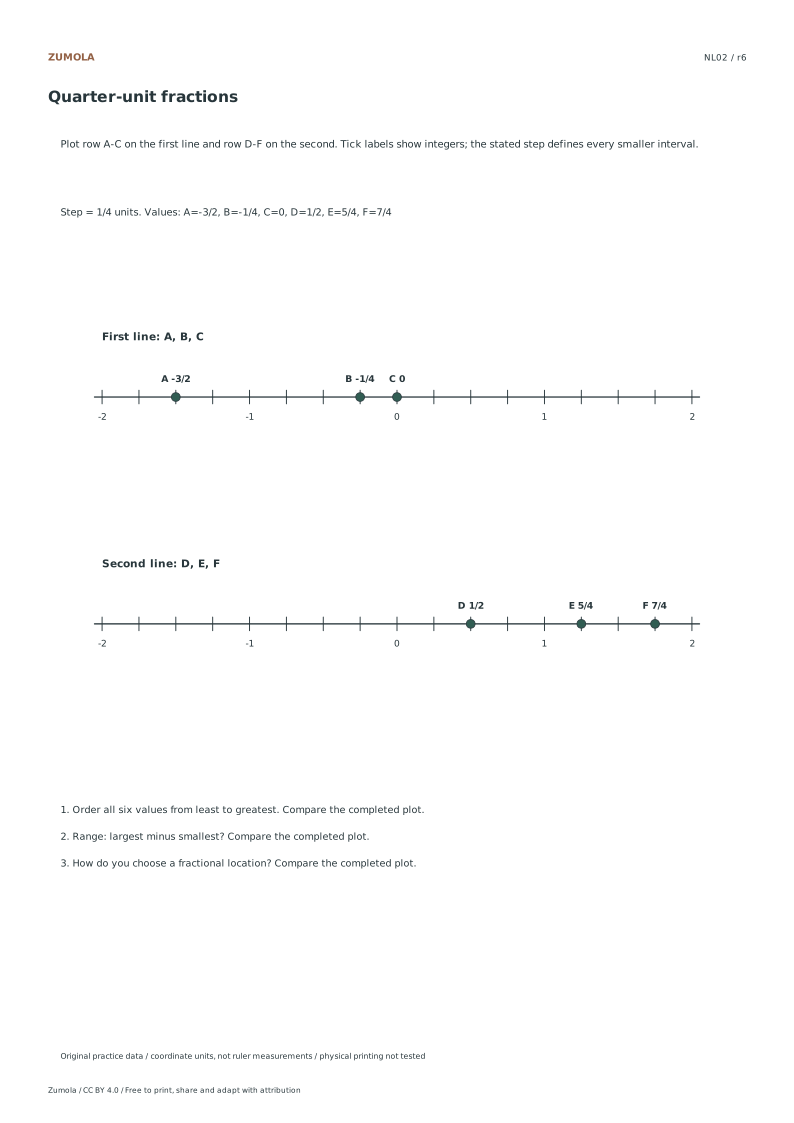
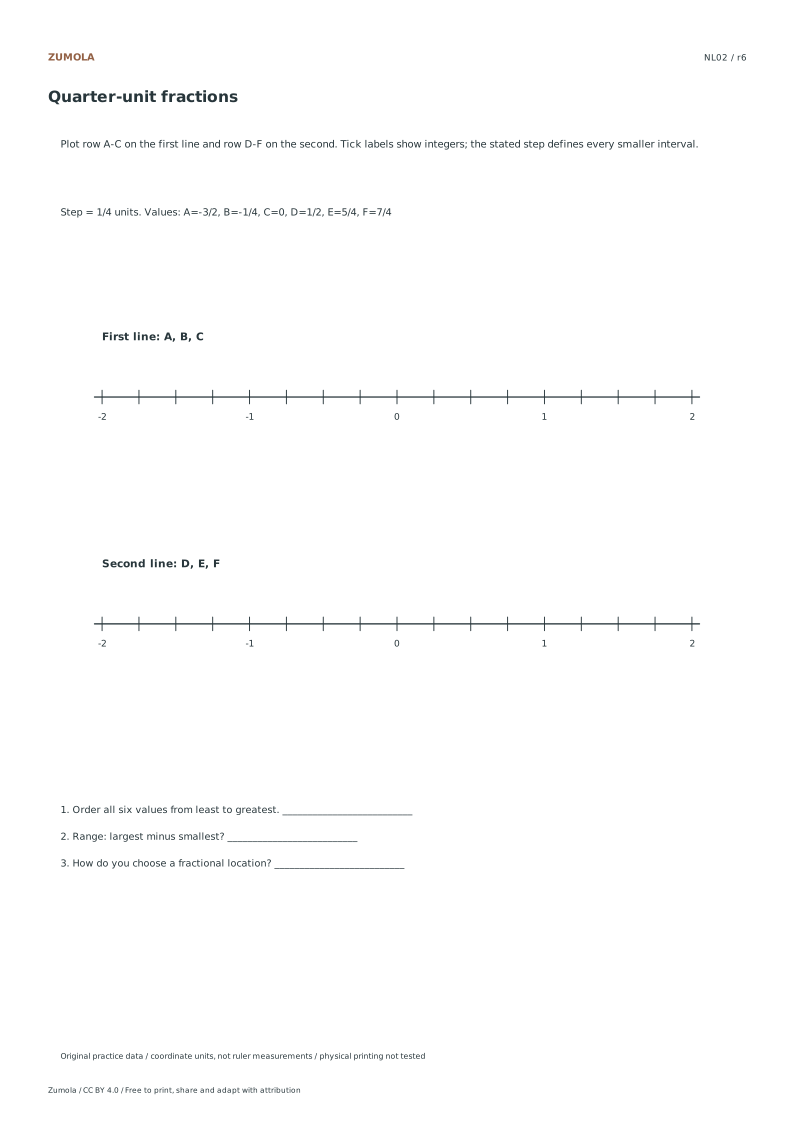
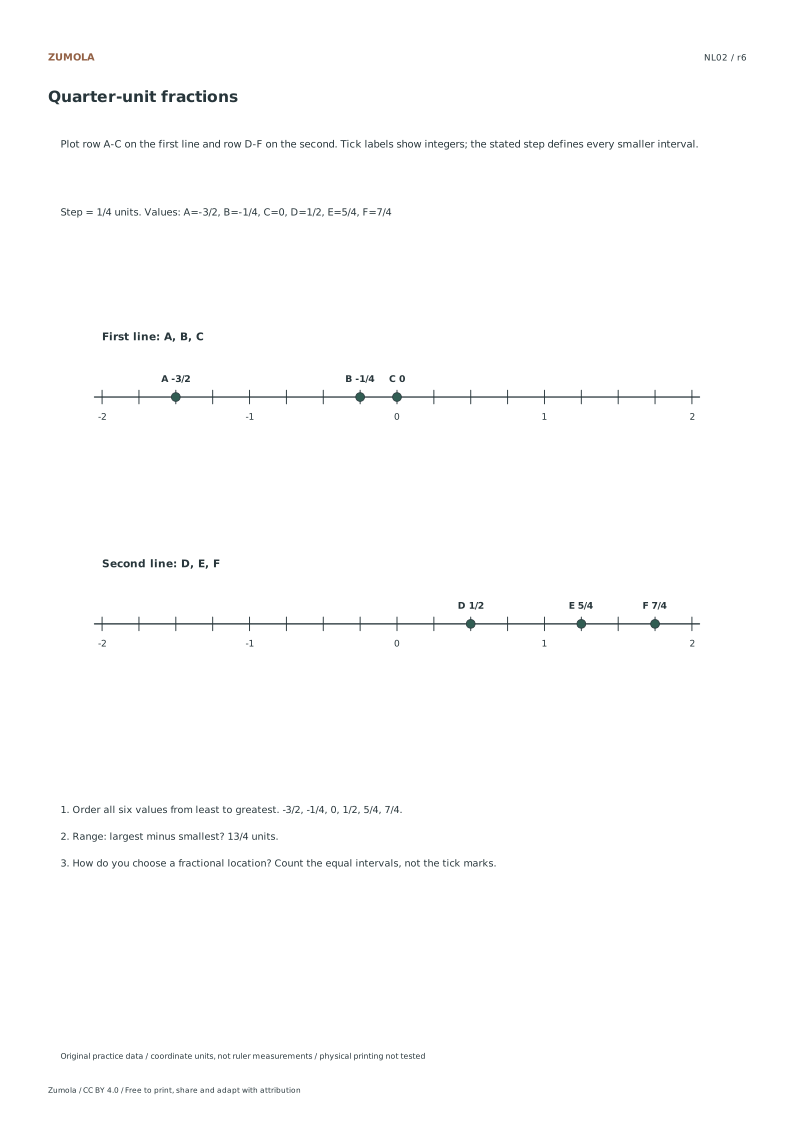
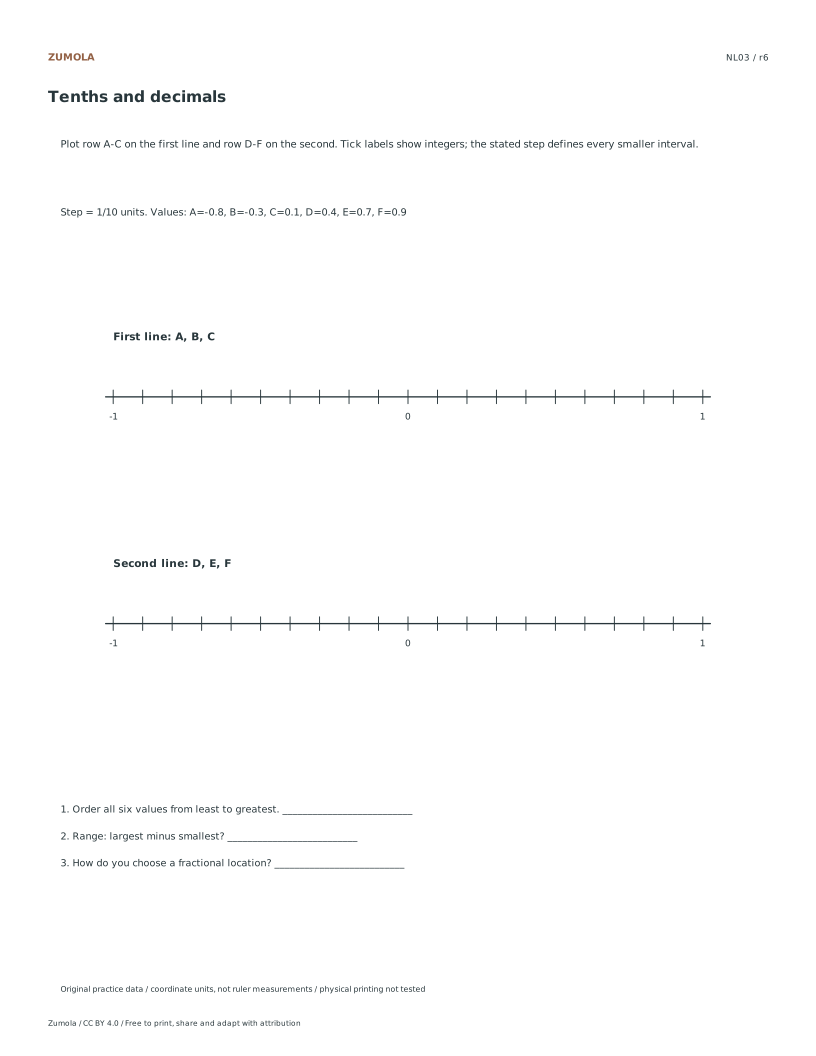
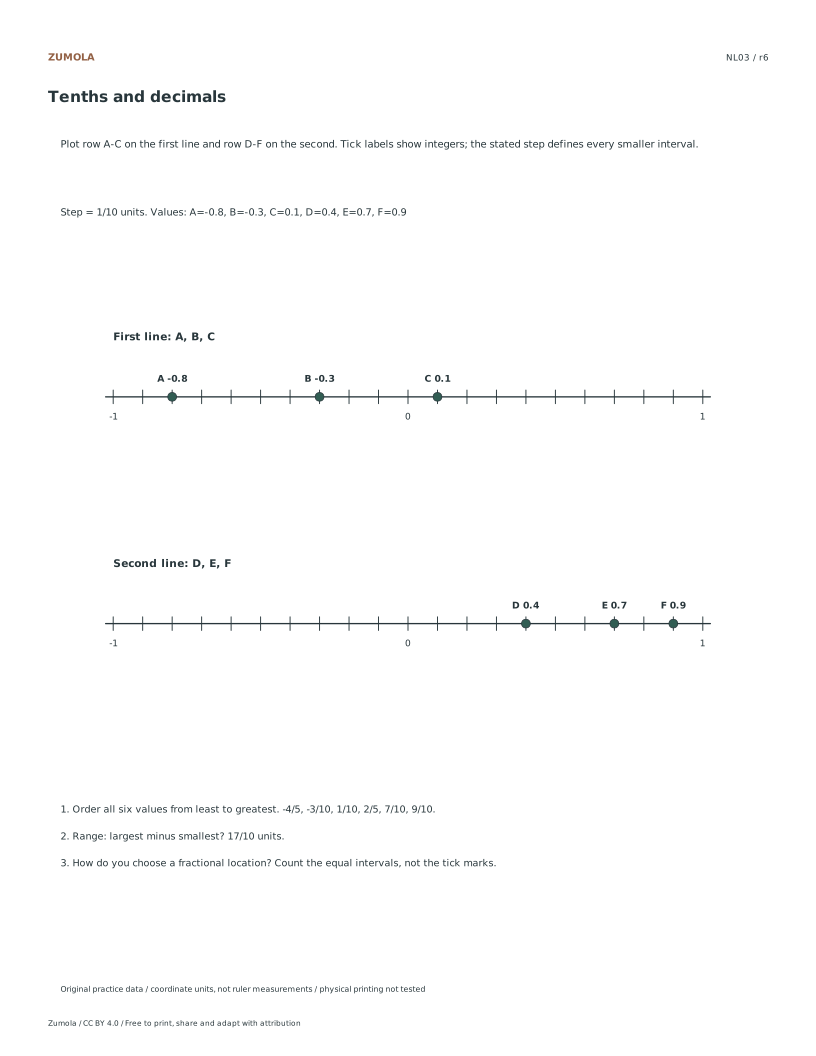
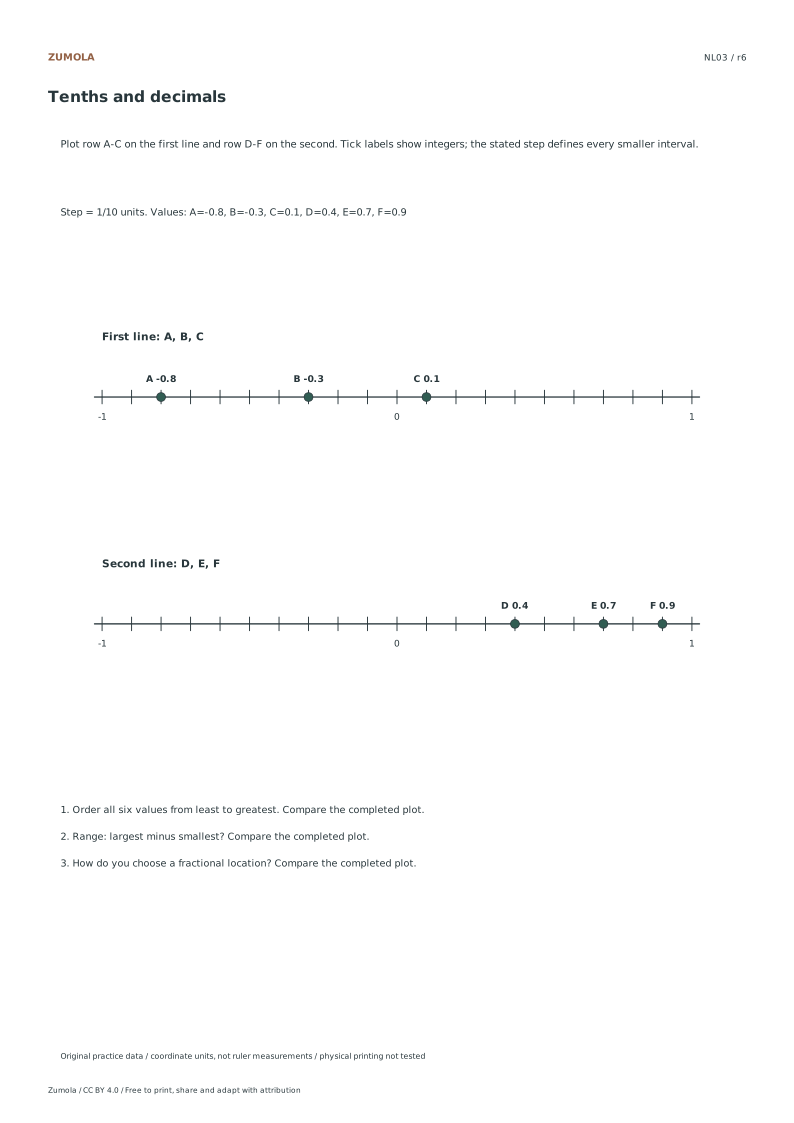
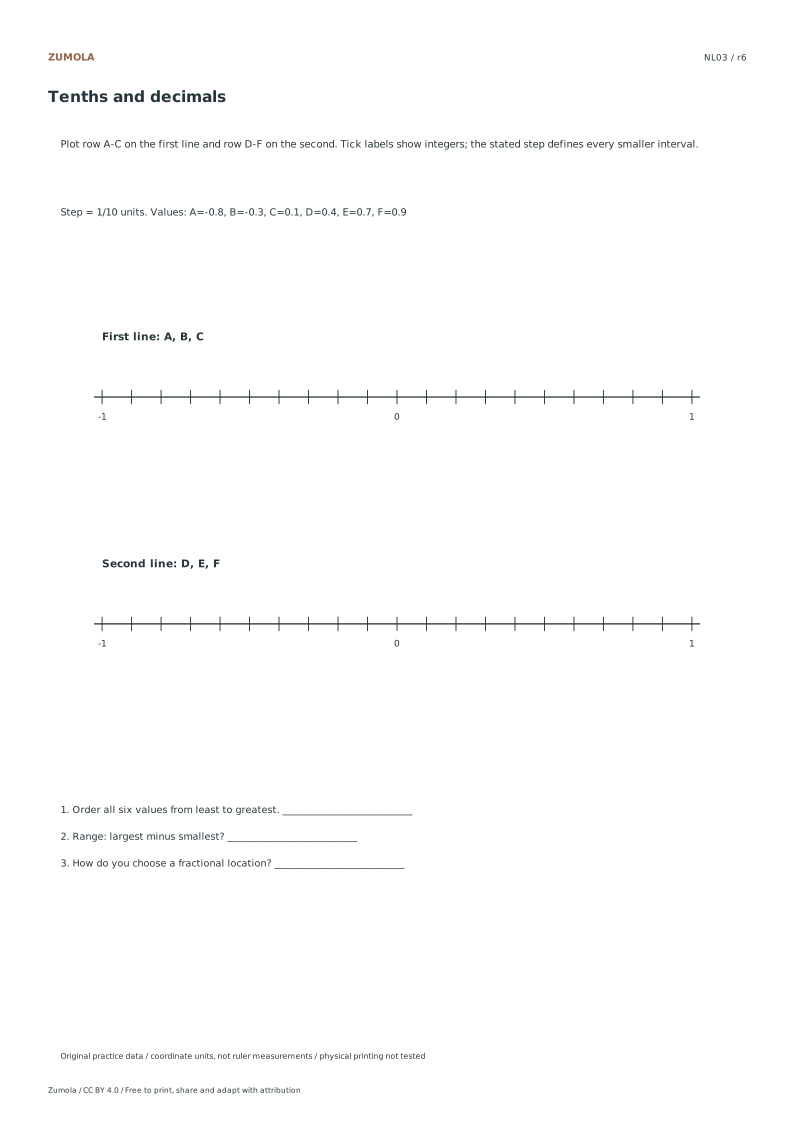
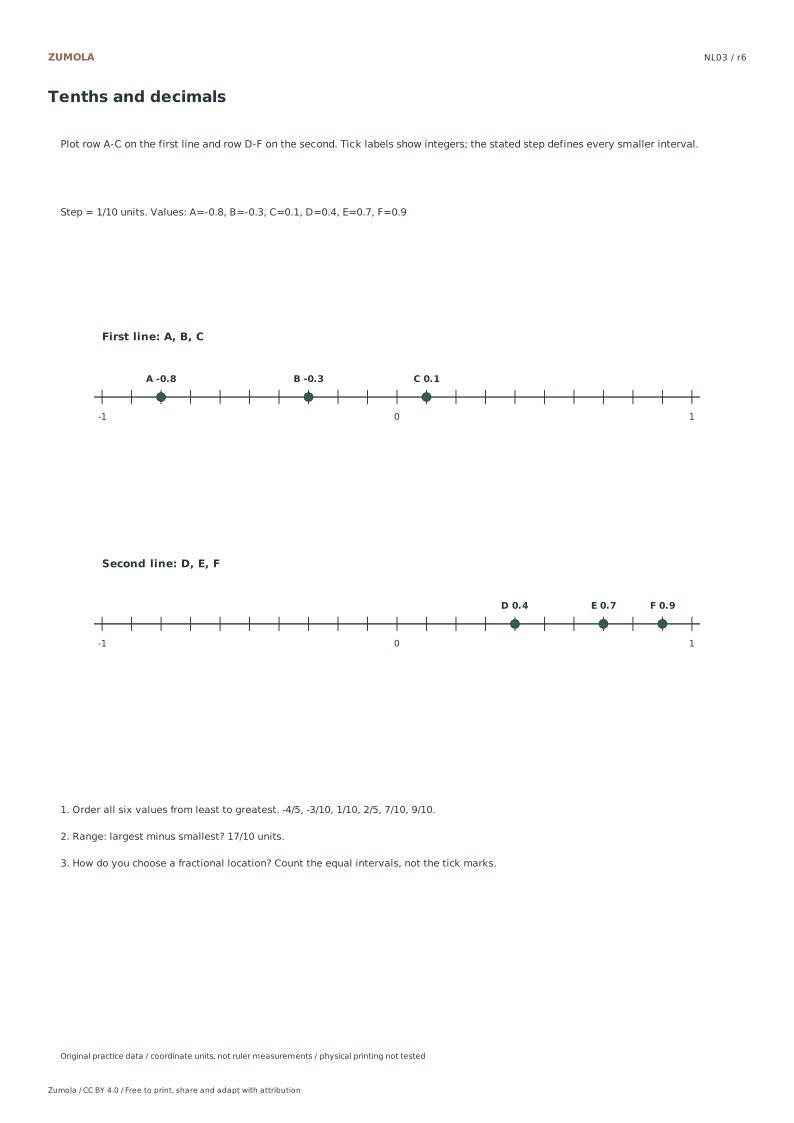
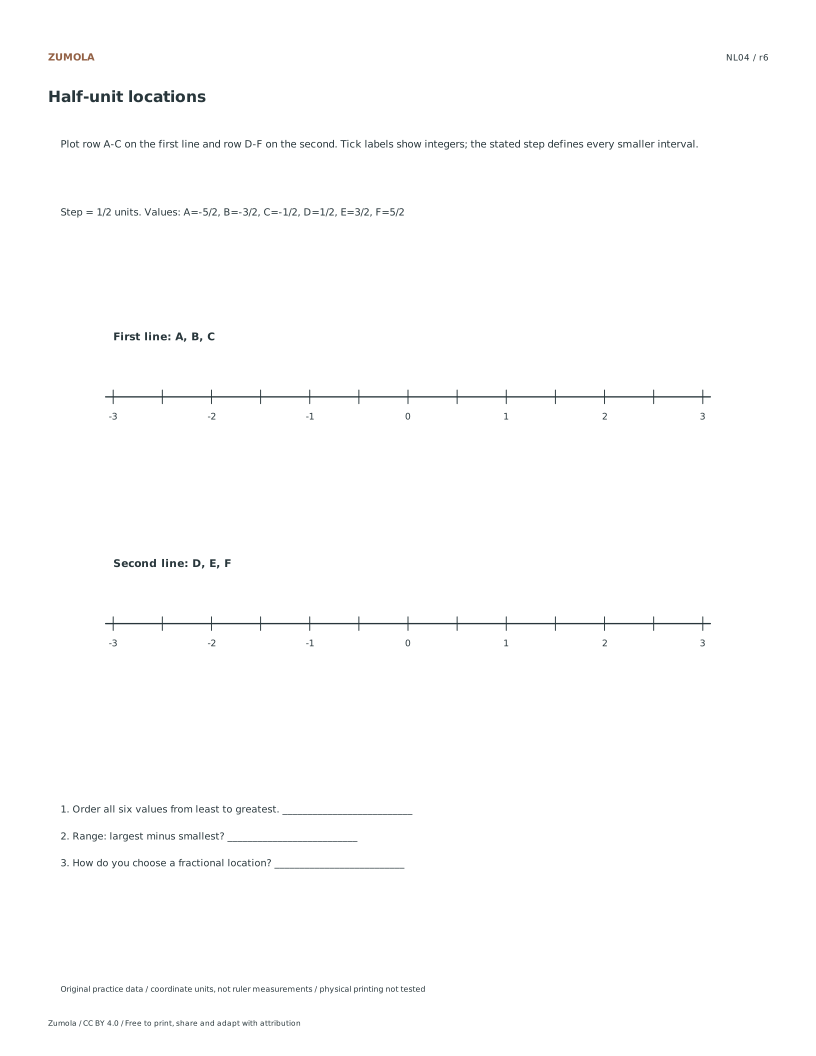
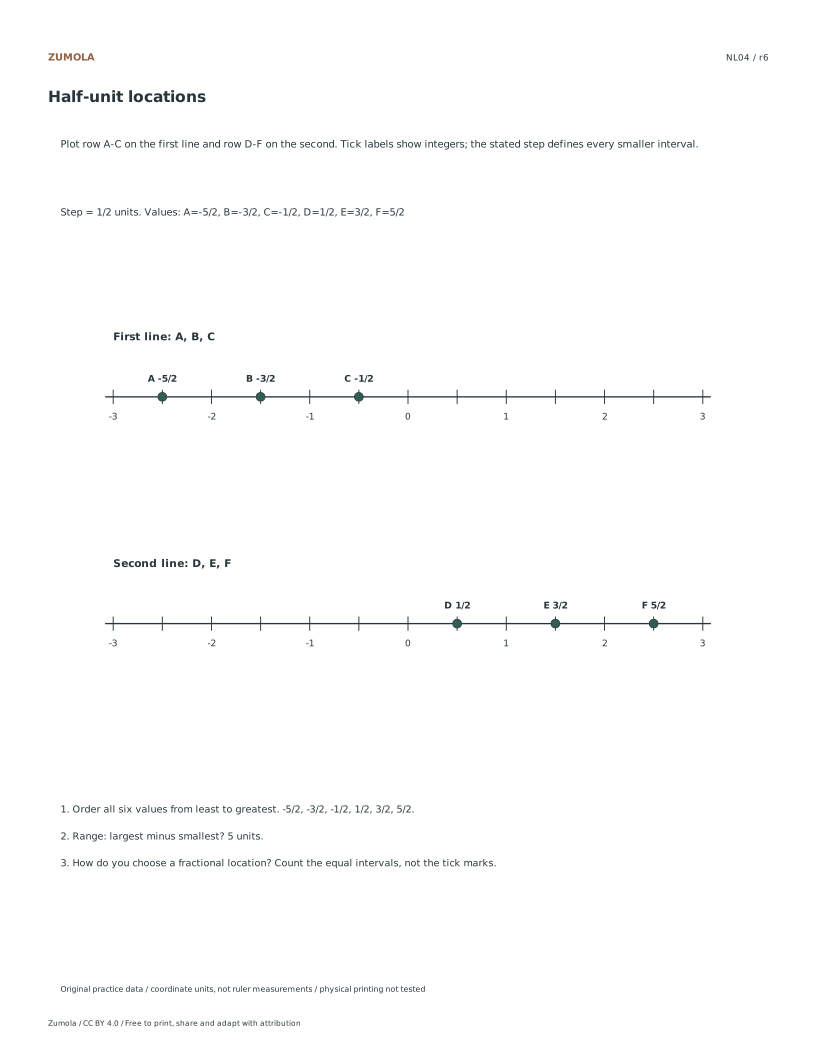
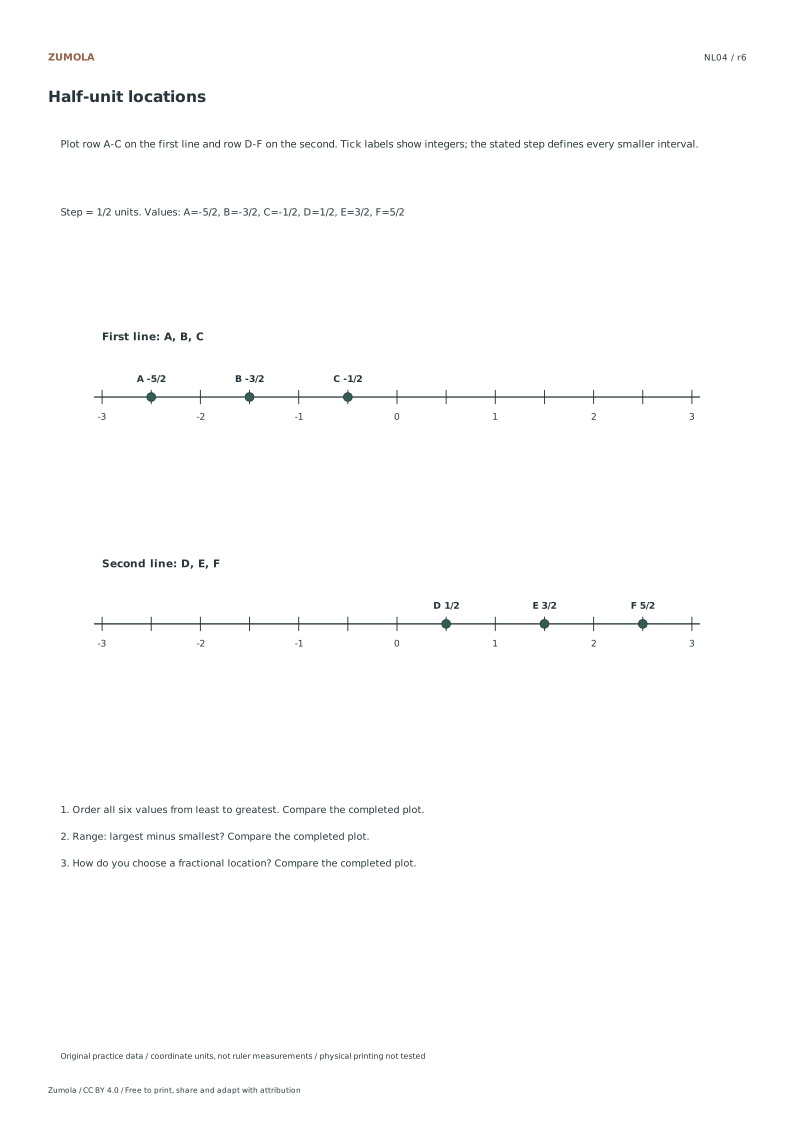
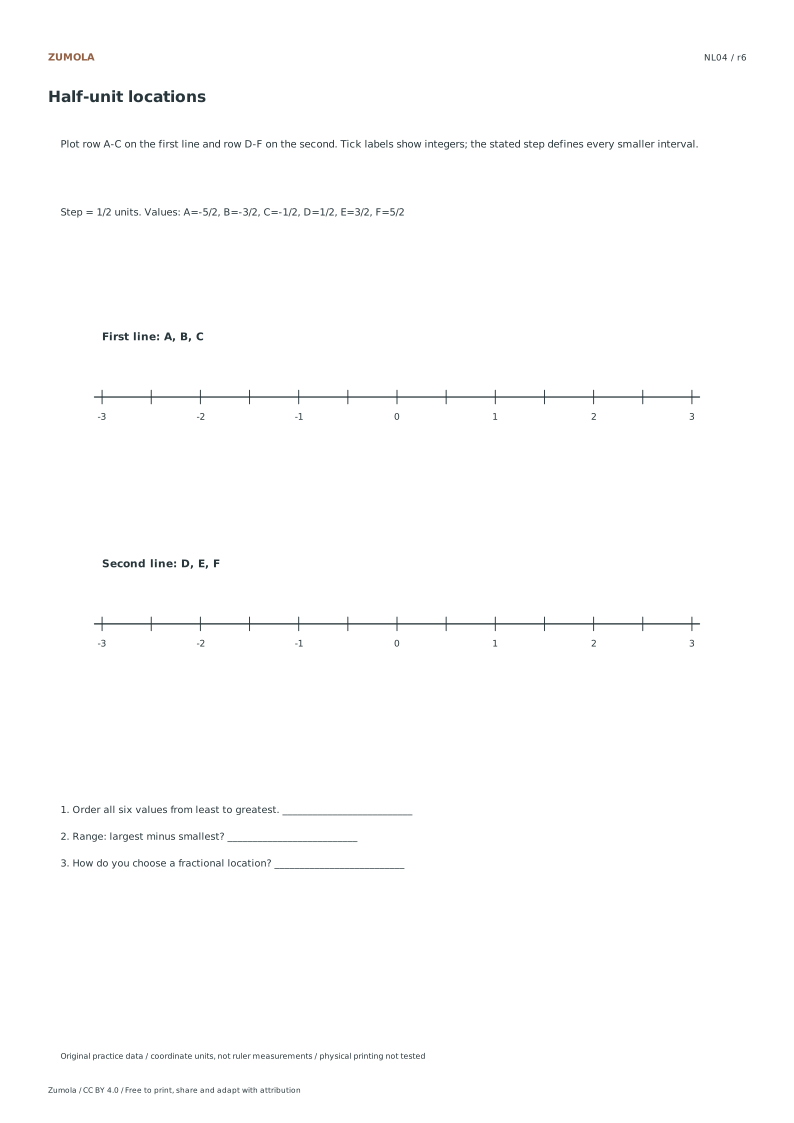
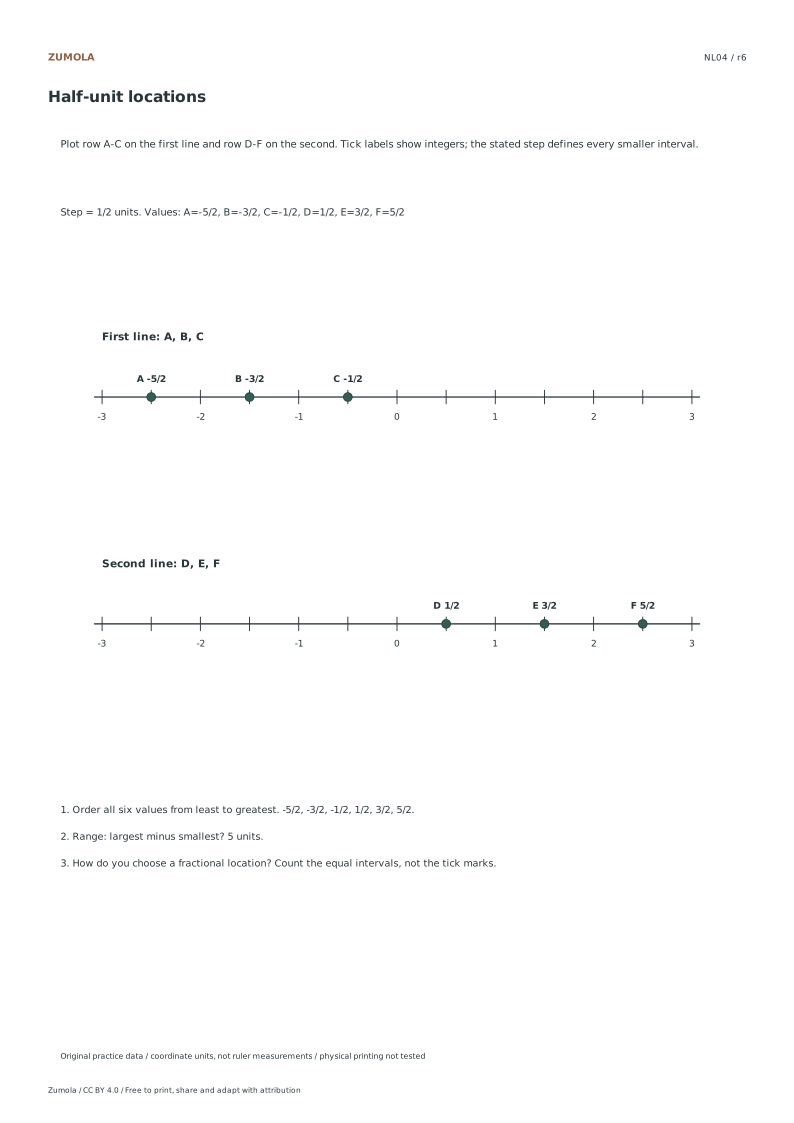
Graph fractions on a number line, then compare integer, quarter-unit, decimal and half-unit scales. Sort the six values in each case and calculate their range.
4 rational-number cases.
Two lines, six values per case.
More ways to practice
Why twentieths carry this mixed set
The values -1.5, 3/4, -0.2, 2, 1/2 and -2 include halves, quarters, fifths and a whole number. The denominators 2, 4, 5 and 10 all divide 20, so a unit split into 20 equal parts gives every value an exact tick. Tenths would place -1.5, -0.2 and 1/2, but 3/4 needs quarters, which do not land on tenths; twentieths place all values exactly and avoid rounding.
Count tick indices from zero, not from the left edge. A positive value sits that many twentieths to the right of zero; a negative value sits that many to the left. This convention keeps sign handling separate from counting, which is where most placement errors begin.
- Split one unit into 20 equal parts and mark zero clearly.
- Convert each value to twentieths: -1.5 = -30/20, 3/4 = 15/20, -0.2 = -4/20, 2 = 40/20, 1/2 = 10/20, -2 = -40/20.
- Place each point at its signed tick index from zero: -30, +15, -4, +40, +10, -40.
- Read the line left to right and record the order.
- Subtract the smallest value from the largest to find the range.
Diagnostic checks after plotting
A finished line can look tidy and still be wrong. Run three checks that do not depend on the drawing looking neat. First, confirm every point sits on a tick, not between ticks; a point between ticks means the chosen subdivision cannot represent that value exactly. Second, confirm the distance from zero to each point matches its absolute value in twentieths. Third, confirm the left-to-right order matches the numerical order you calculated before plotting.
Sign placement deserves its own check. Values closer to zero should sit closer to the zero mark regardless of sign, so -0.2 belongs nearer zero than -1.5. If a negative value appears farther right than a positive value, the sign was likely dropped during counting.
- Check each point is on a tick, not between ticks.
- Measure each distance from zero and compare it with the absolute value in twentieths.
- Confirm the plotted order matches the pre-calculated numerical order.
- Confirm negative values sit left of zero and positive values right of zero.
- Recalculate the range from the ordered list, not from the drawing.
When physical scale matters
On an abstract number line, uniform scaling preserves relative positions, so a slightly reduced print still keeps the order and spacing proportional. Physical scale matters only when a task specifies a real unit length, such as one unit equal to a stated number of centimetres. In that case, print at 100% and confirm the printed calibration bar against a ruler before trusting measured distances.
Keep labels and margins readable after any scaling. Crowded labels near zero can make two nearby points look merged, so space the labels and keep the zero mark distinct from the first tick.
- Decide whether the task needs an abstract line or a specified physical unit length.
- For physical units, print at 100% and check the calibration bar with a ruler.
- Space labels so nearby points near zero remain distinguishable.
Try this example
Place -1.5, 3/4, -0.2, 2, 1/2 and -2 on one number line split into twentieths, then state the order and range.
Show the worked explanation
Convert to twentieths: -1.5 = -30/20, 3/4 = 15/20, -0.2 = -4/20, 2 = 40/20, 1/2 = 10/20, -2 = -40/20. Signed tick indices from zero are -30, +15, -4, +40, +10, -40. Left-to-right order is -2, -1.5, -0.2, 0.5, 0.75, 2. Range = 2 - (-2) = 4. Every point lands on a tick, and each distance from zero equals its absolute value in twentieths.
Common mistakes
- Using tenths for a set that includes quarters such as 3/4, leaving that value between ticks. Choose a subdivision whose denominator is a common multiple of all denominators; twentieths cover halves, quarters, fifths and tenths here.
- Counting ticks from the left edge instead of from zero, shifting every index. Mark zero first and count signed tick indices outward from it in both directions.
- Dropping the negative sign when counting, so -1.5 is placed right of zero. Record the signed index before plotting and confirm negative values sit left of zero.
Check your work
- Every value is converted to a shared denominator before plotting.
- Each point sits exactly on a tick, with no value left between ticks.
- Signed tick indices are counted from zero, not from the left edge.
- Negative values appear left of zero and positive values right of zero.
- The plotted left-to-right order matches the pre-calculated numerical order.
- The range is calculated from the ordered values, not read from the drawing.
Questions before you start
Why use twentieths instead of tenths for this set?
Tenths cannot place quarters exactly. 3/4 equals 0.75, which falls between tenth ticks, while twentieths give it an exact tick at 15/20.
Does reducing the print size make the fraction positions wrong?
On an abstract line, uniform scaling keeps relative positions proportional, so order and spacing remain valid. Physical unit lengths need 100% printing and a calibration check.
How do I verify the range without redrawing?
Order the values numerically, then subtract the smallest from the largest. Here the order is -2, -1.5, -0.2, 0.5, 0.75, 2, so the range is 2 - (-2) = 4.