Free graphing resources · Original practice
Pie chart worksheets.
Turn counts into one whole.
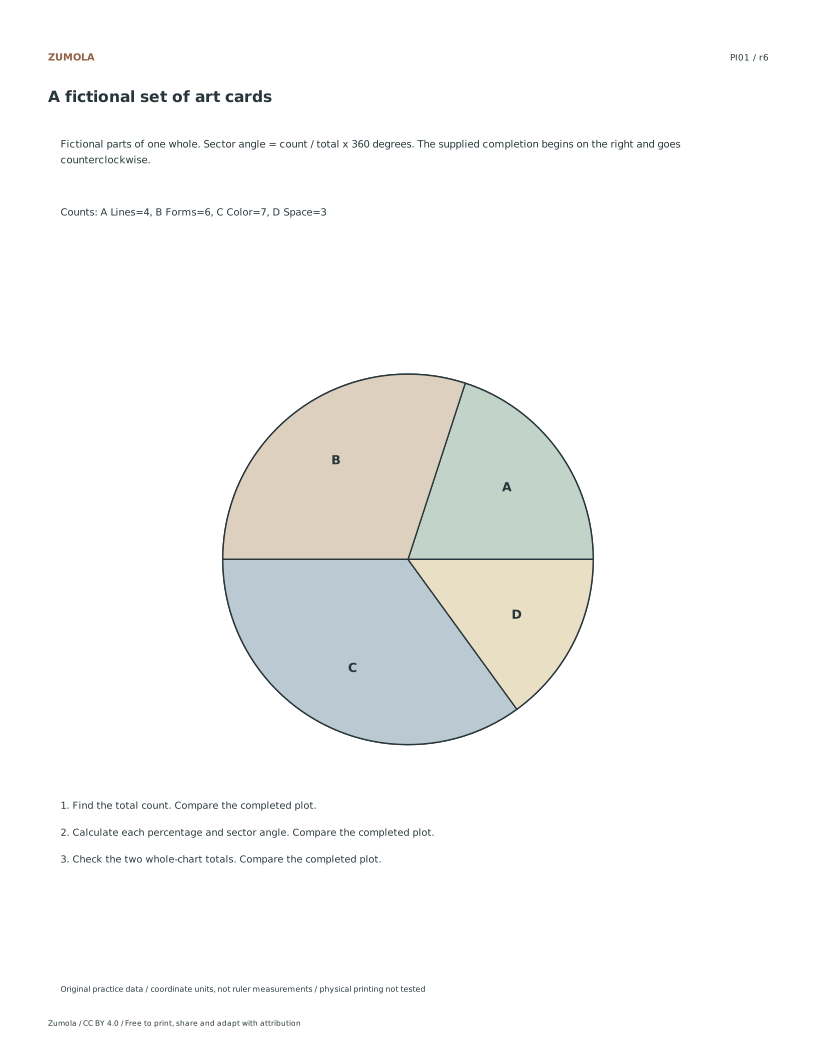
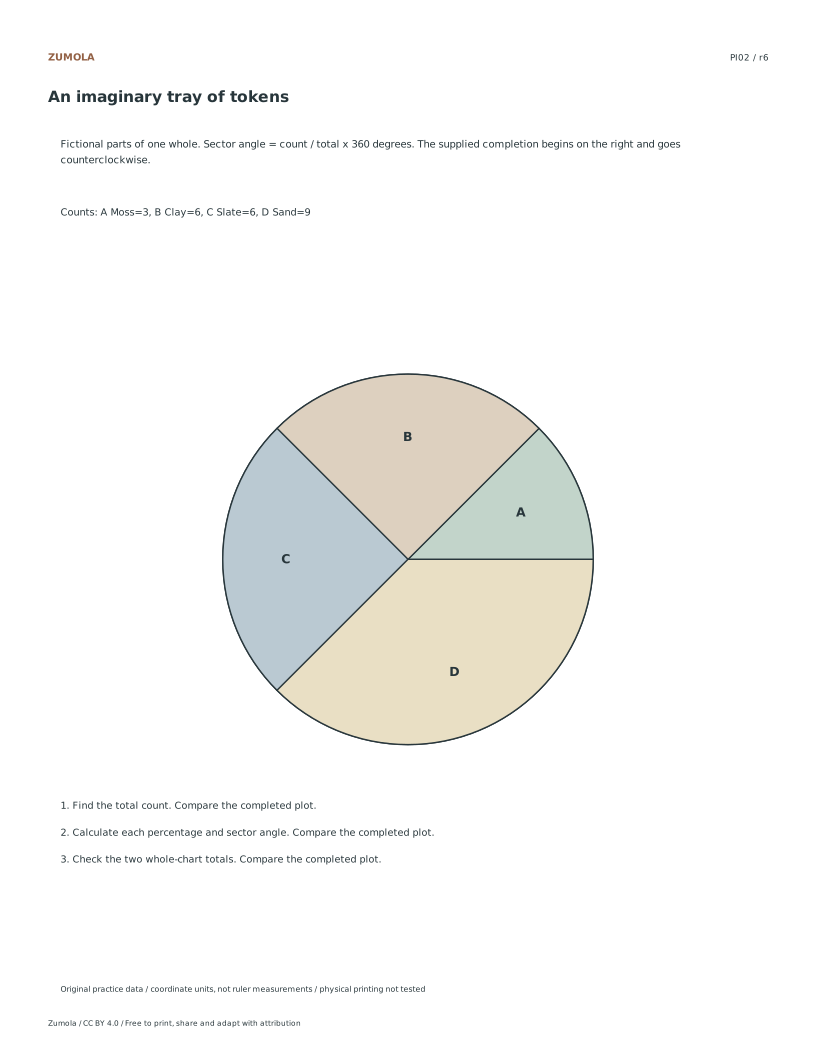
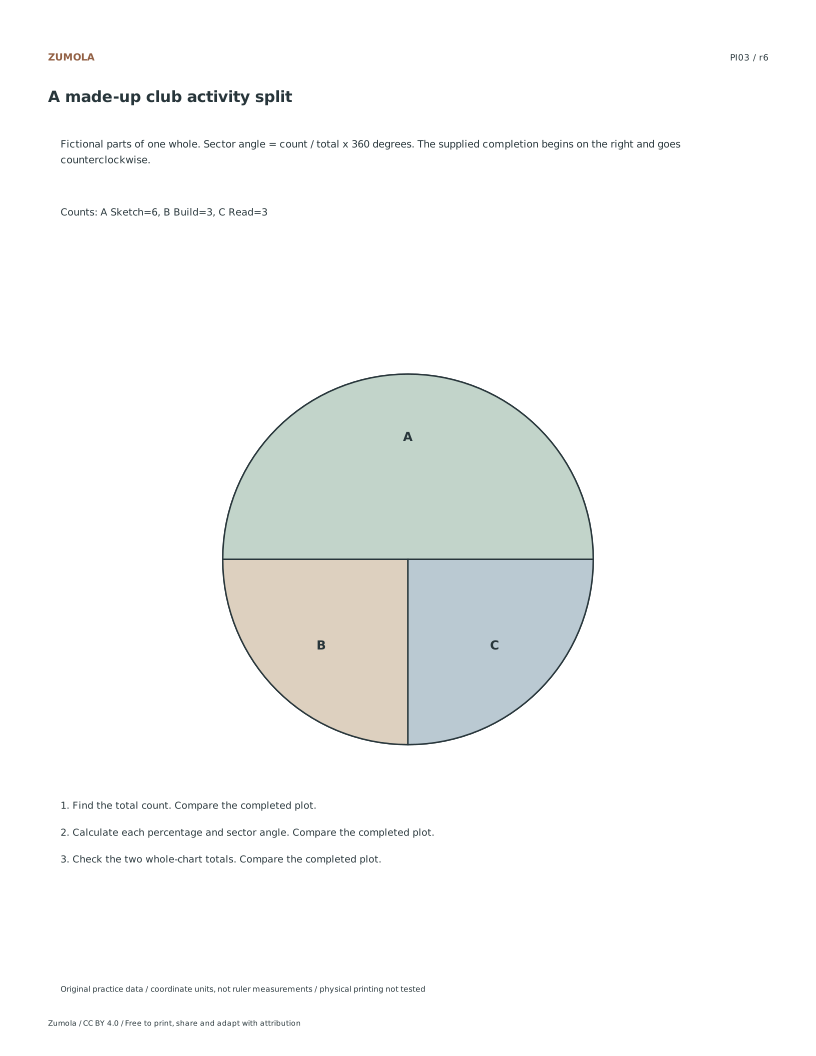
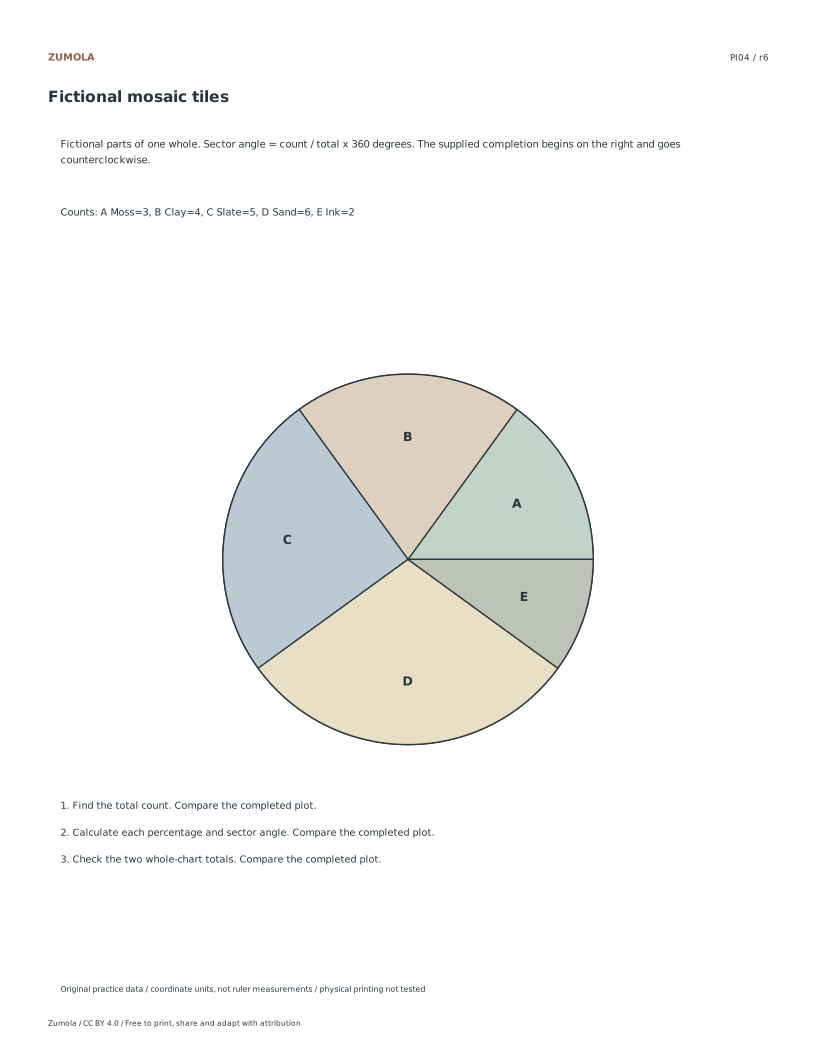
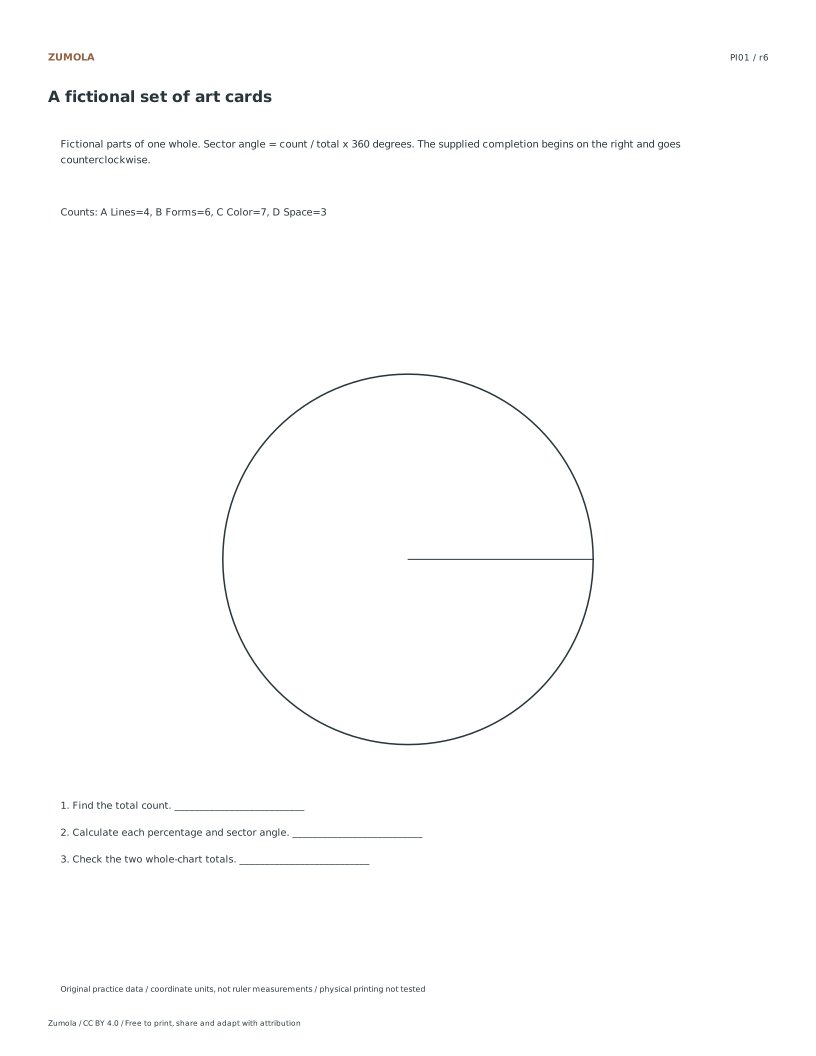
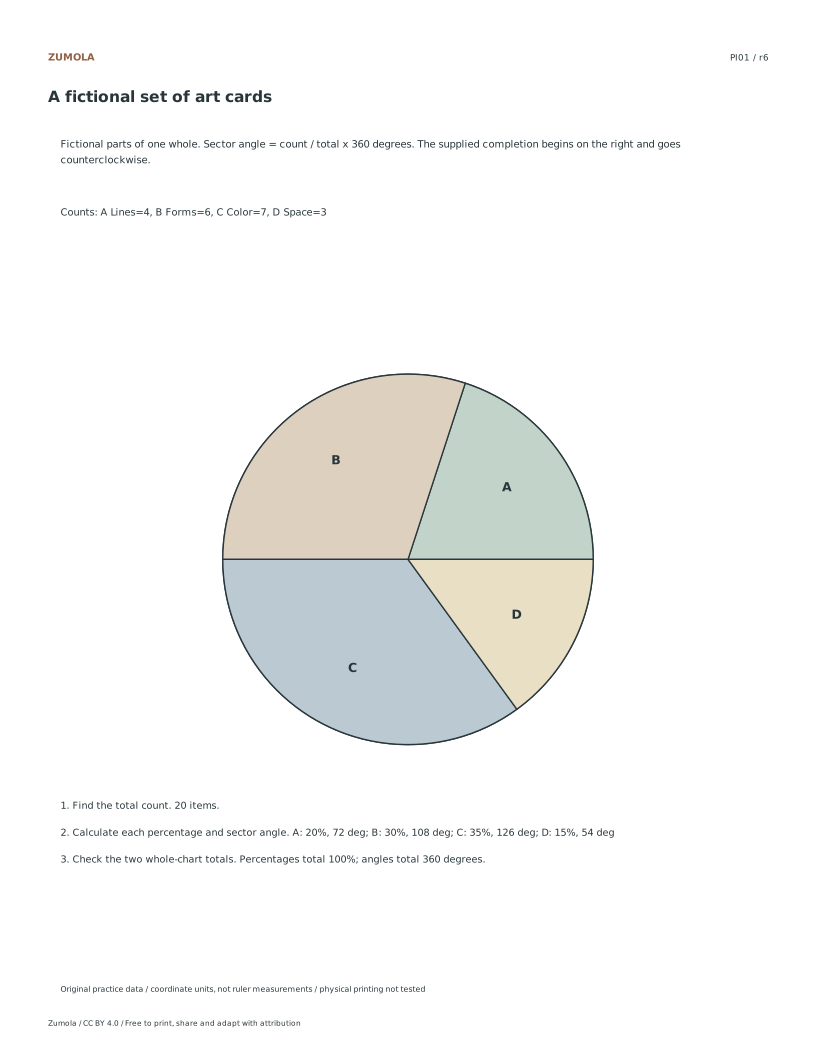
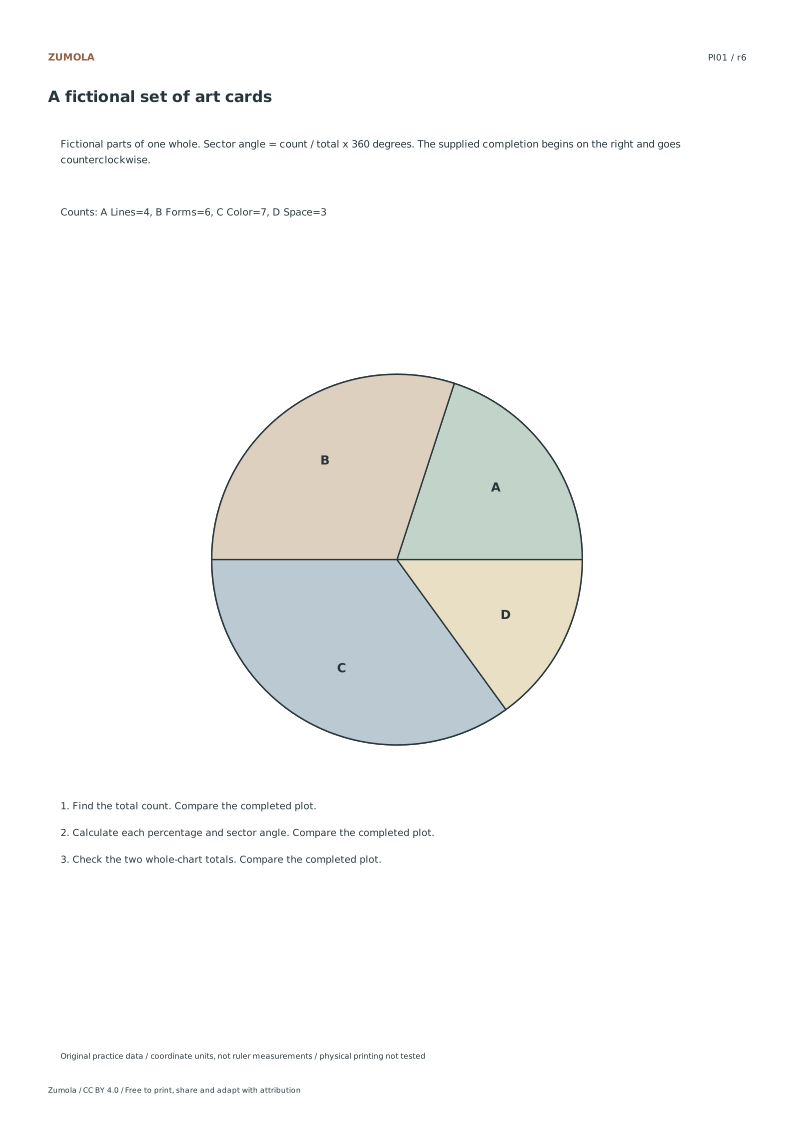
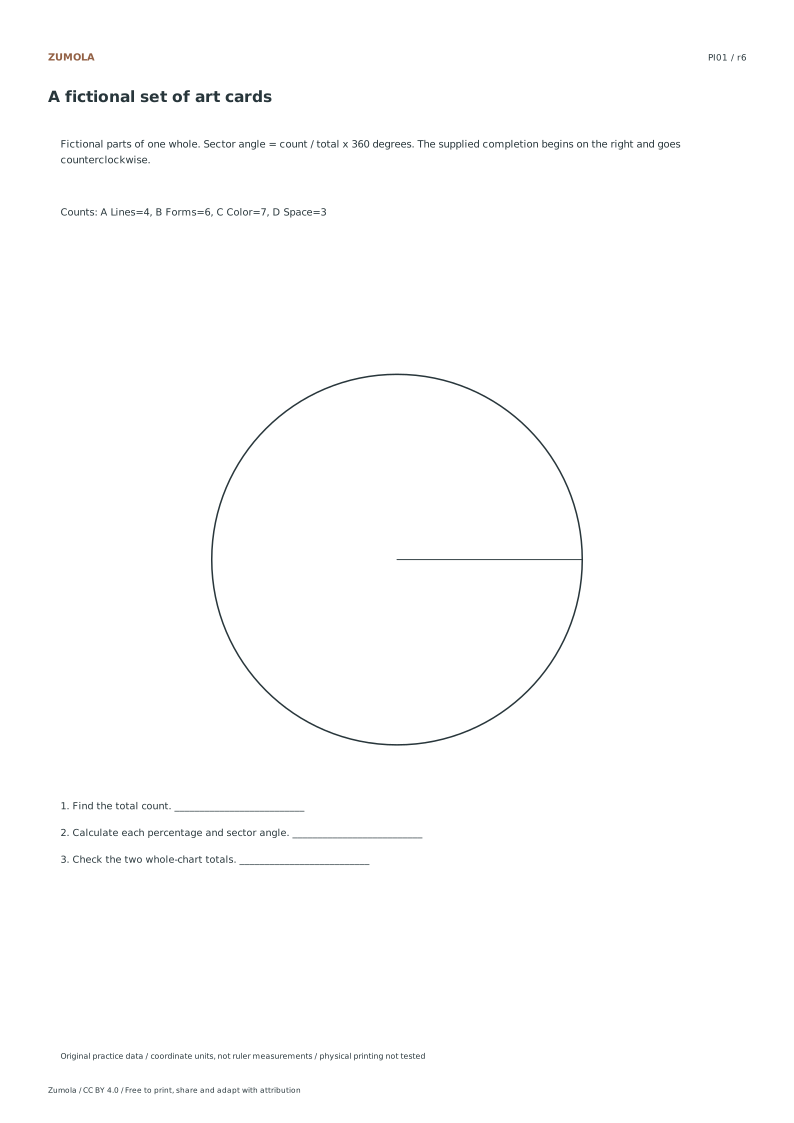
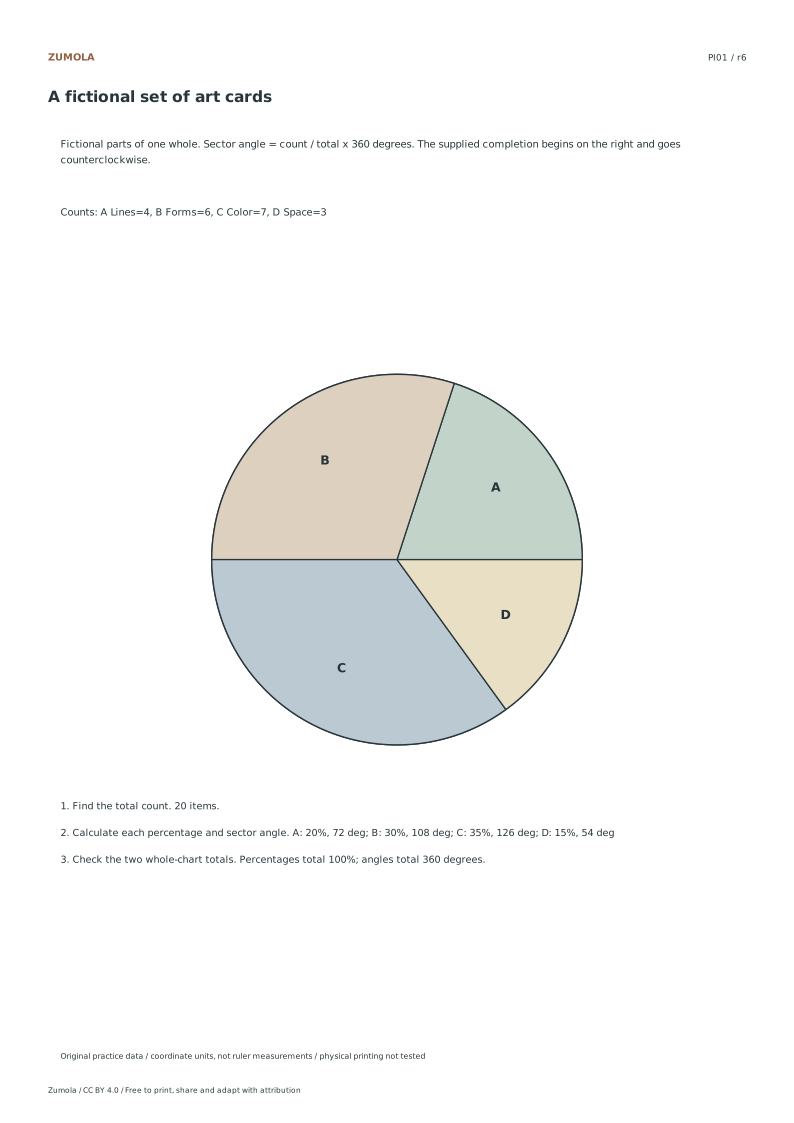
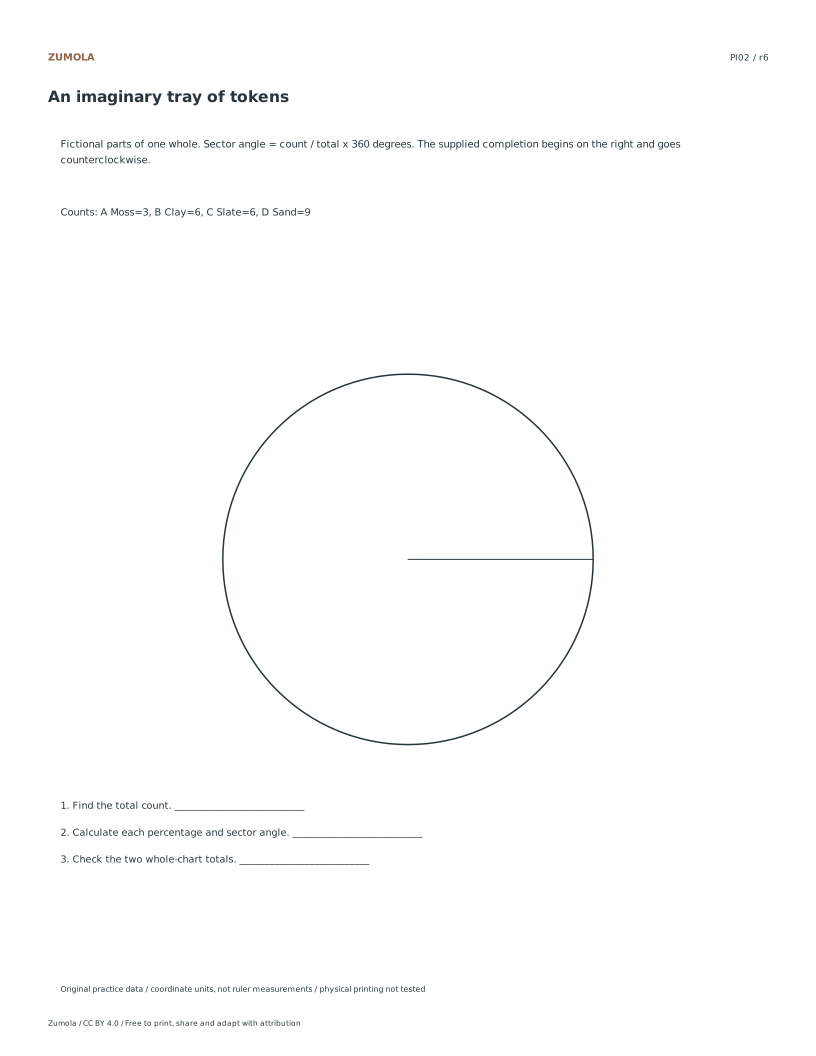
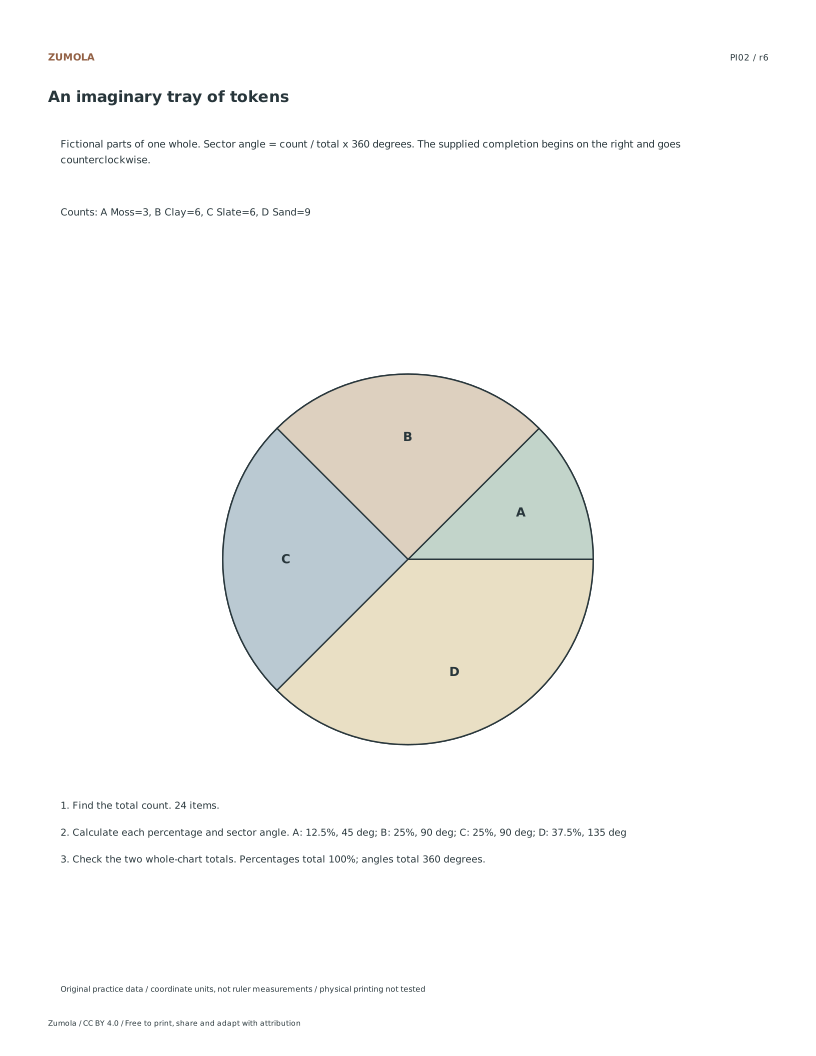
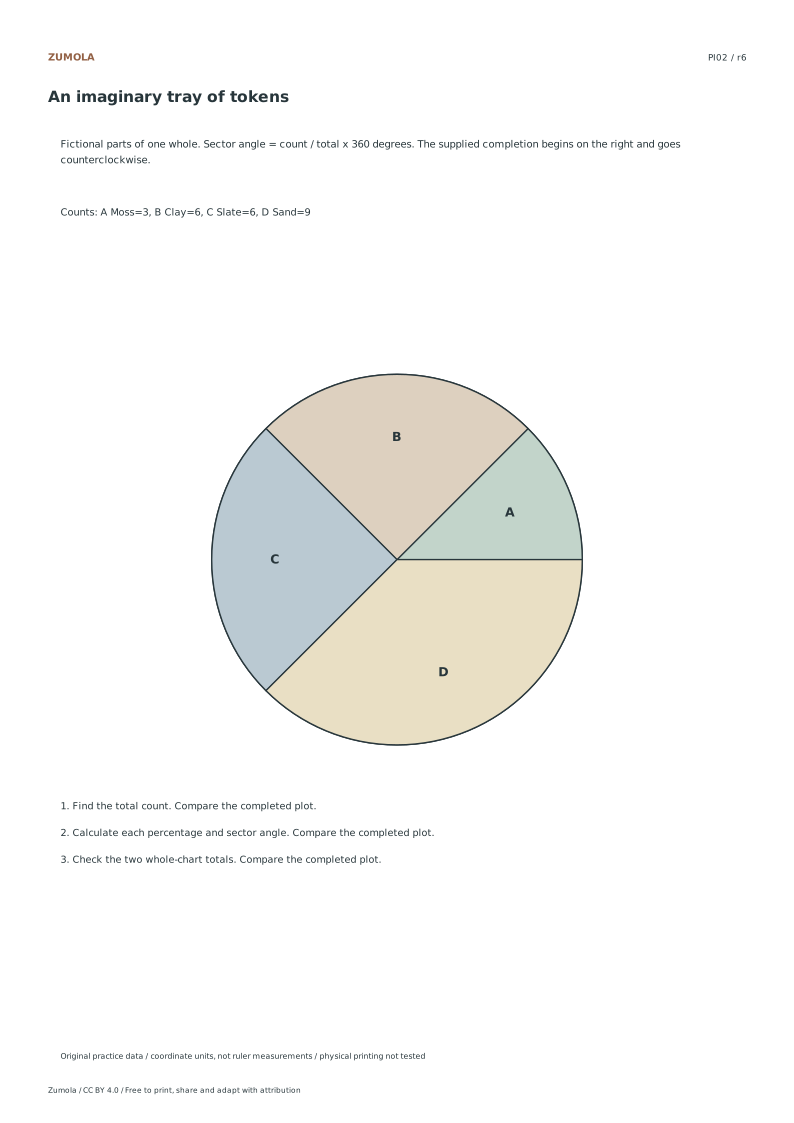
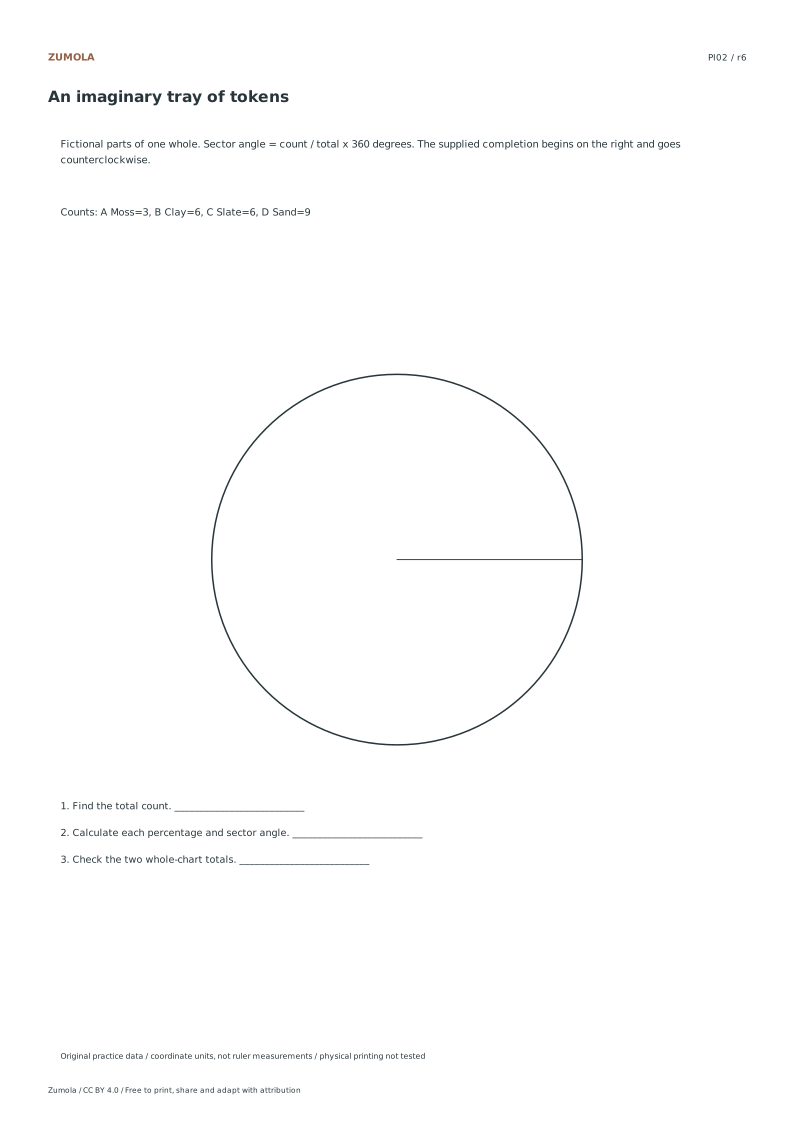
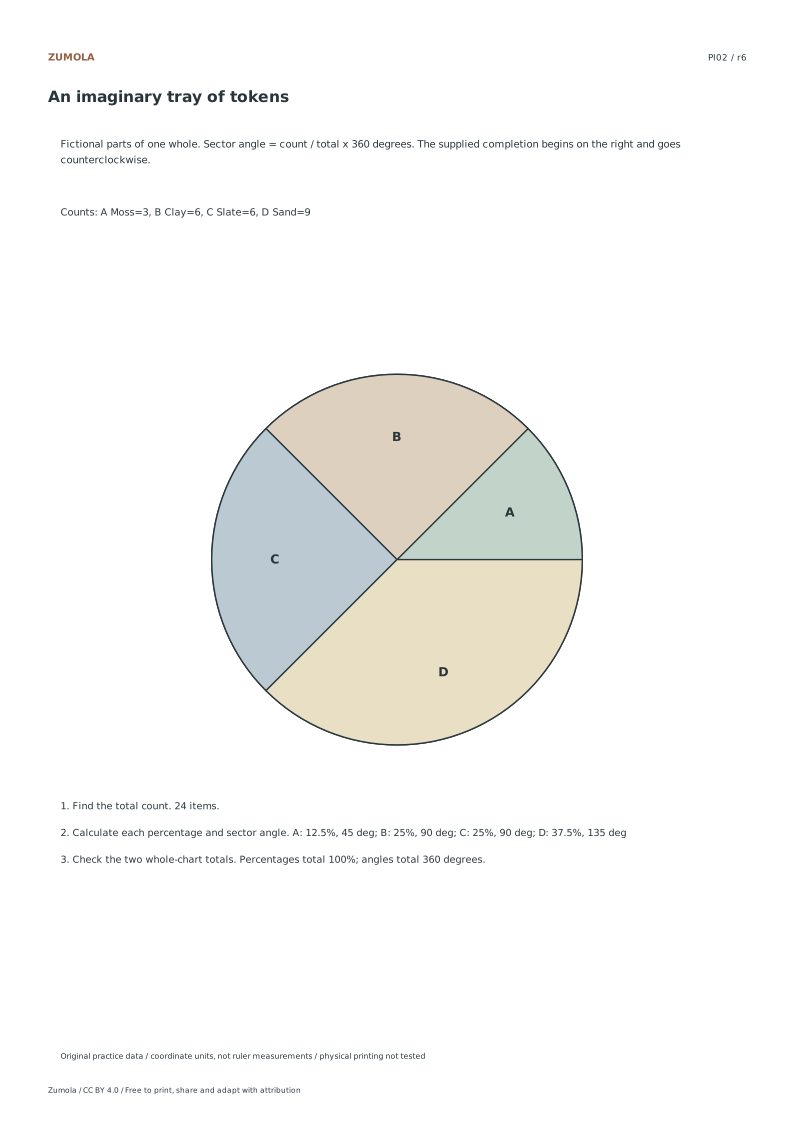
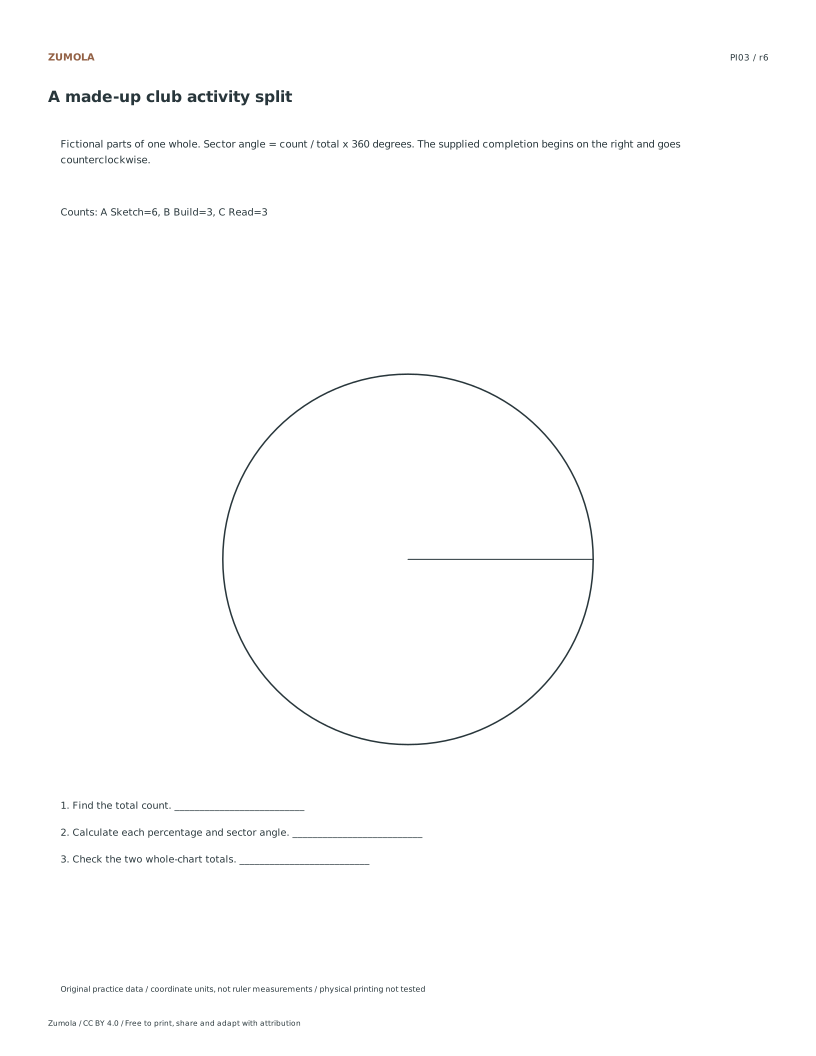
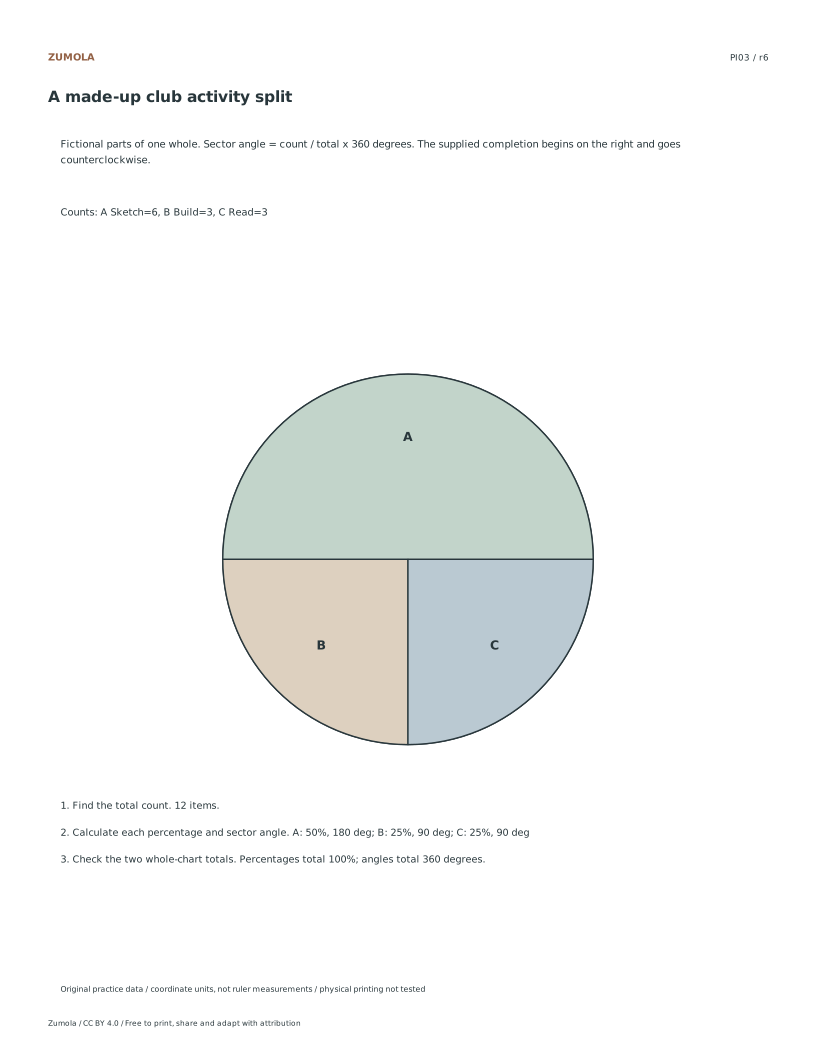
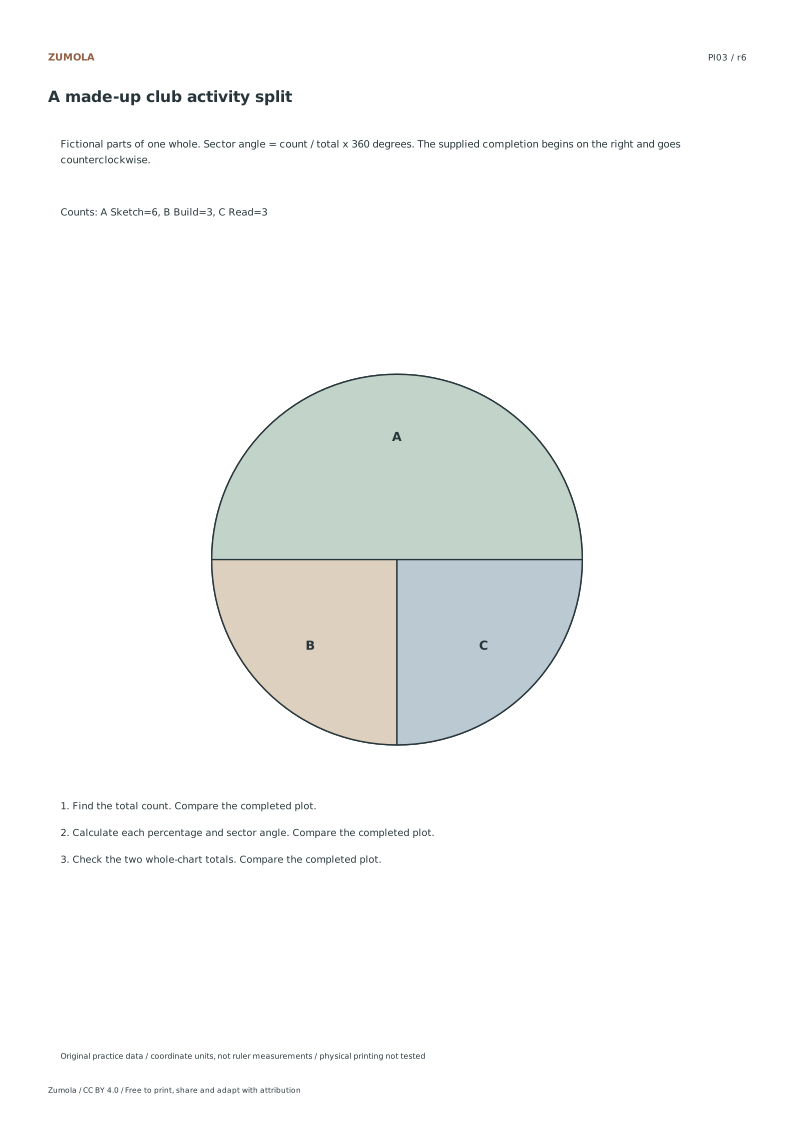
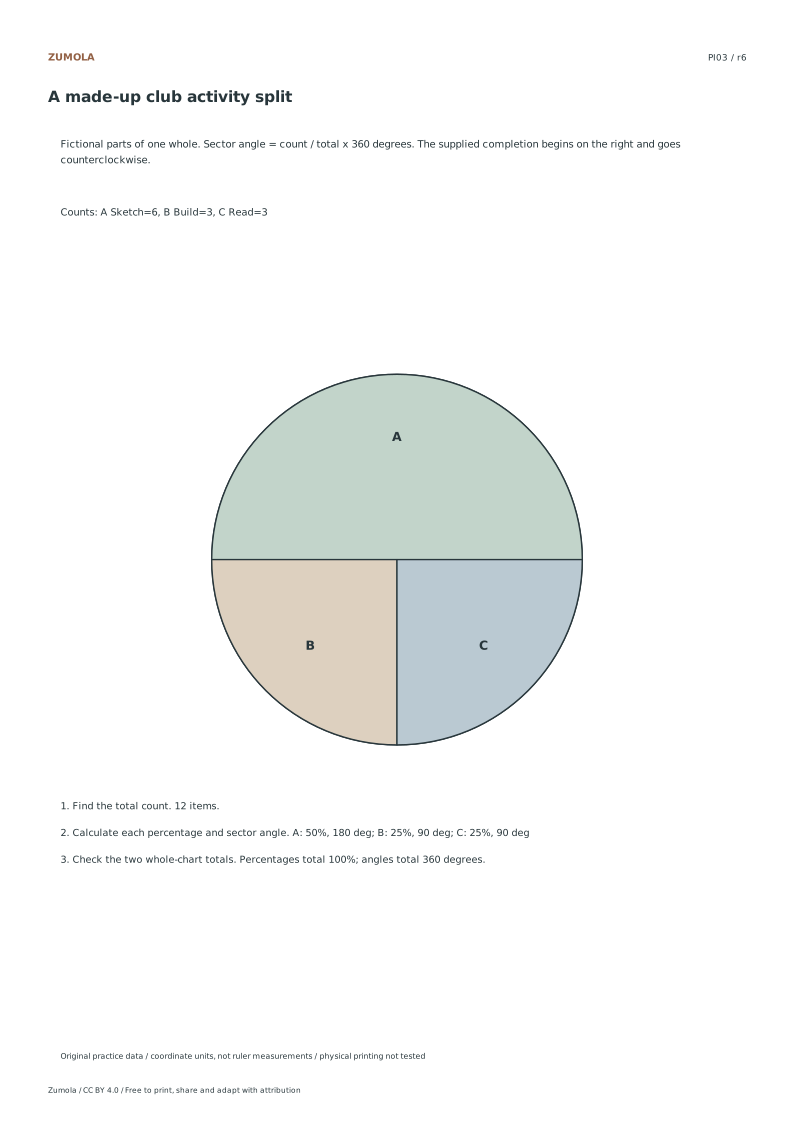
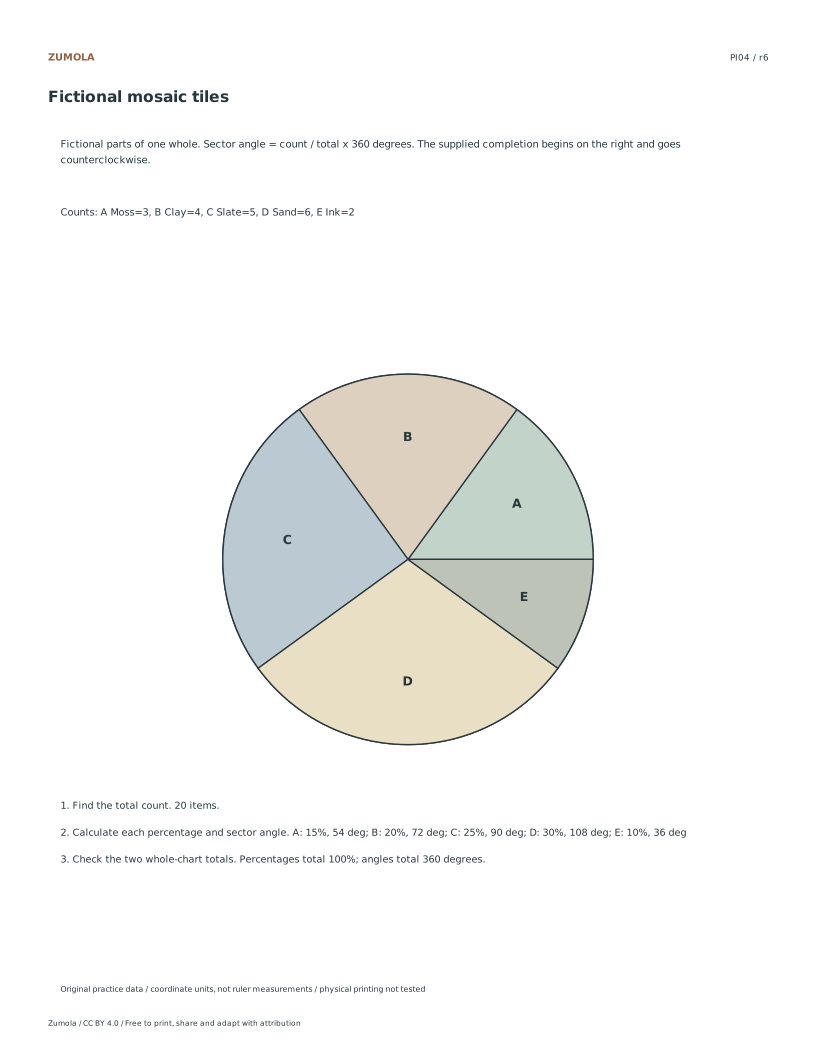
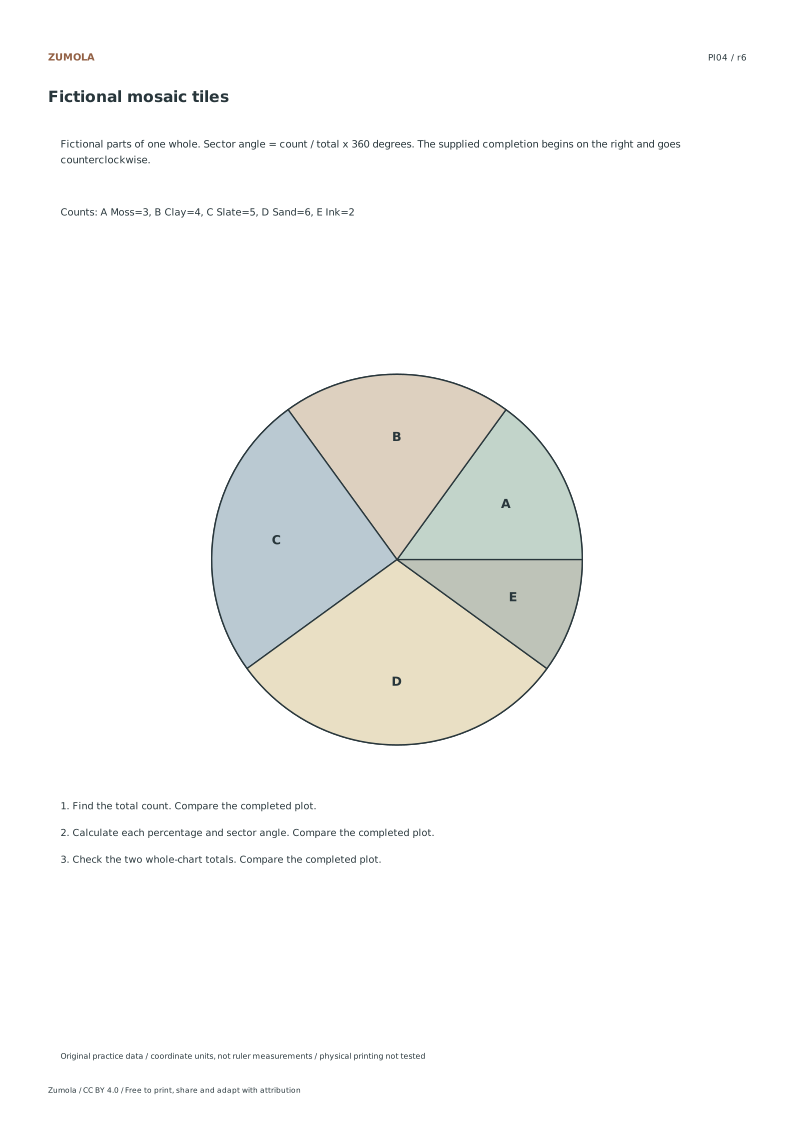
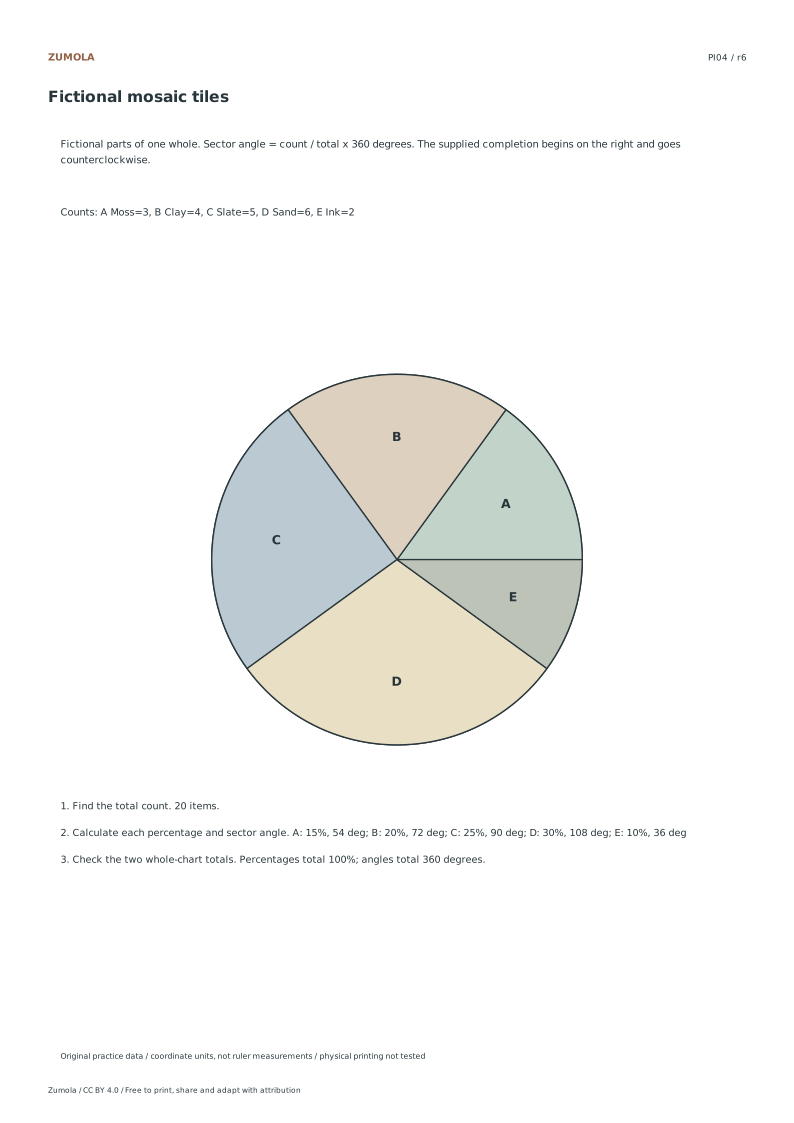
Convert four fictional category tables into percentages and sector angles. Label every slice and check that each complete chart accounts for the same whole.
4 part-of-whole tasks.
Counts, percentages and angles.
Keep the labels and margins readable
Choose the Letter or A4 file that matches your paper. Actual size / 100% preserves the designed layout; a different uniform print scale changes physical lengths but does not change the listed numbers or the arithmetic. Keep the whole chart and all labels inside the printable area. A ruler can help draw straight segments, but calculate from the stated numerical scale.
These files have digital geometry, arithmetic and page-boundary checks. Physical printer and classroom trials have not been completed. The resources are practice material, with no claim of curriculum certification or precision-instrument accuracy. The original files use CC BY 4.0: credit Zumola, link the license and indicate changes.
More ways to practice
Allocating angles when the division is not exact
A pie chart represents a whole as 360°. Each category's angle equals its count divided by the total count, multiplied by 360. When the total divides cleanly, every angle is a whole number and the sum is exactly 360. When it does not, individual angles may be fractional, and rounding each one independently can push the sum above or below 360.
The practical rule is to compute each angle to one decimal place, add them, and then adjust a single category by the small difference so the total is exactly 360. Record which category you adjusted and by how much, so a reader comparing your table to your chart can follow the reasoning. Never adjust more than one category unless the drift is large enough to distort a slice visibly.
- Add the counts to get the total, and write it at the top of the table.
- For each category, divide its count by the total, then multiply by 360.
- Round each angle to one decimal place and write it beside the count.
- Add the rounded angles and compare the sum with 360.
- Adjust one category by the difference, note the adjustment, and re-add to confirm 360.
A diagnostic check before you draw
Before committing ink to the circle, run a proportion check that does not depend on your angle arithmetic. The largest count should produce the largest angle, and the ratio of any two angles should match the ratio of their counts. If two categories have counts in a 2:1 ratio but your angles are not close to 2:1, an arithmetic slip has occurred somewhere in the table.
A second check concerns the total. If your counts sum to a number you did not expect, stop and recount before converting. A wrong total silently rescales every angle, and the chart will still sum to 360, so the sum check alone will not catch it. Write the total in words as well as digits, for example 'total 25 tokens', to make a mismatch obvious.
- Compare the largest and smallest counts against their angles.
- Check that any pair of counts in a simple ratio produces angles in the same ratio.
- Recount the raw counts and confirm the written total matches.
- Confirm every category in the table appears as a labelled slice.
Drawing order and label placement
Start at the top of the circle and work clockwise in the order of your table. Placing slices in a fixed order makes the chart reproducible and lets a second person check it against the table without guessing. Mark each boundary with a light radial line before shading, so a misread protractor can be corrected without erasing a filled slice.
Labels should sit inside the slice when the angle is large enough to hold text, and outside with a short leader line when it is not. Include the category name and either the count or the angle, not both crowded together. Keep the same unit across all labels; mixing counts and percentages in one chart invites misreading.
- Draw a light vertical radius from the centre to the top as the starting line.
- Measure each angle clockwise from the previous boundary and mark it lightly.
- Shade slices only after all boundaries are marked and the sum is confirmed.
- Place labels inside large slices and outside small ones with a leader line.
Try this example
A fictional tray holds 25 tokens in four colours: red 10, blue 7, green 5, yellow 3. Convert the counts to sector angles to one decimal place, adjust for rounding, and confirm the total is 360°.
Show the worked explanation
Total is 25. Red: 10/25 × 360 = 144.0°. Blue: 7/25 × 360 = 100.8°. Green: 5/25 × 360 = 72.0°. Yellow: 3/25 × 360 = 43.2°. Sum: 144.0 + 100.8 + 72.0 + 43.2 = 360.0°, so no adjustment is needed. Ratio check: red to blue counts are 10:7, and angles 144.0:100.8 reduce to the same 10:7 ratio, confirming the arithmetic.
Common mistakes
- Rounding every angle independently and accepting a total of 359° or 361°. Add the rounded angles, then adjust one category by the difference and record the adjustment so the total is exactly 360°.
- Using a wrong total count, which rescales all angles while still summing to 360°. Recount the raw counts and write the total in words beside the digits before converting any angle.
- Mixing counts and percentages in the slice labels of one chart. Choose one unit for all labels and apply it consistently, adding the other unit only in the accompanying table.
Check your work
- Every category in the table appears as a labelled slice.
- Each angle is computed as count divided by total, multiplied by 360.
- Rounded angles are summed and any difference from 360° is adjusted in one recorded category.
- Angle ratios match count ratios for at least one checked pair.
- The written total matches a recount of the raw counts.
- Labels use one consistent unit across all slices.
- Slices are drawn clockwise in table order from a stated starting line.
Questions before you start
What should I do if an angle comes out as a repeating decimal?
Round to one decimal place, carry the small difference into a single category, and note which one you adjusted so the total is exactly 360°.
Does a chart that sums to 360° prove the angles are correct?
No. A wrong total count still produces angles summing to 360°, so also check that angle ratios match count ratios and that the written total matches a recount.
Should slices always start at the top of the circle?
Starting at the top and moving clockwise in table order is a reliable convention, but any fixed starting point works as long as the order is stated and followed consistently.