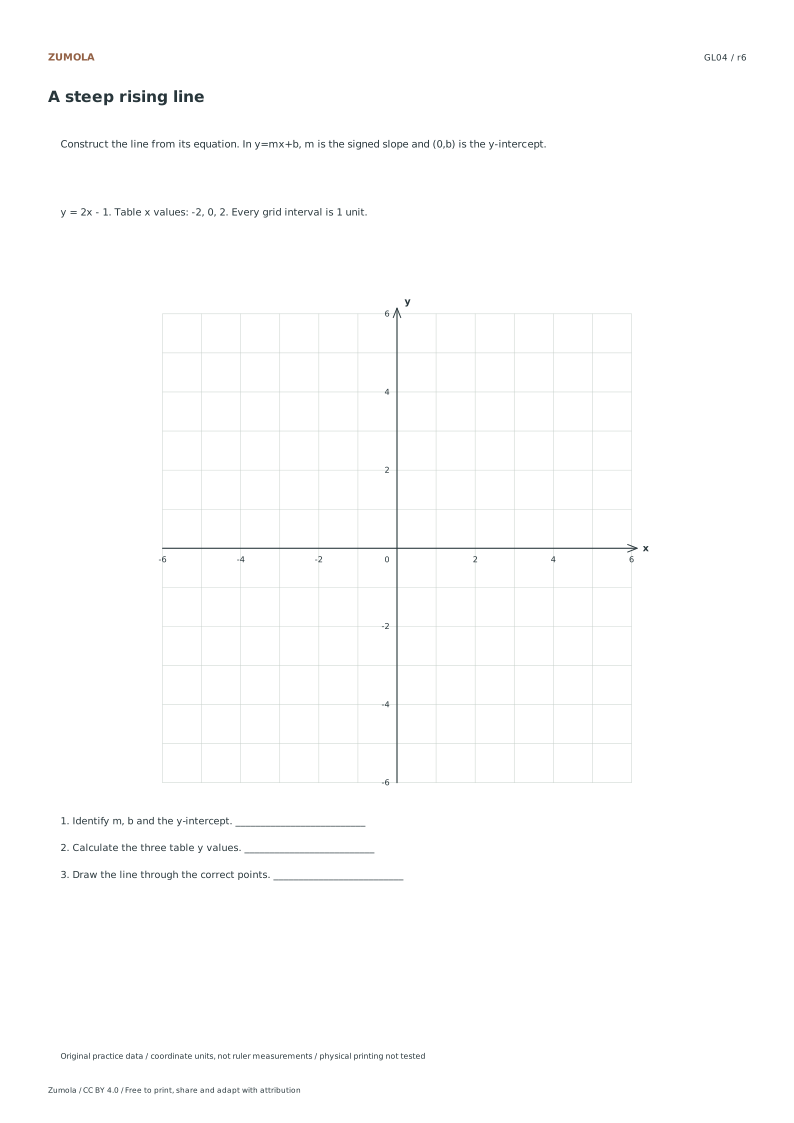
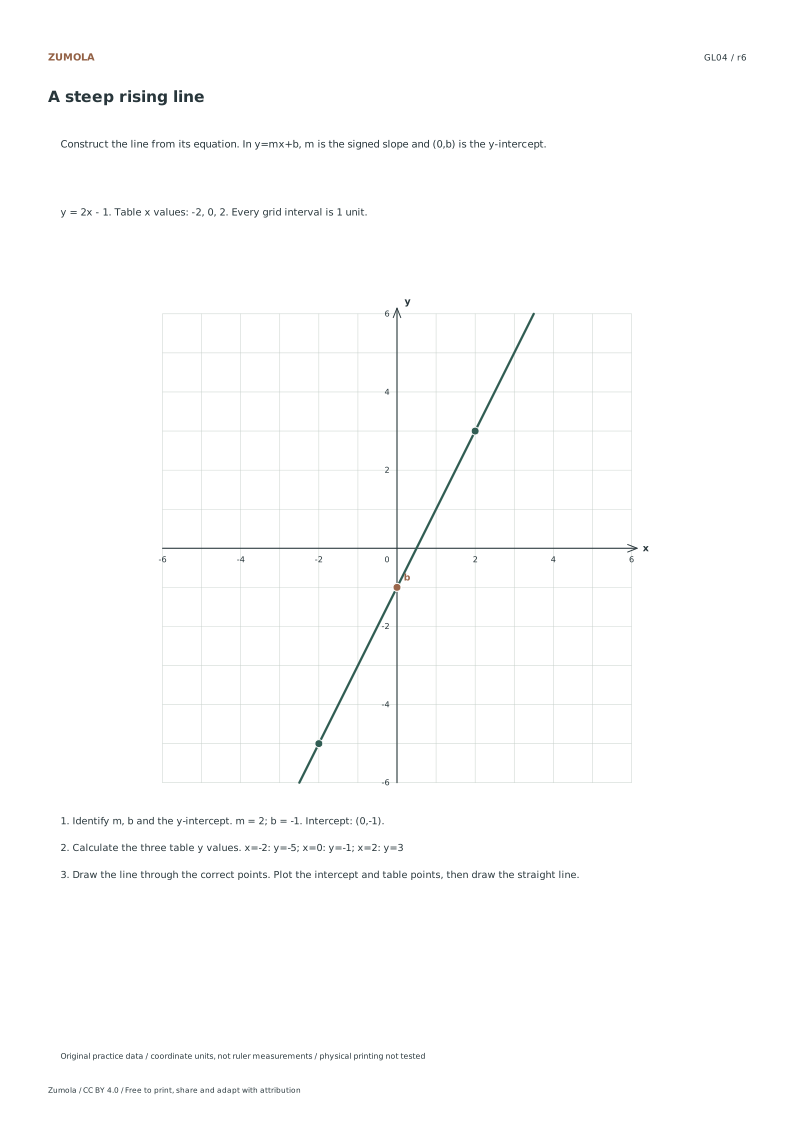
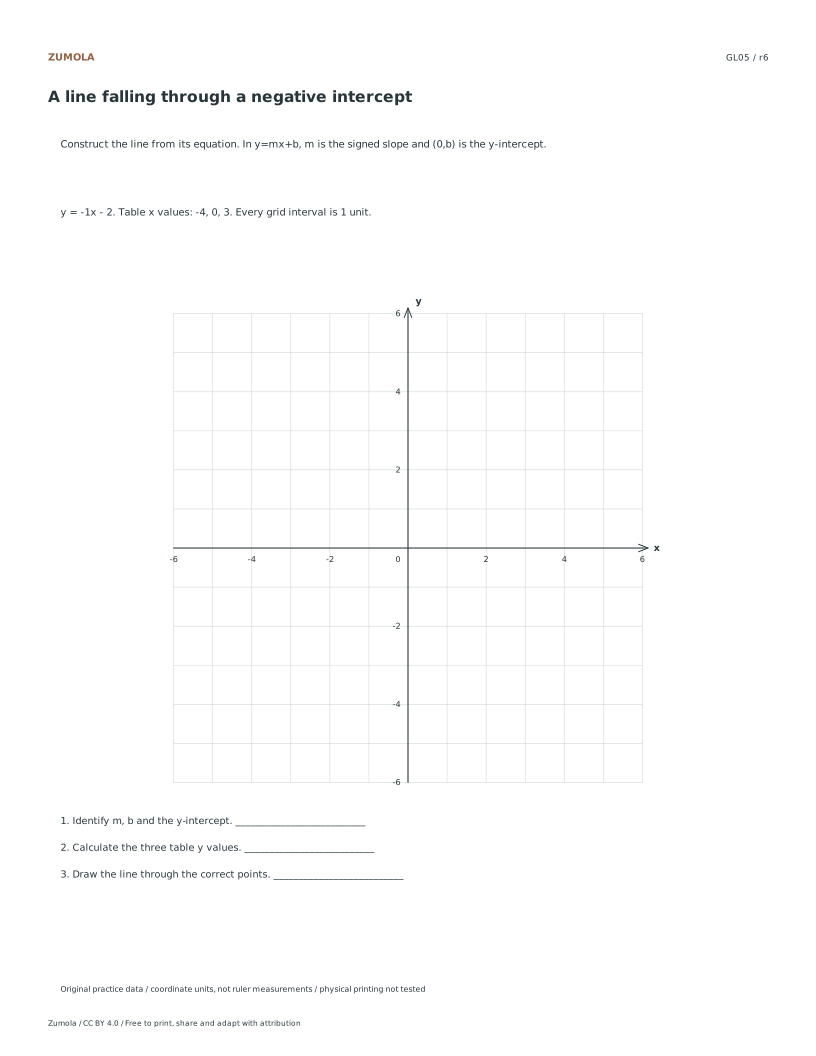
Graphing slope-intercept form. Build a line from its rule.
Turn six equations in y=mx+b into coordinate tables and straight-line graphs. Locate the intercept, use the slope and verify another point before extending your line.
Turn six equations in y=mx+b into coordinate tables and straight-line graphs. Locate the intercept, use the slope and verify another point before extending your line.
Use the student pack for an attempt, then compare the separate reference or worked answer. Every case is original. All PDF and editable SVG resources are free without signup; each collection pack repeats its individual sheets in the same order.
Choose your paper and download
Download paper size
Every worksheet and answer is free. No signup.
The complete collection
Keep practice and answers separate.
Use the student pack first, then compare the reference or answer. Packs are PDFs; individual sheets below also include editable SVG files. The paper choice applies to every download.
The examples and datasets are made for these worksheets. They are not measured classroom results, published textbook questions or evidence about real people. Axis values and the supplied data determine the answers; paper measurements do not replace those numbers.
Check the first case
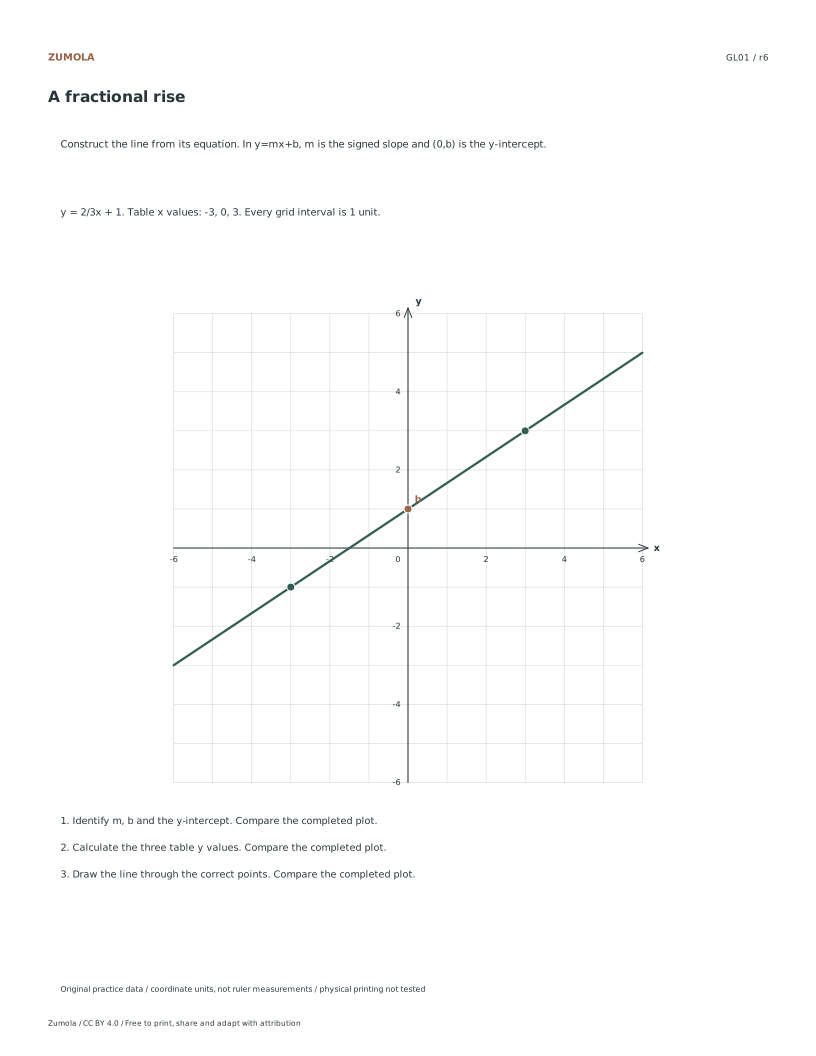
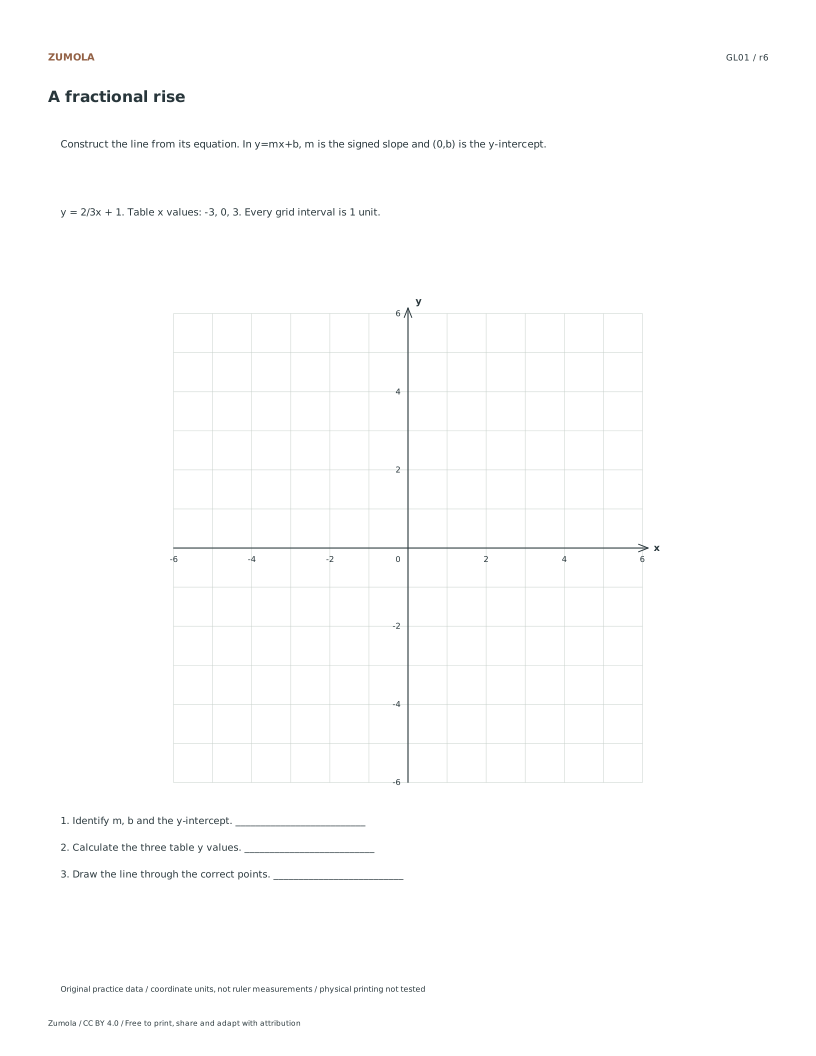
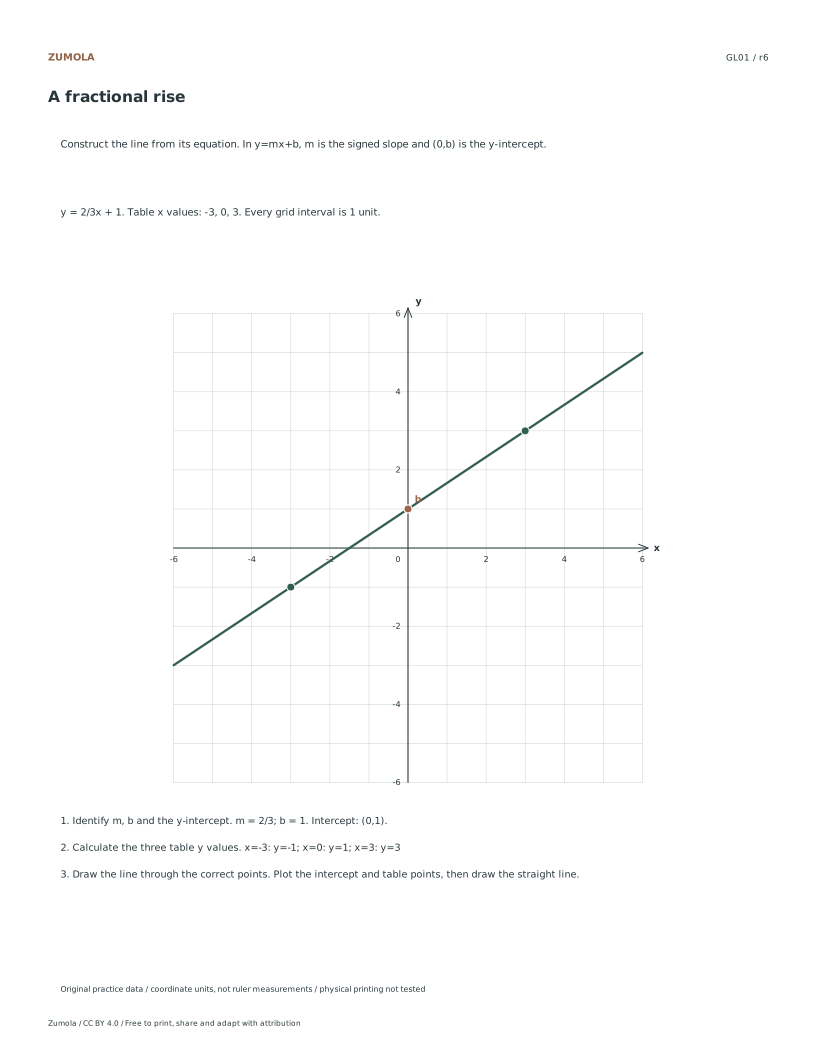
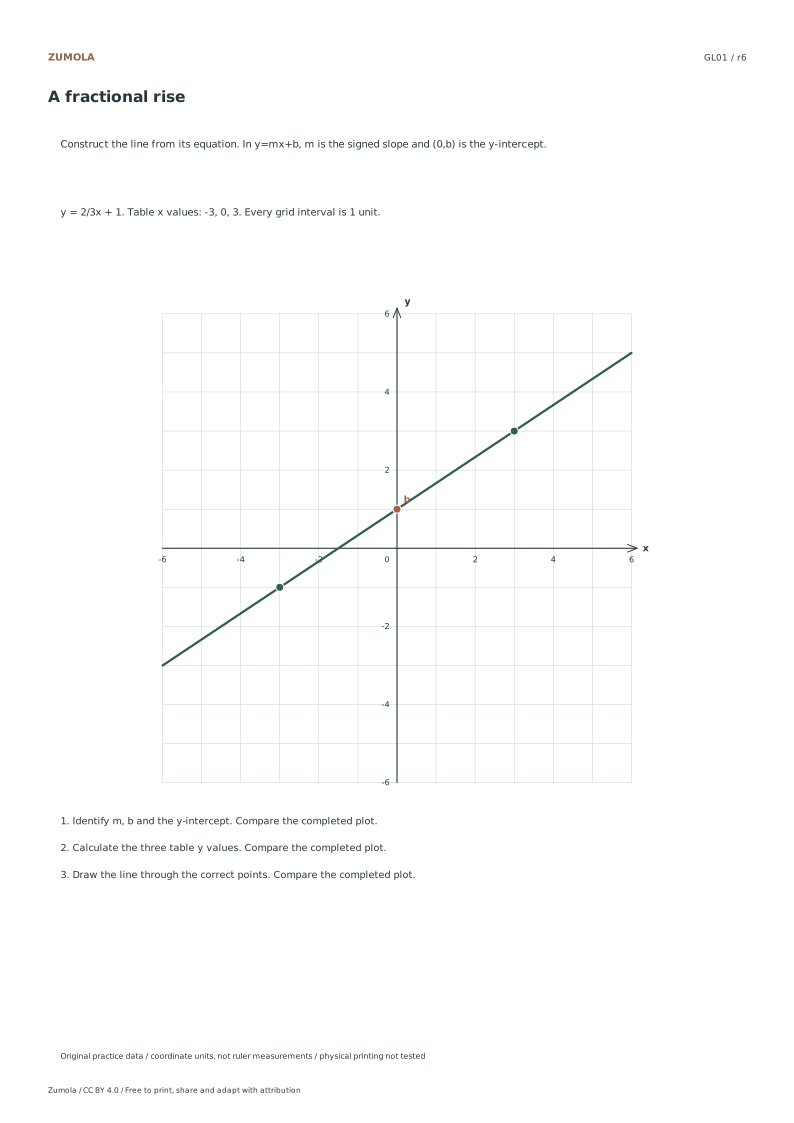
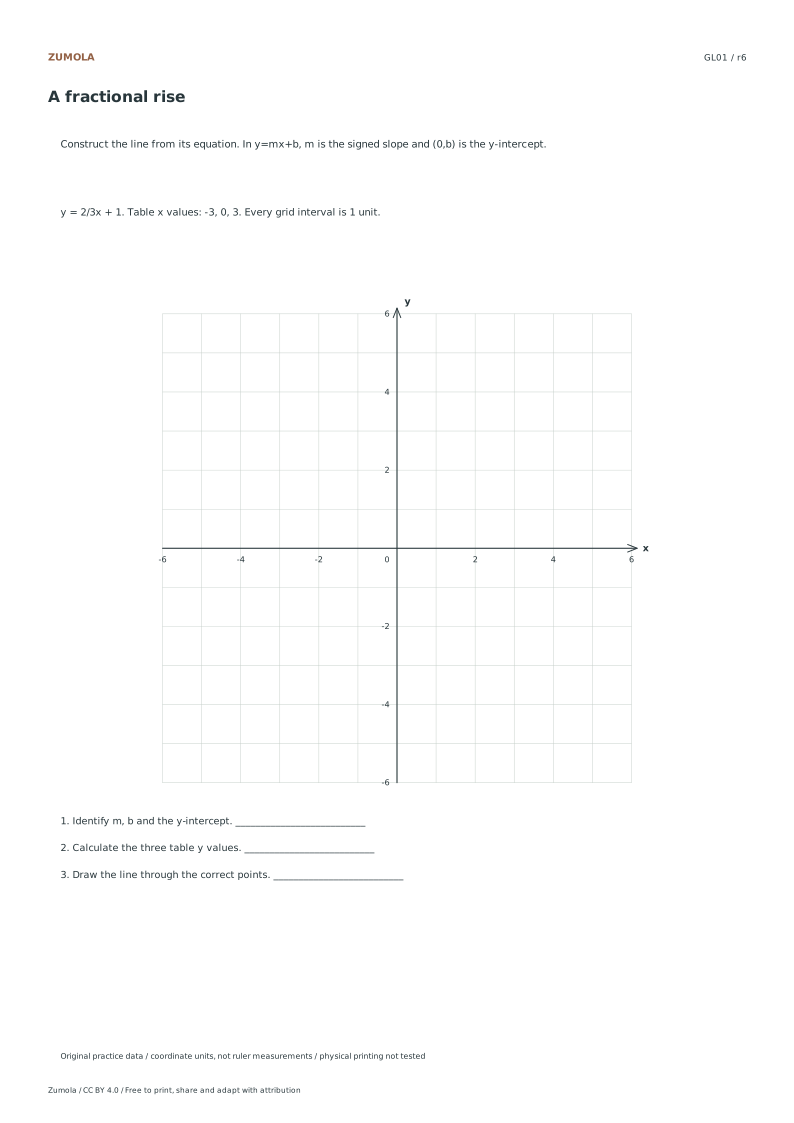
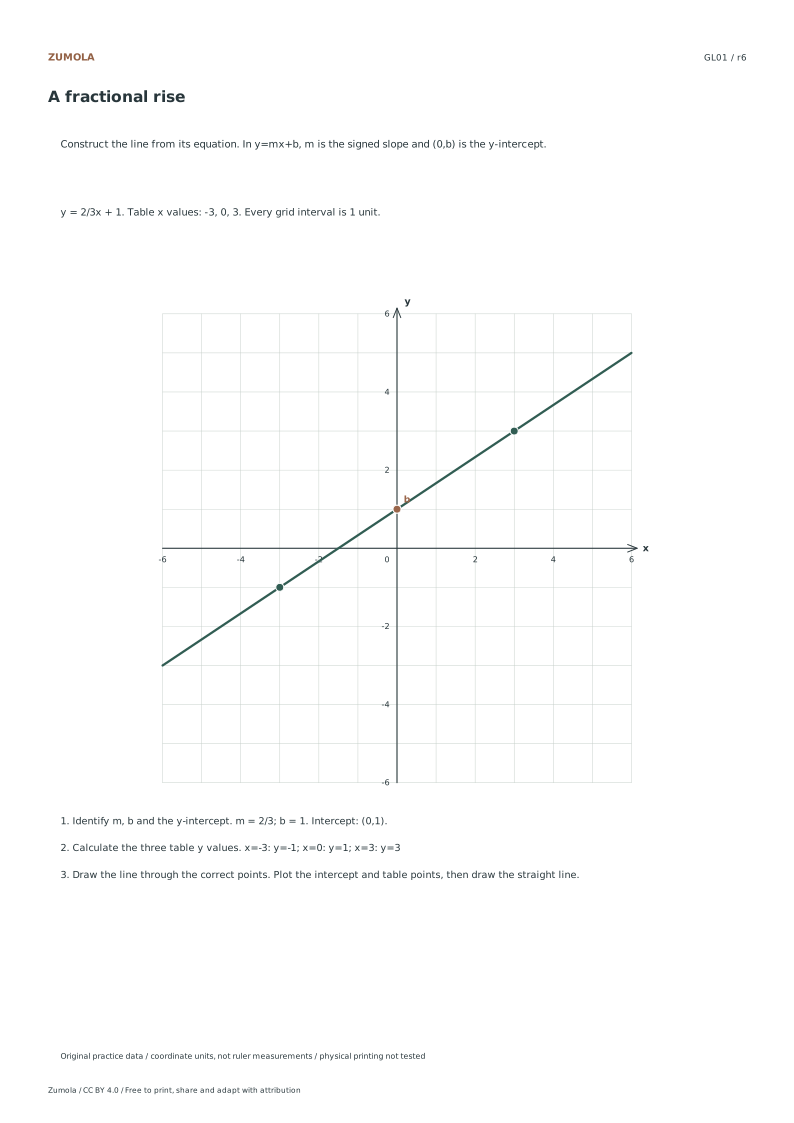
GL01: A fractional rise
Check
Worked result
1
m = 2/3; b = 1. Intercept: (0,1).
2
x=-3: y=-1; x=0: y=1; x=3: y=3
3
Plot the intercept and table points, then draw the straight line.
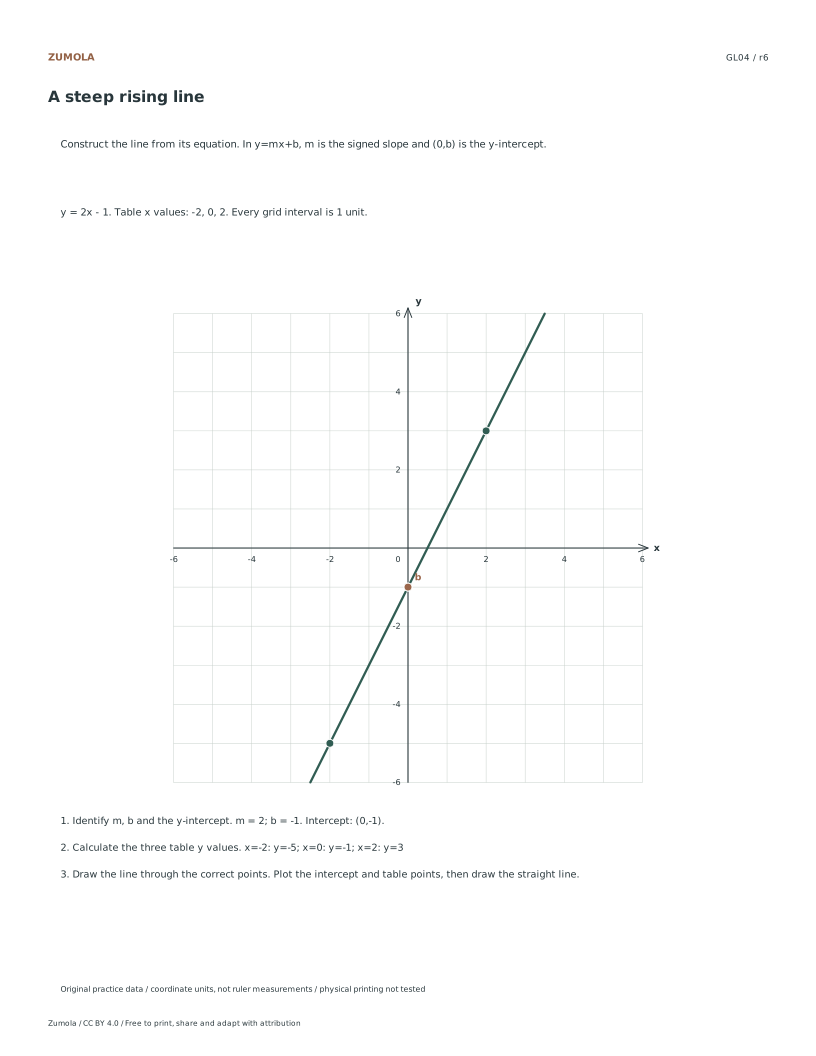
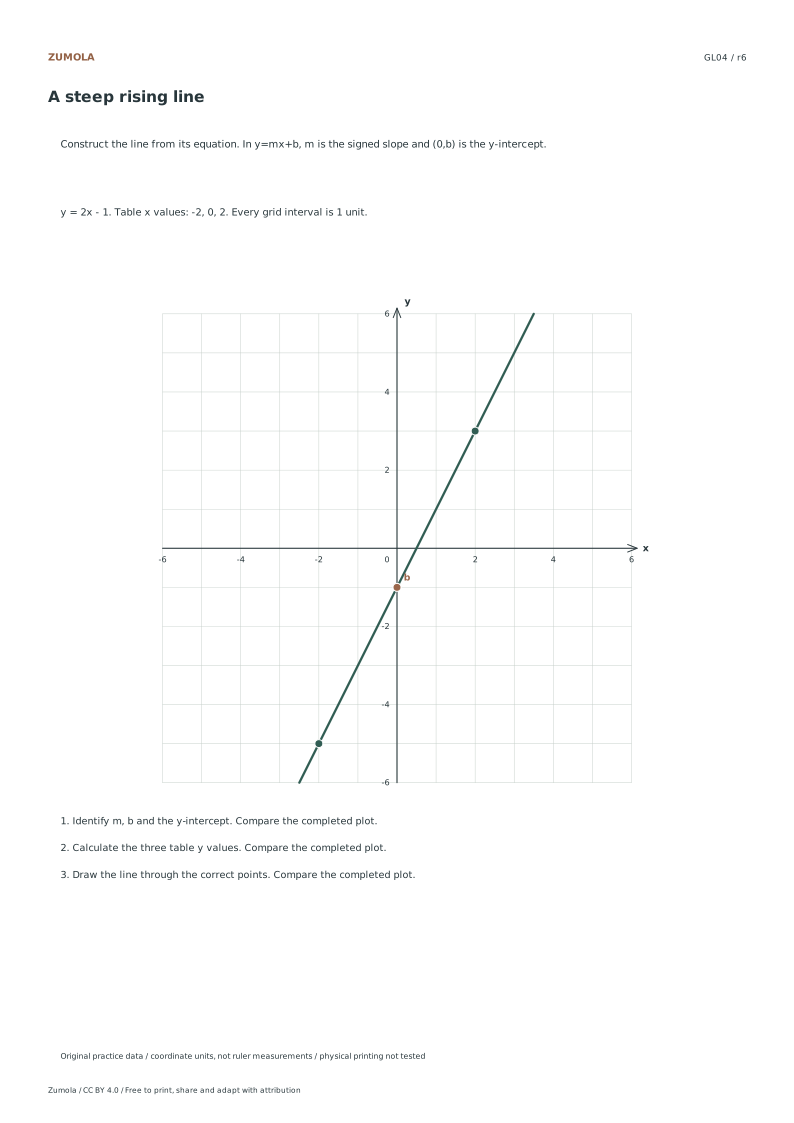
The table gives one worked case so you can check the method. The separate answer files contain the completed plots and results for every case. Equivalent fractions or another correct pair of collinear points can represent the same line.
Work through the graph
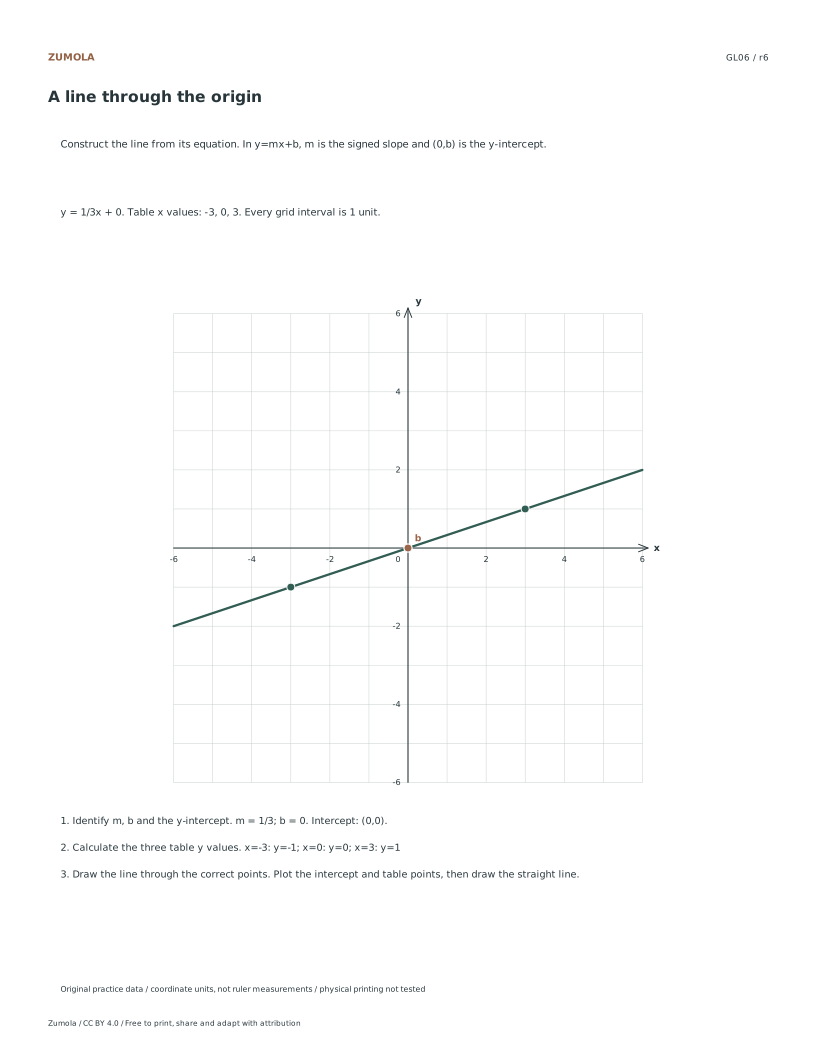
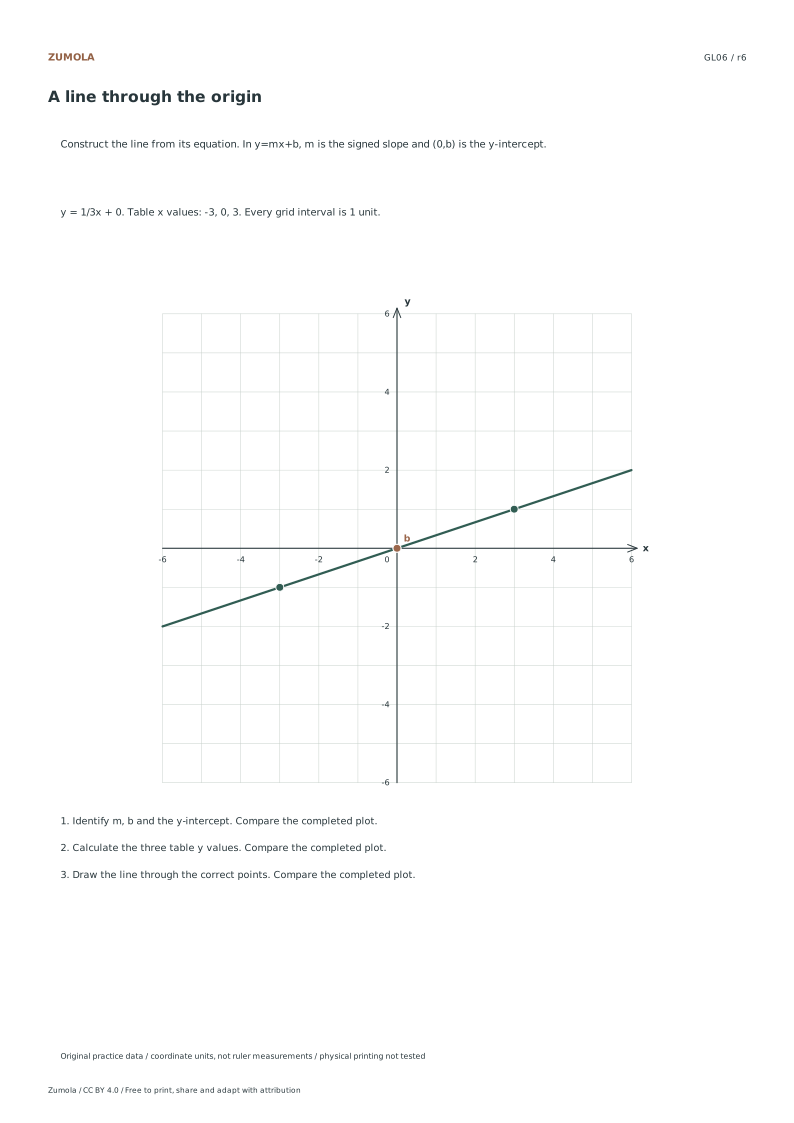
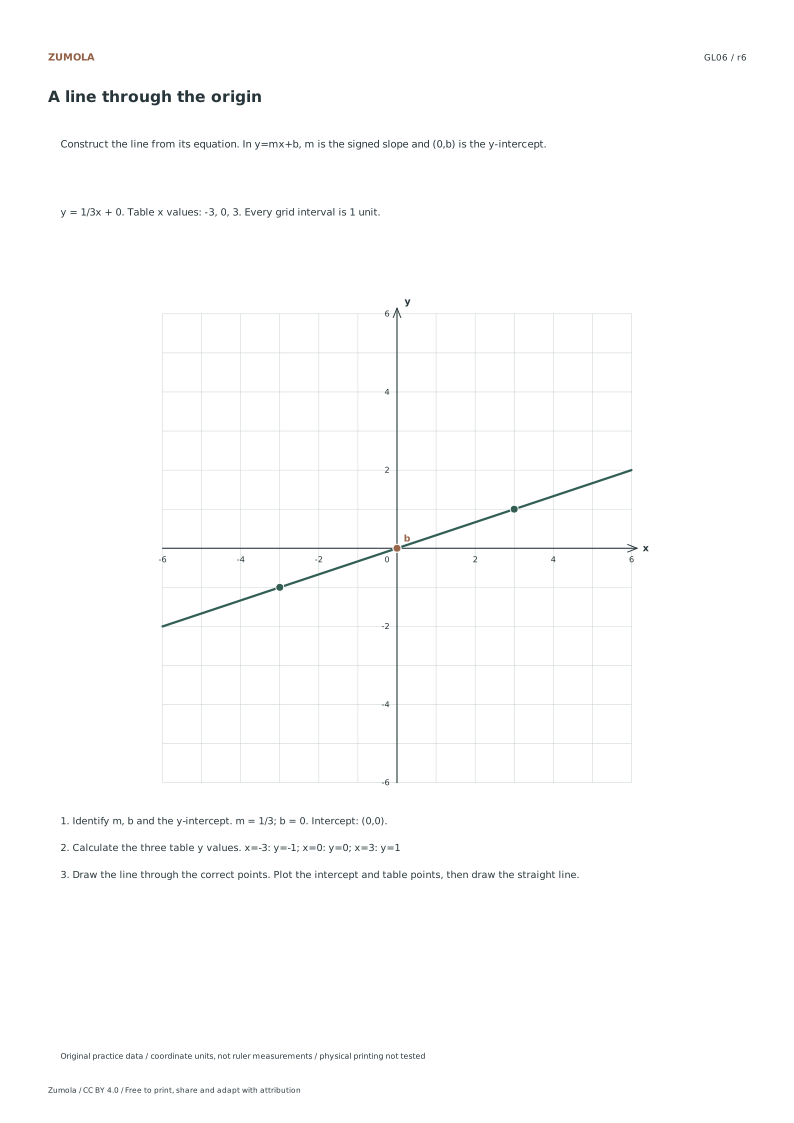
Identifying Slope and Intercept Begin by locating the specific slope and y-intercept values defined in each case. For example, in case GL01, the slope is two-thirds and the intercept is one. These values dictate the line's direction and starting point on the vertical axis. Students must recognize that the slope represents the rise over run ratio, while the intercept marks where the line crosses the y-axis. This initial identification ensures the plotted line matches the linear equation structure y equals mx plus b, providing a clear foundation for subsequent plotting steps without relying on external measurement tools.
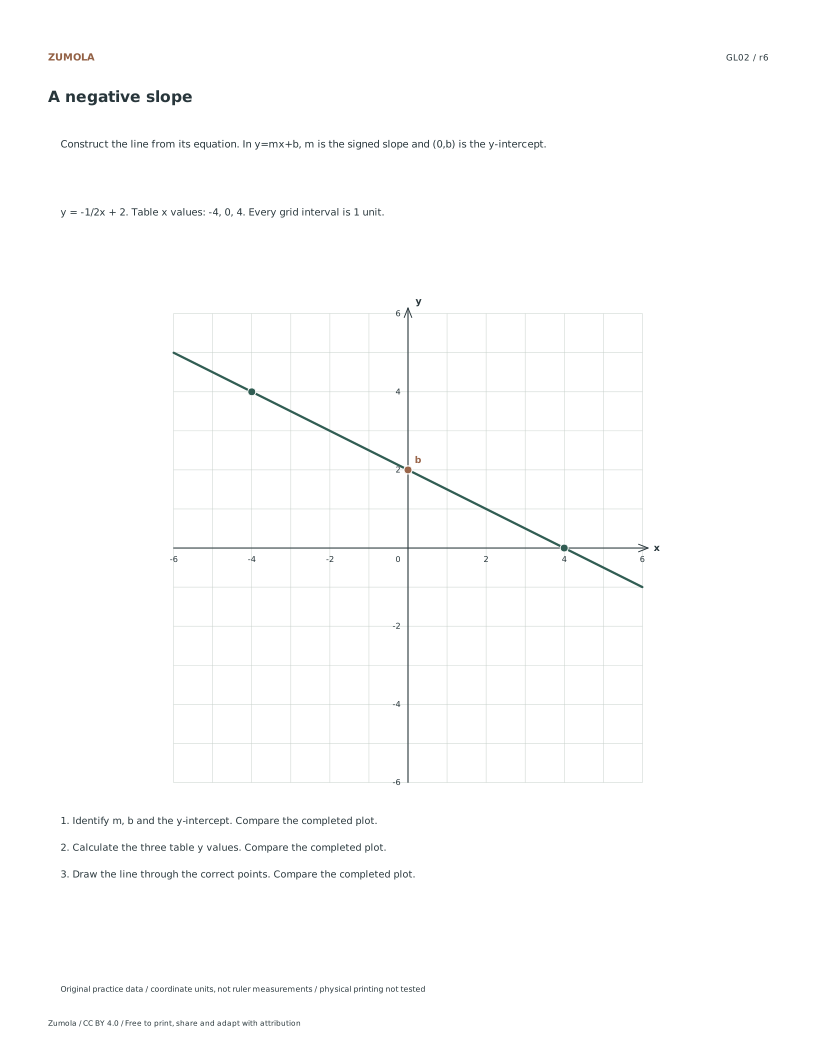
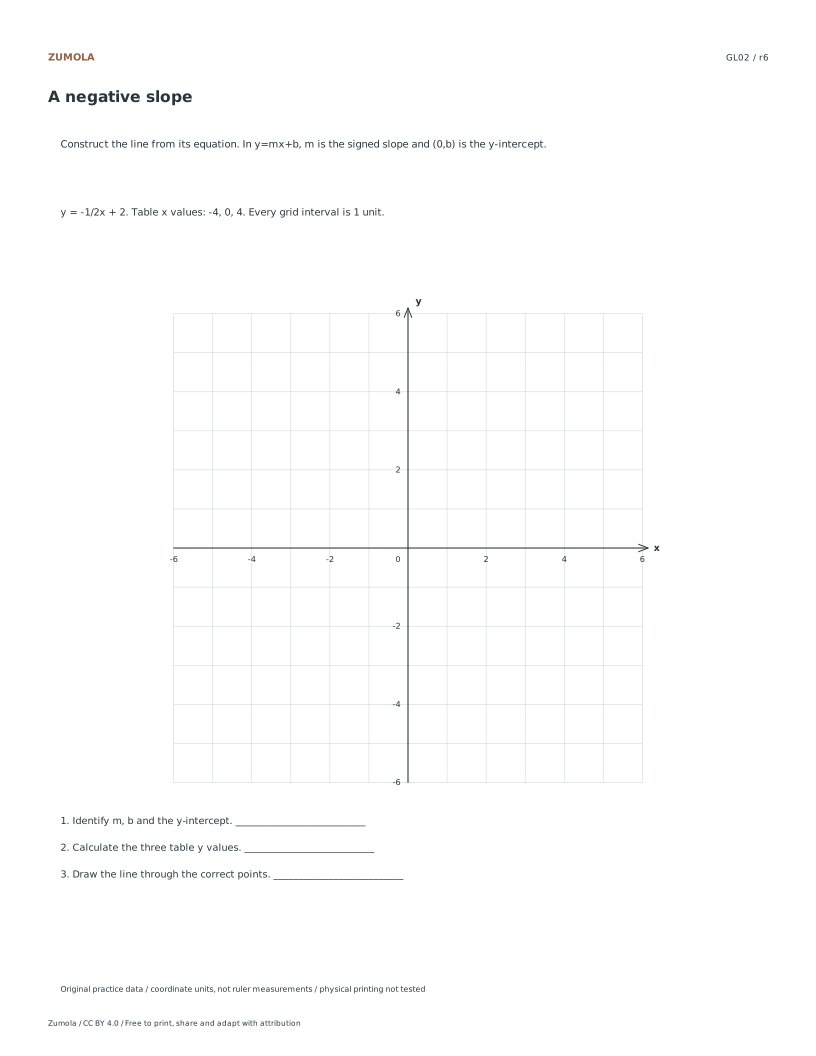
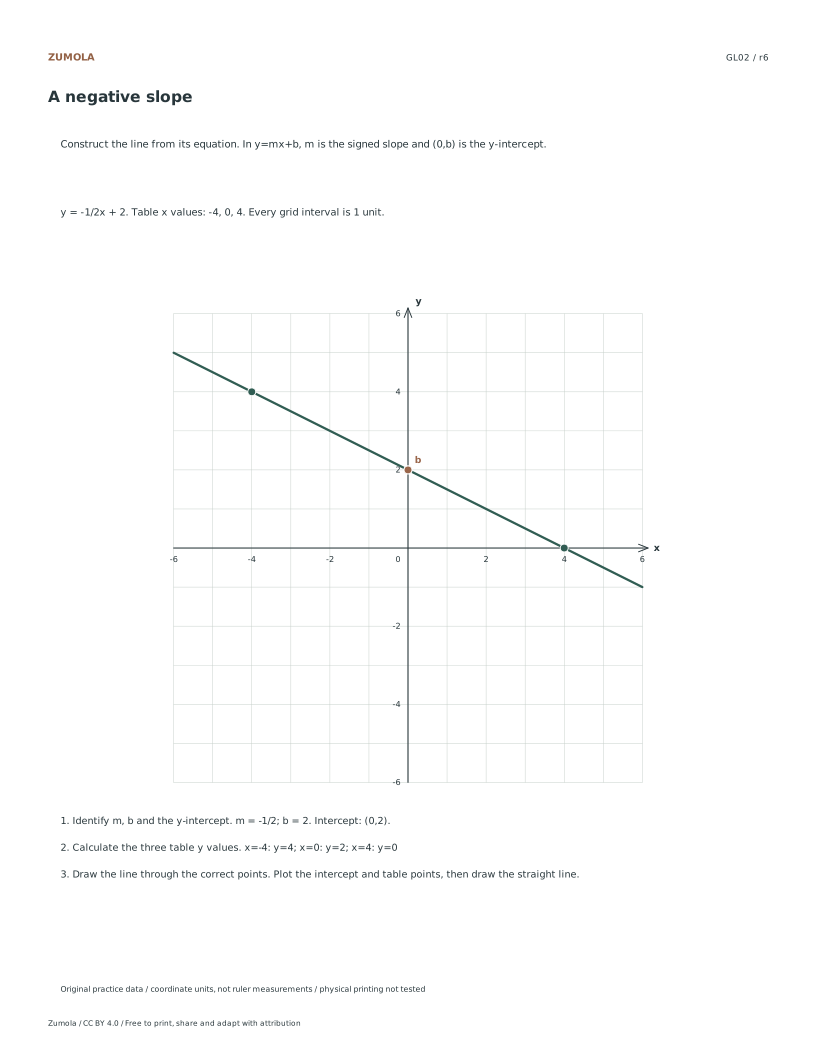
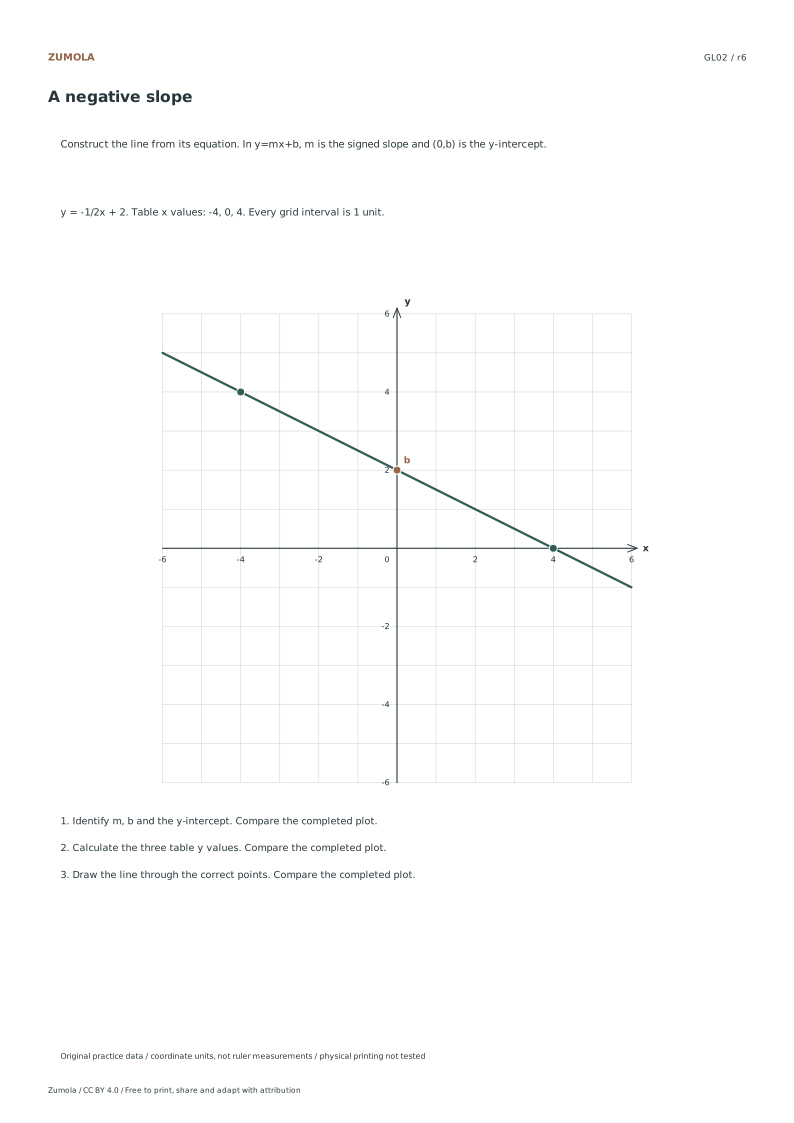
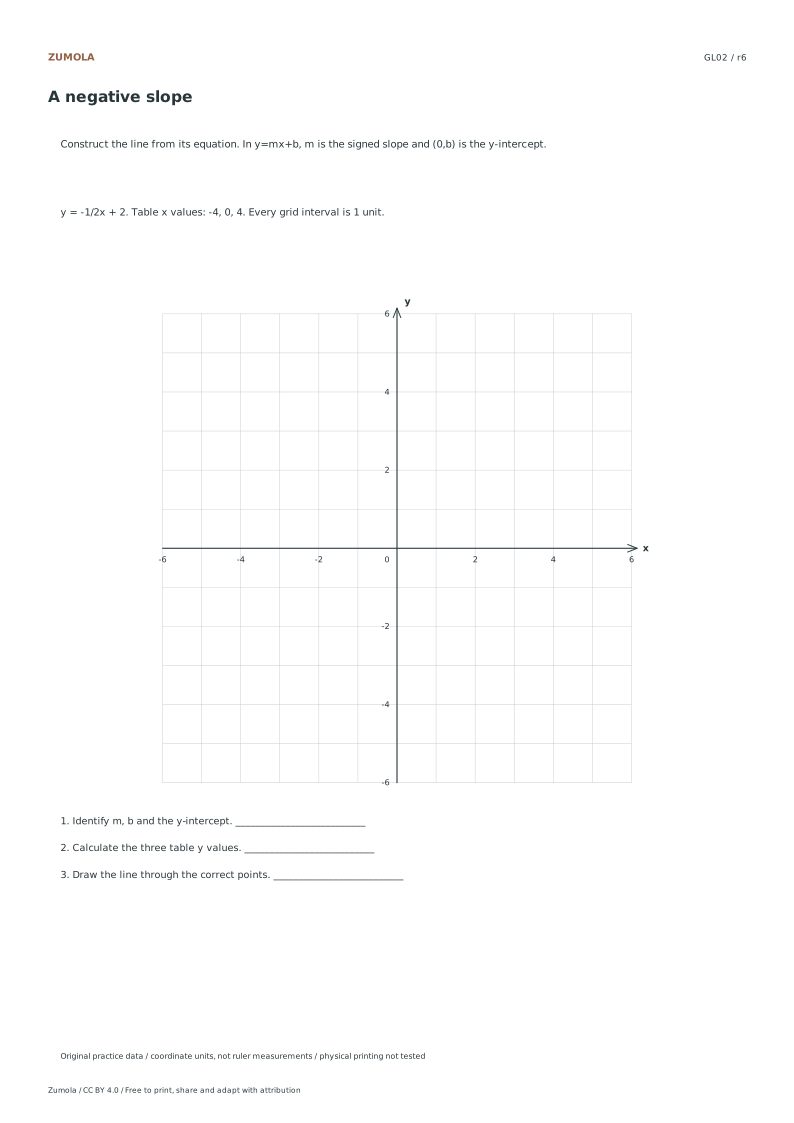
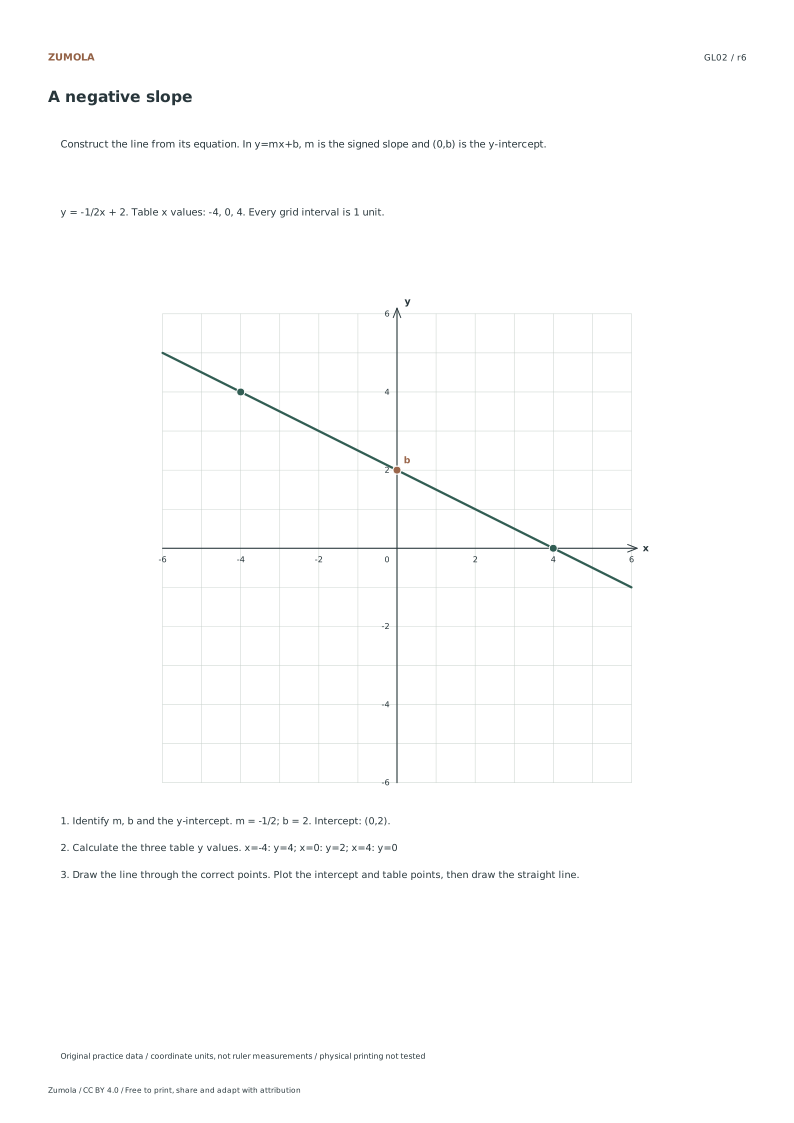
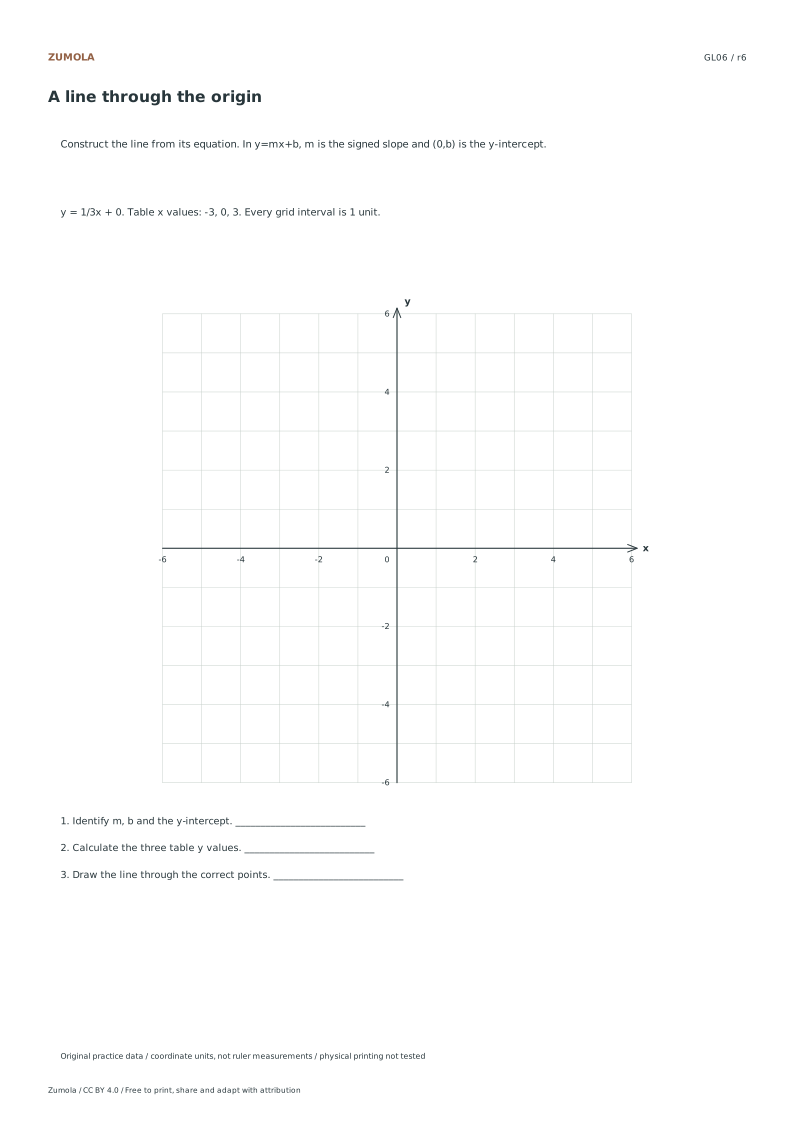
Calculating Coordinate Points Substitute the provided x-values into the equation to determine corresponding y-values. For instance, in case GL02, use x-values of negative four, zero, and four with a slope of negative one-half and intercept of two. Calculate each y-value precisely using substitution rather than physical estimation. This step generates three distinct coordinate pairs that serve as anchor points for the line. Accurate calculation ensures the plotted points align correctly with the grid, allowing students to verify their arithmetic before moving to the visual plotting phase on the empty labeled grid.
Draw and check a third point Plot the y-intercept at (0,b), then use the signed slope to locate another point. A positive run paired with a negative rise moves right and down. Alternatively, calculate the three supplied table values before drawing. A straightedge can help join collinear points; it does not supply the numerical slope. Check that every table point lies on the same line. For GL02, x=-4,0,4 gives y=4,2,0. If a point misses the line, recheck its substitution and axis position before changing the equation.
Checks that catch common errors
Watch for
Check instead
Treating the number of tick marks as the rise or run.
Count the numerical intervals between positions. Read each axis scale and use the calculated coordinate differences.
Assuming the vertical line equation is included in the y equals mx plus b format for all cases.
Recognize that vertical lines cannot be written in slope-intercept form, so the resource focuses exclusively on non-vertical lines where slope and intercept are clearly defined and calculable.
Confusing the task of constructing a line from an equation with reading values from an already graphed line.
Focus on the construction process by calculating points from the given equation and plotting them, rather than attempting to interpret pre-existing graphical data which is a distinct skill.
Keep the labels and margins readable
Choose the Letter or A4 file that matches your paper. Actual size / 100% preserves the designed layout; a different uniform print scale changes physical lengths but does not change the listed numbers or the arithmetic. Keep the whole chart and all labels inside the printable area. A ruler can help draw straight segments, but calculate from the stated numerical scale.
These files have digital geometry, arithmetic and page-boundary checks. Physical printer and classroom trials have not been completed. The resources are practice material, with no claim of curriculum certification or precision-instrument accuracy. The original files use CC BY 4.0: credit Zumola, link the license and indicate changes.
Useful answers
Where do I start when the intercept is negative?
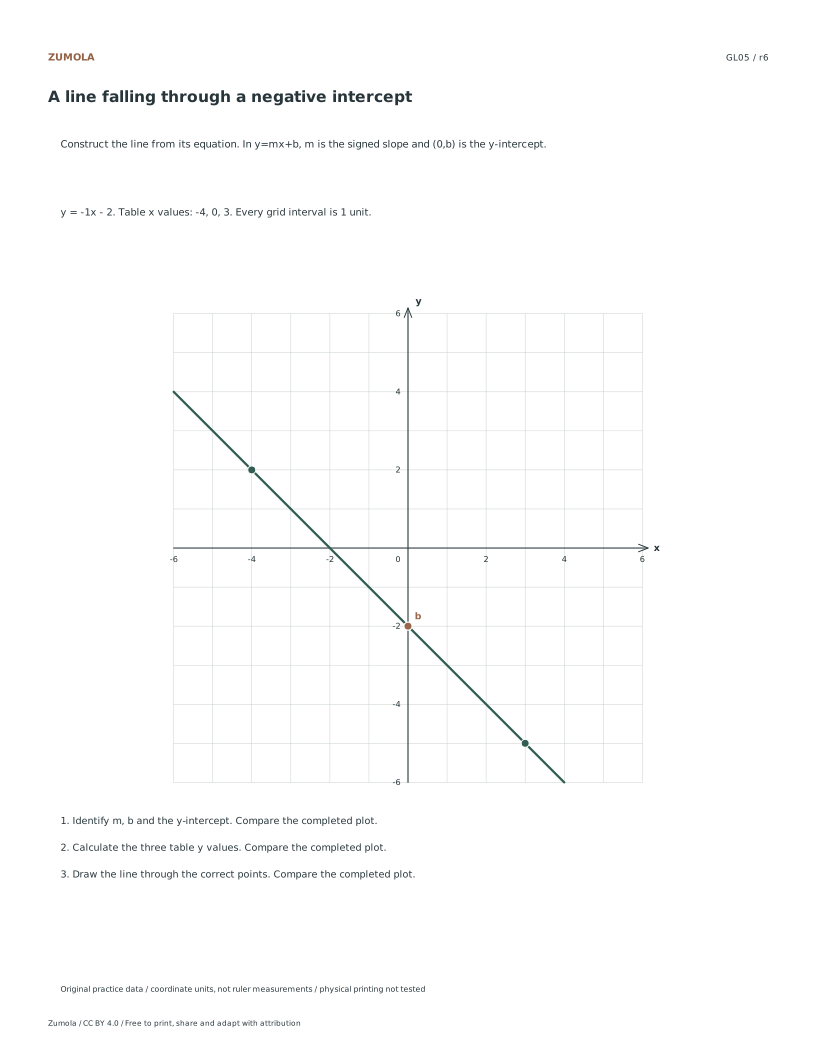
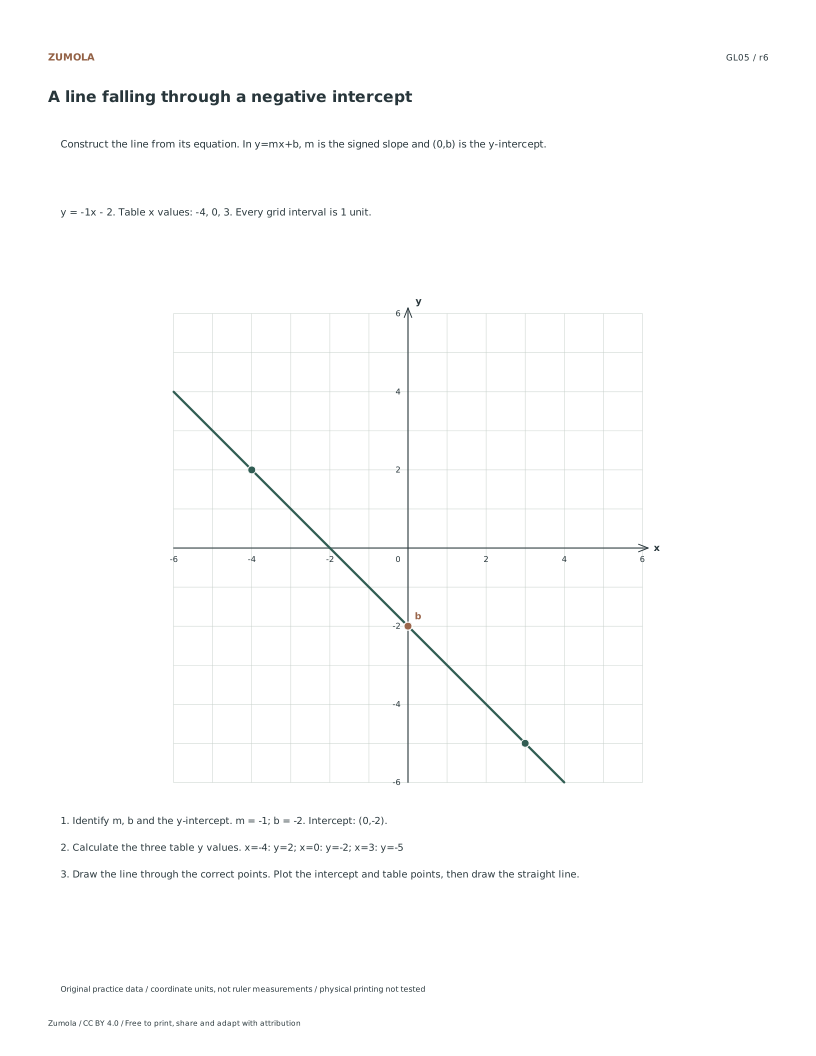
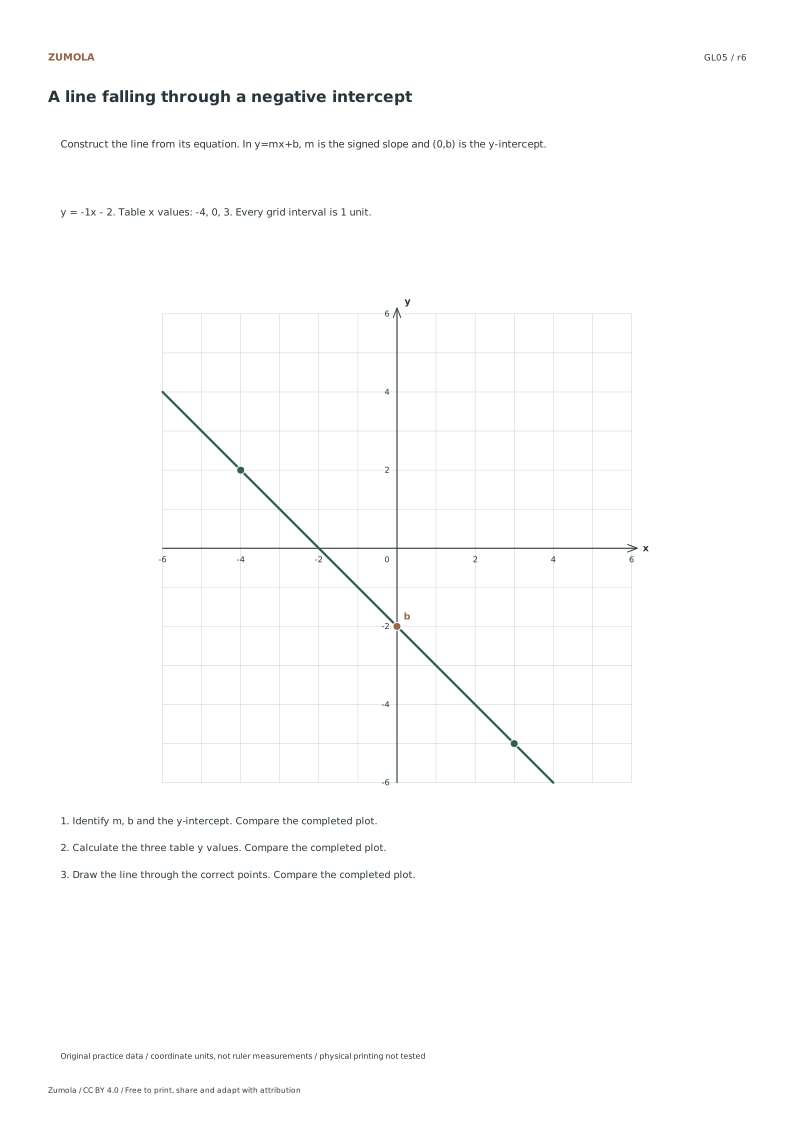
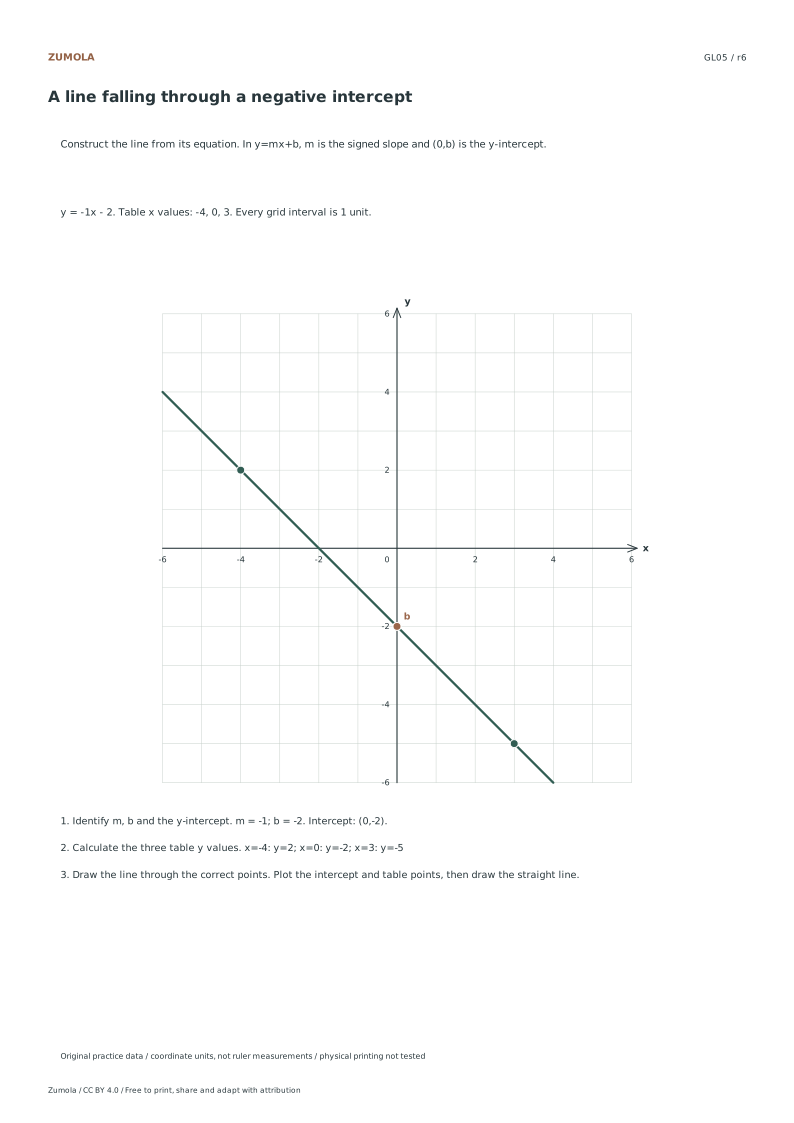
Start at (0,b), below the origin when b is negative. Then move according to the signed rise and run, or plot the points from your table.
Does a zero slope mean there is no line?
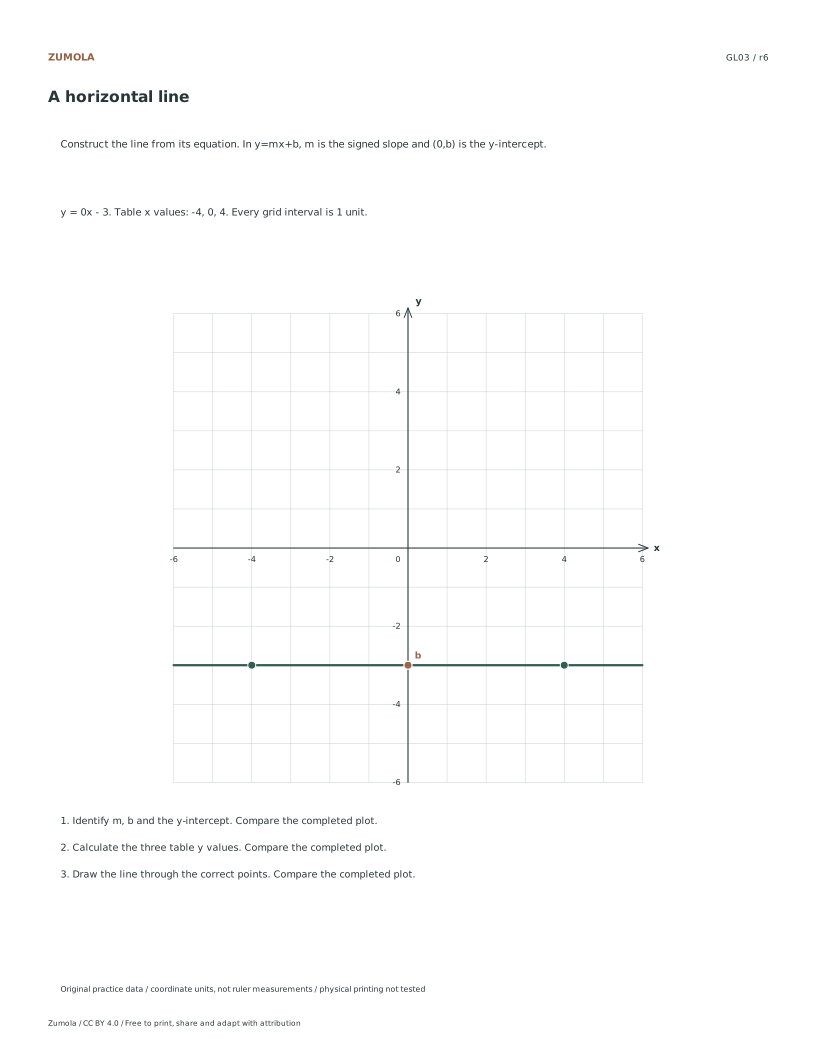
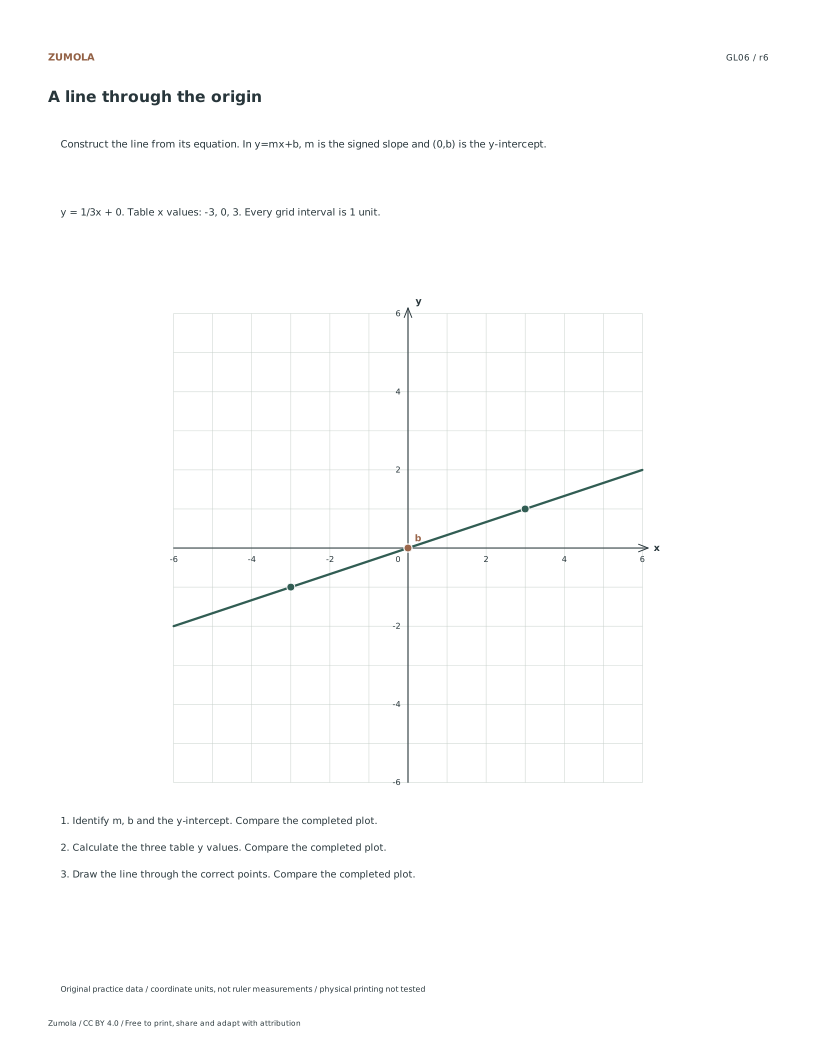
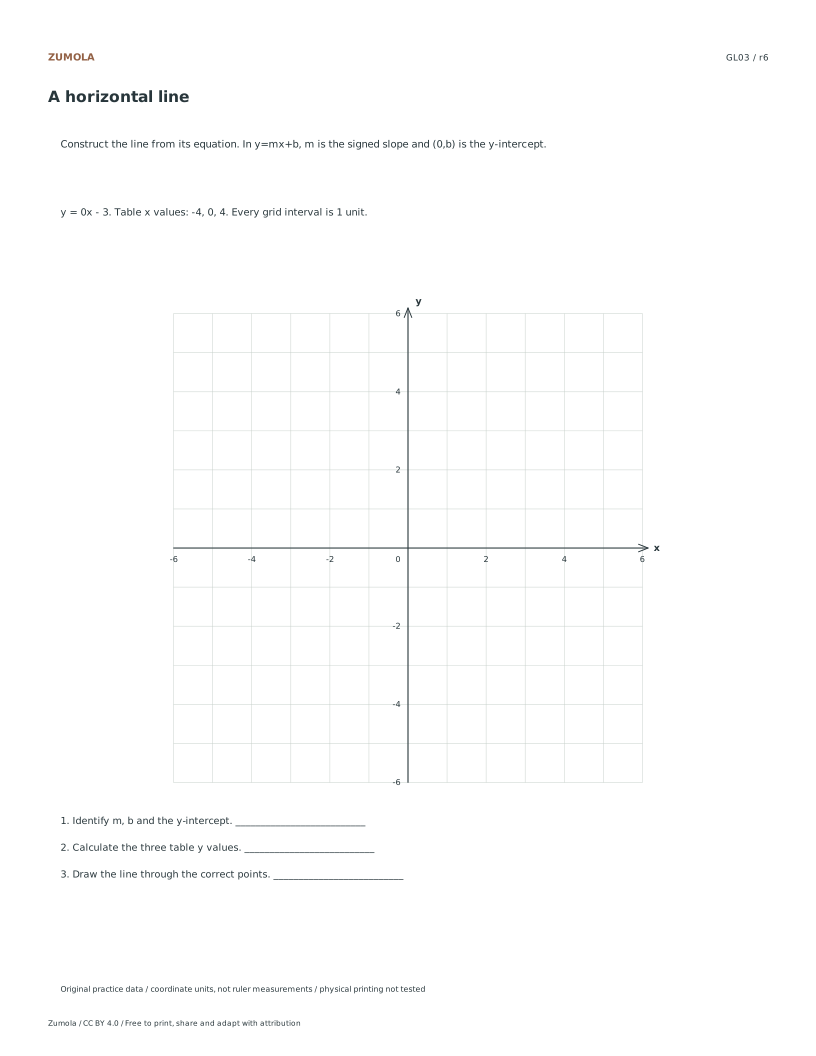
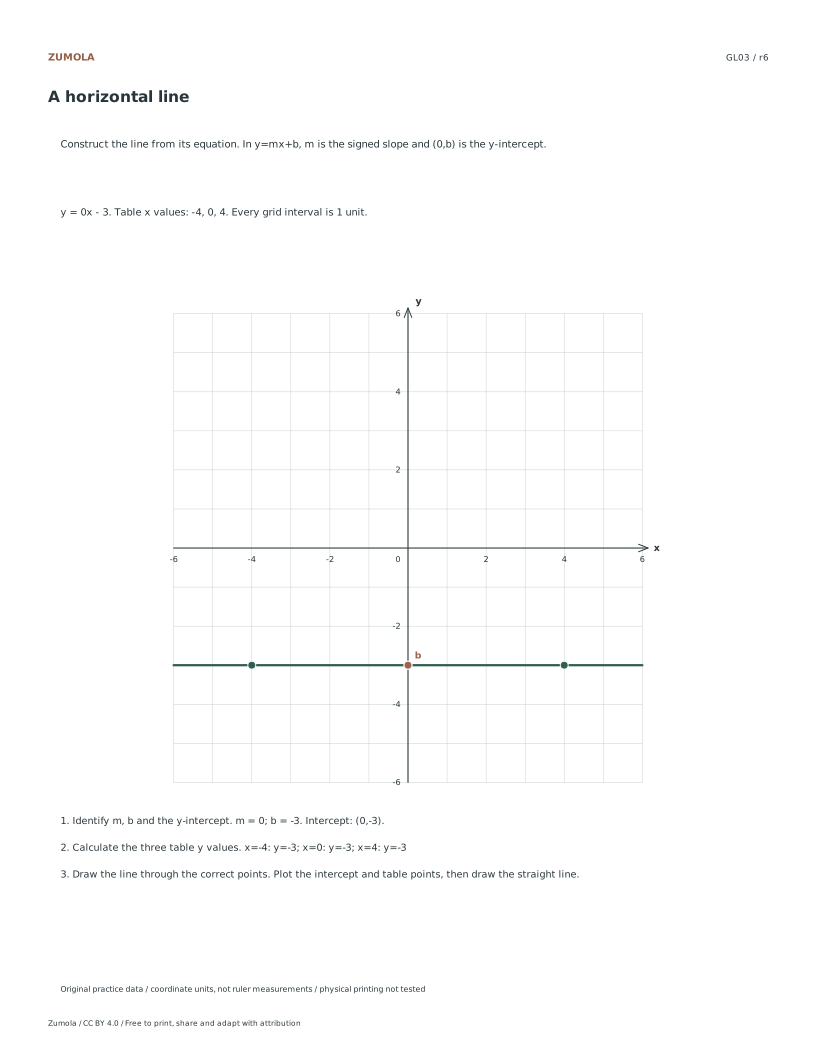
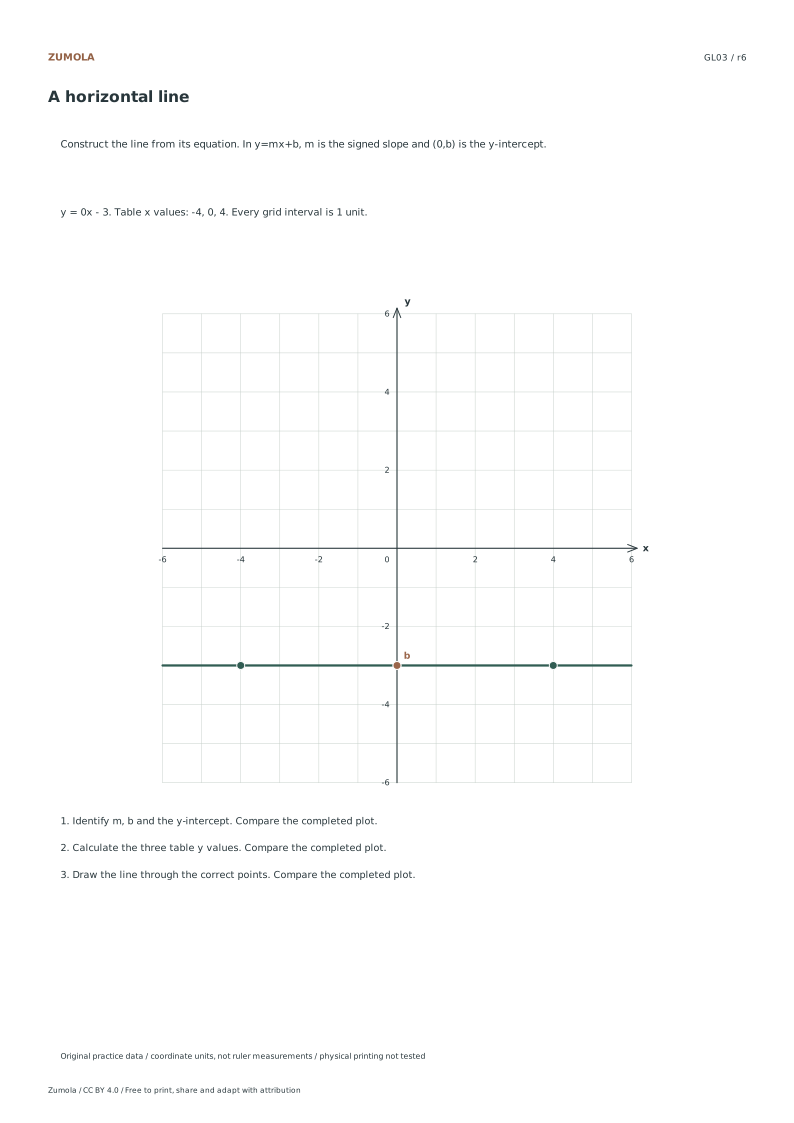
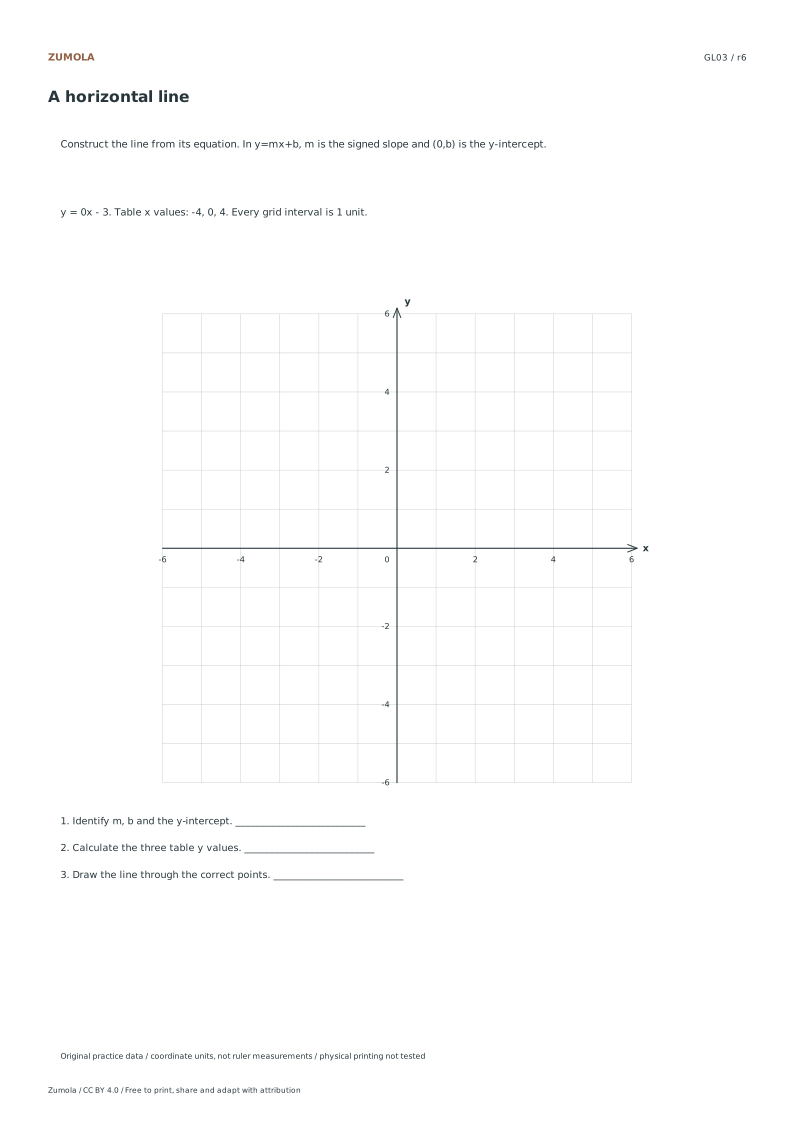
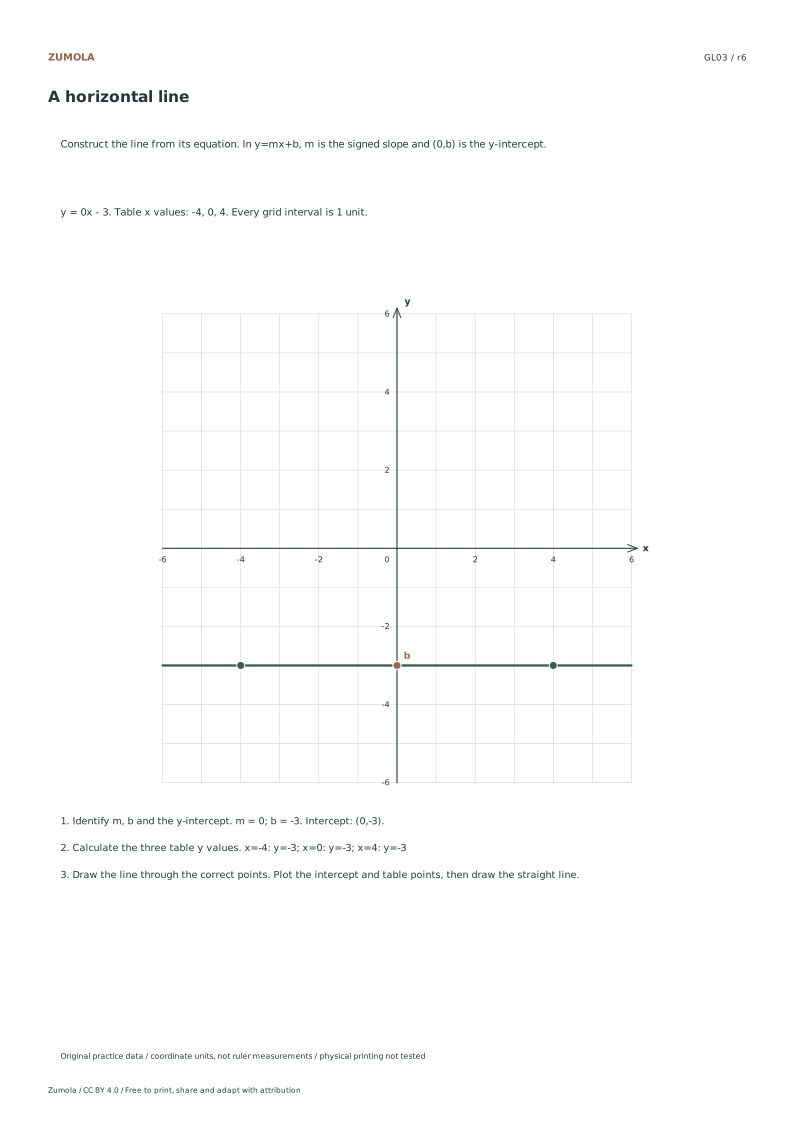
No. In y=mx+b, m=0 gives y=b, a horizontal line. It crosses the y-axis at (0,b).
Why are there no vertical lines here?
A vertical line has equation x=c and cannot be expressed as y=mx+b with a finite m. The slope-reading collection includes an undefined-slope example.
Are the answer files and editable graphs free?
Yes. Reference, student and worked-answer files are all free without an account. Single sheets include PDF and SVG; collection packs are PDF files. Analytics consent is not required to download.
Further reading: OpenStax: slope-intercept form. The data tables, illustrations and exercise cases here are original Zumola work.
Your analytics choice
Optional Google Analytics helps us understand which free resources are useful. It is off until you allow it. Drawing tools and downloads work with either choice. Privacy details