Free graphing resources · Original practice
Scatter graph worksheets.
Keep each pair together.
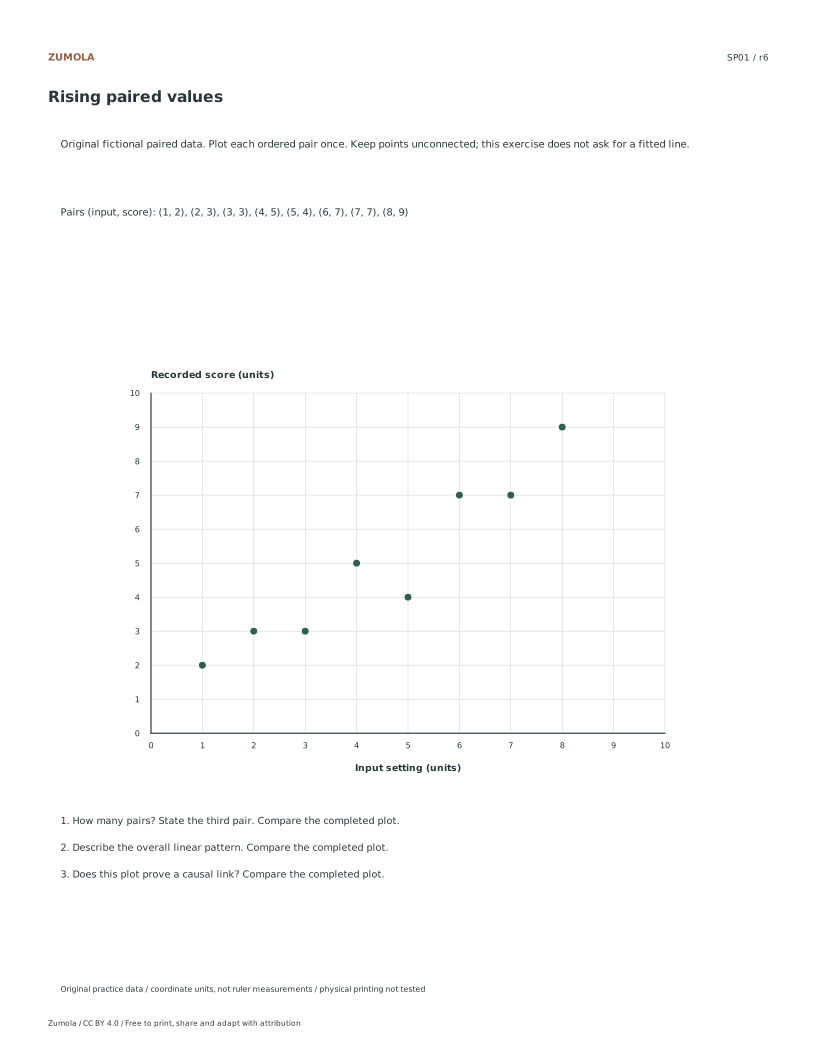
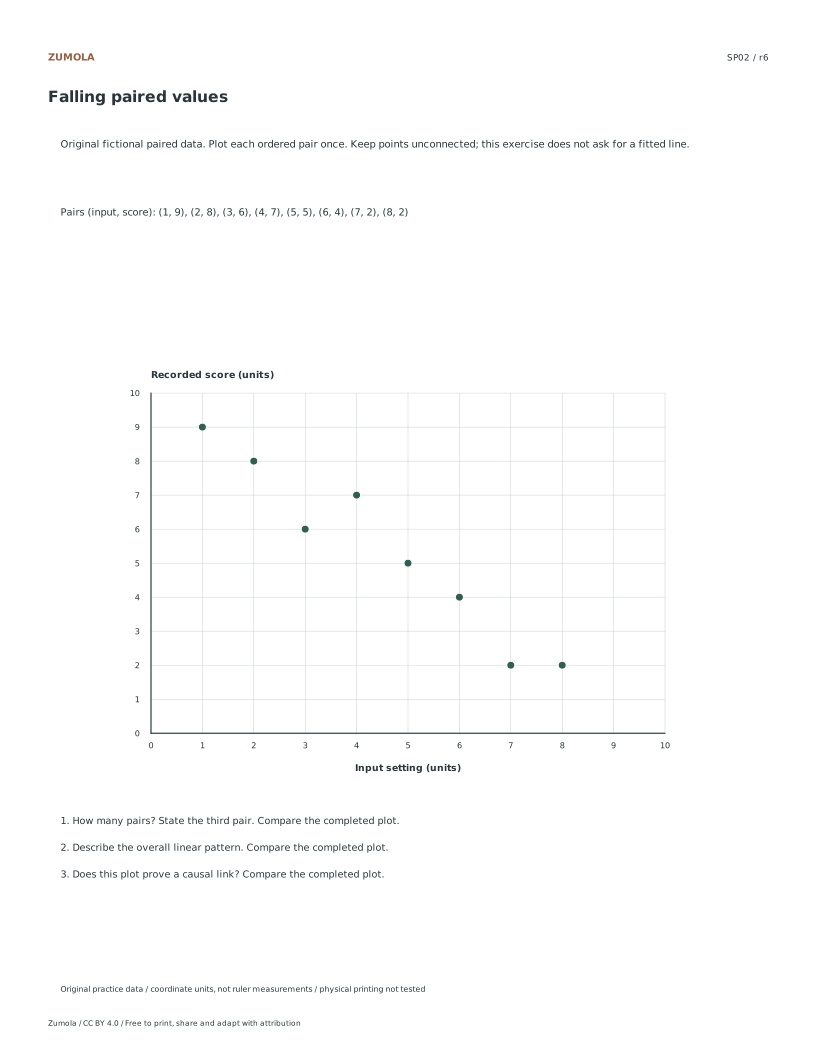
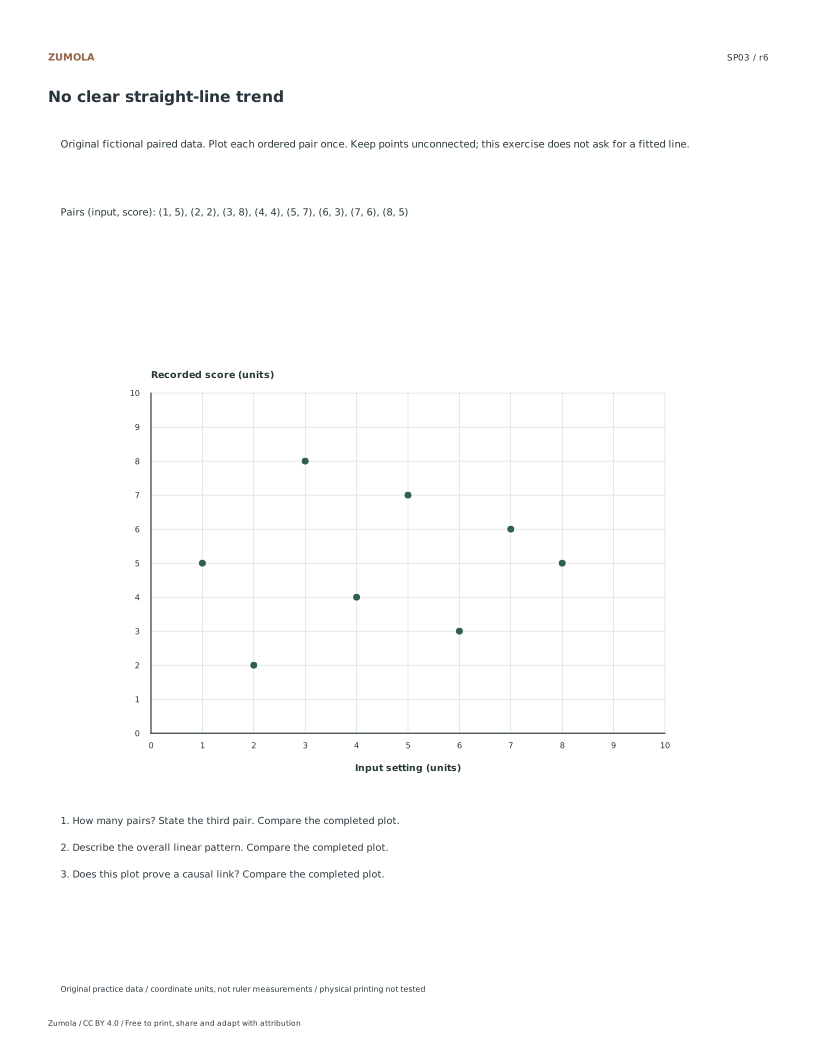
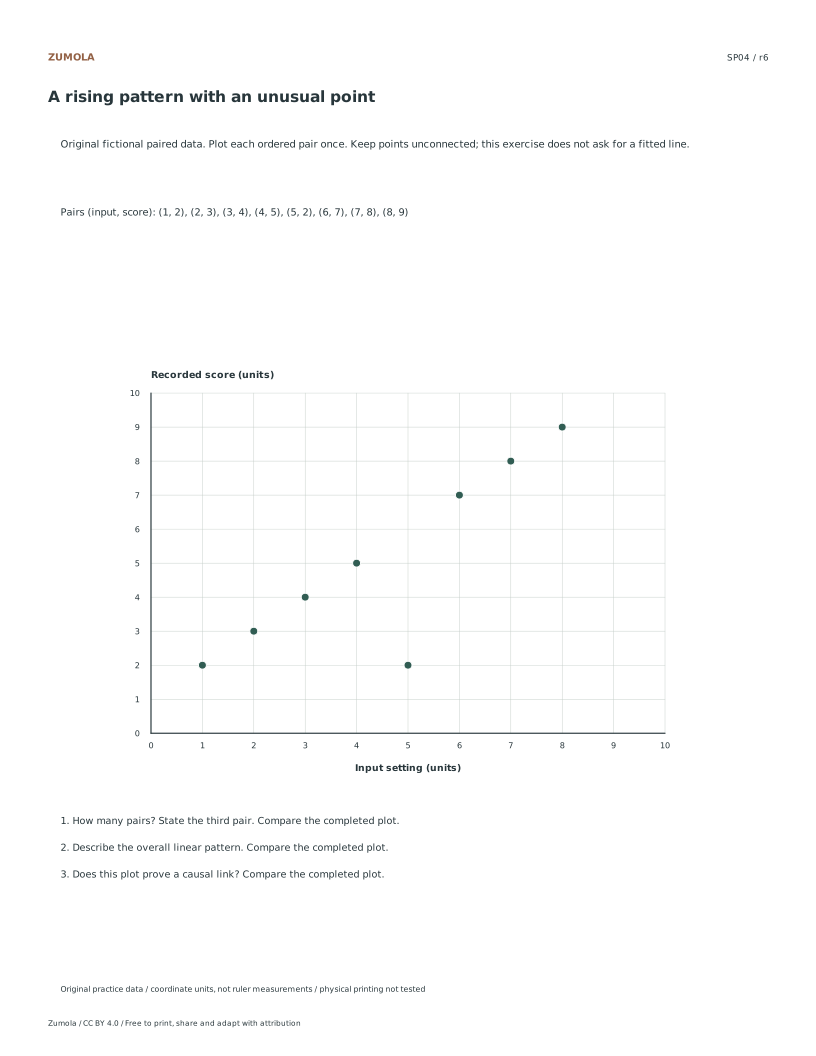
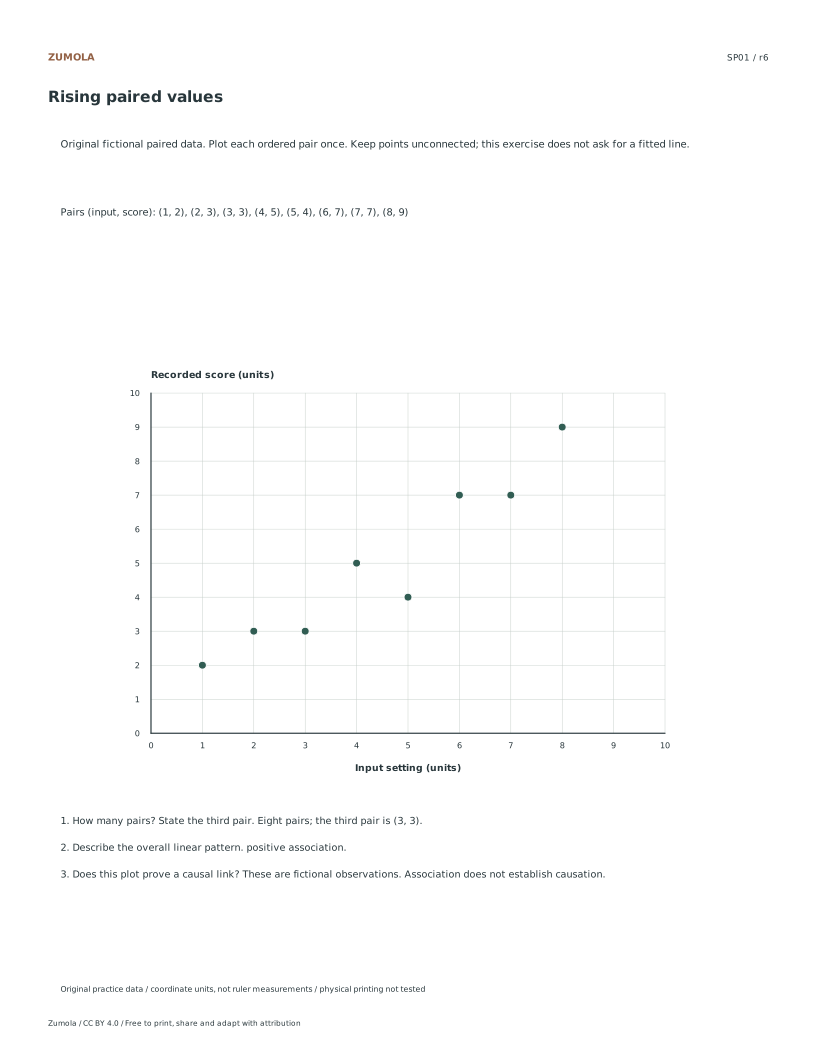
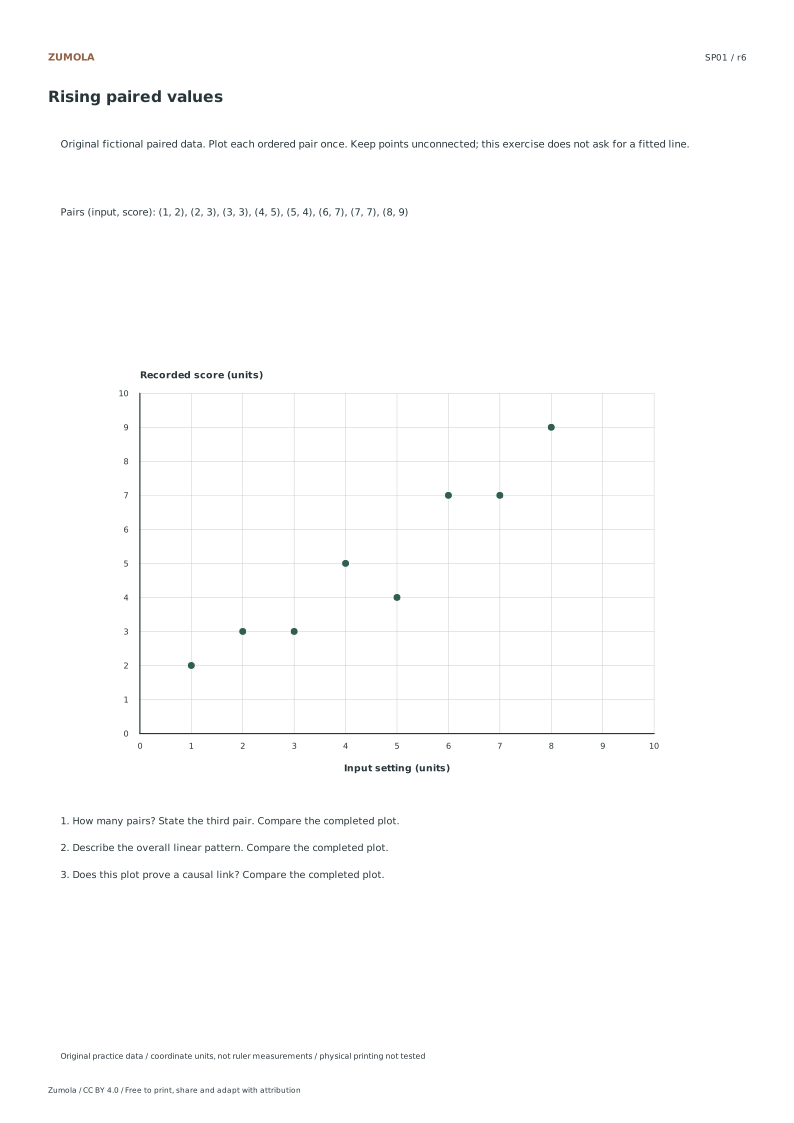
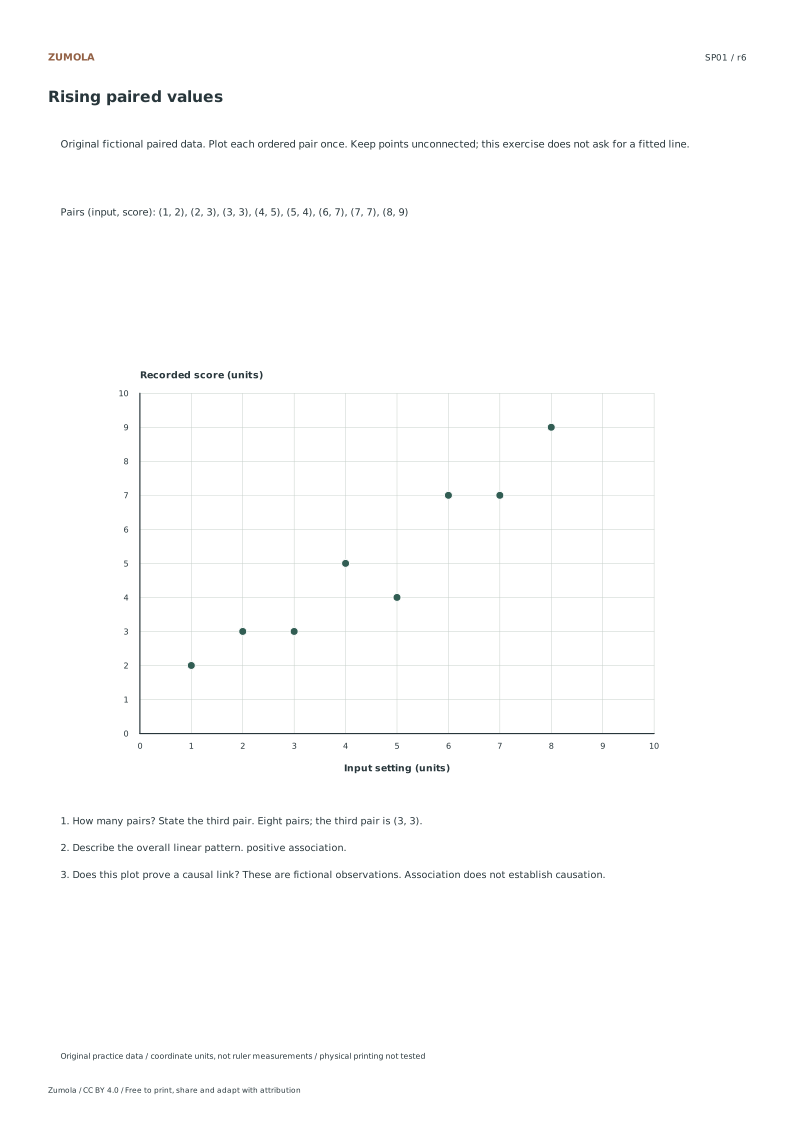
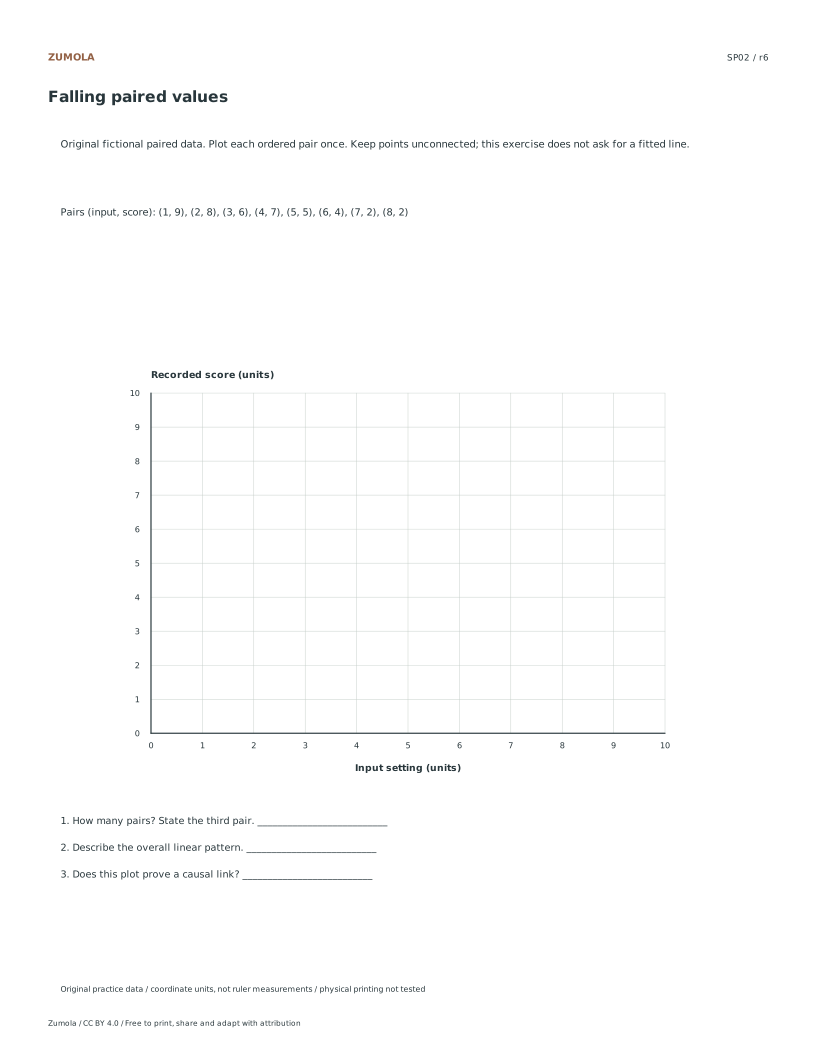
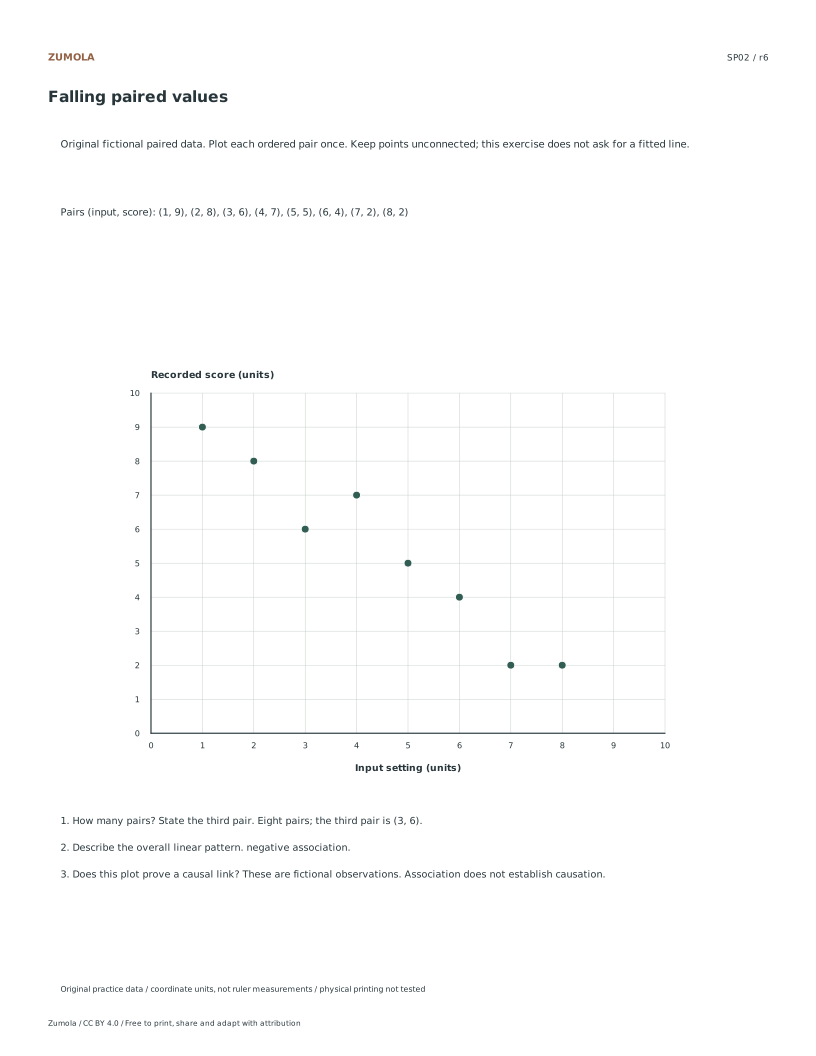
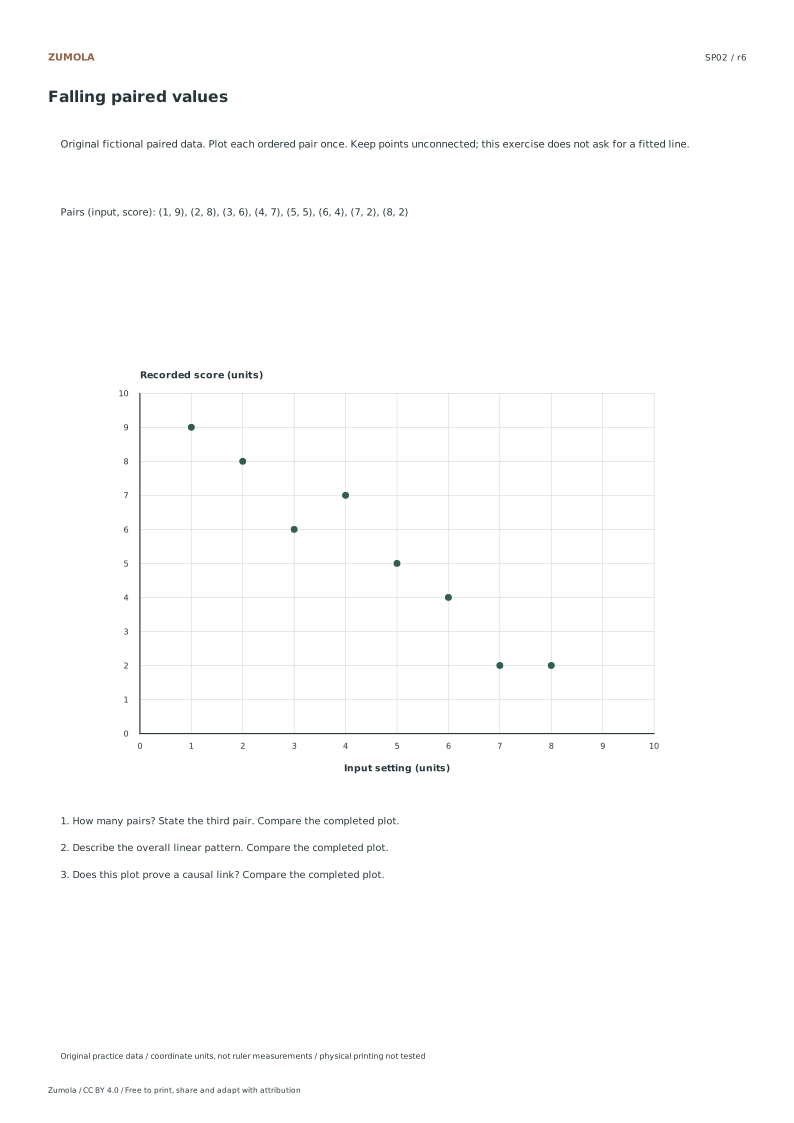
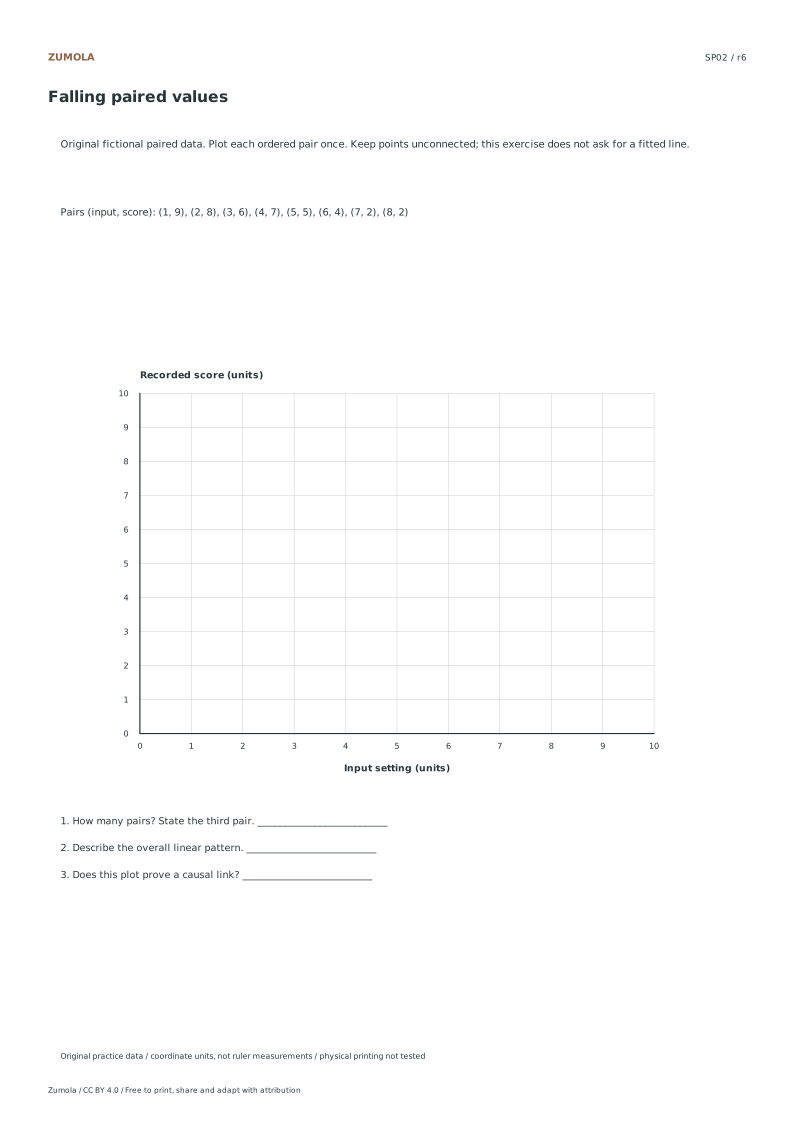
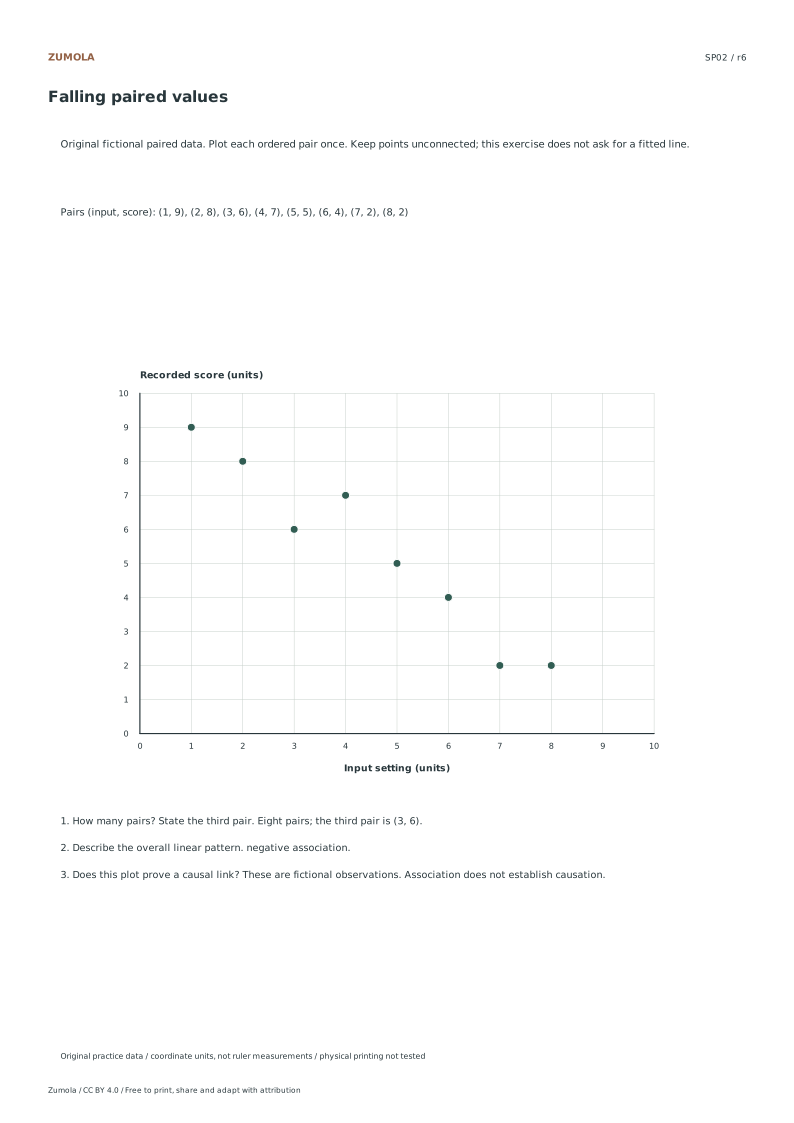
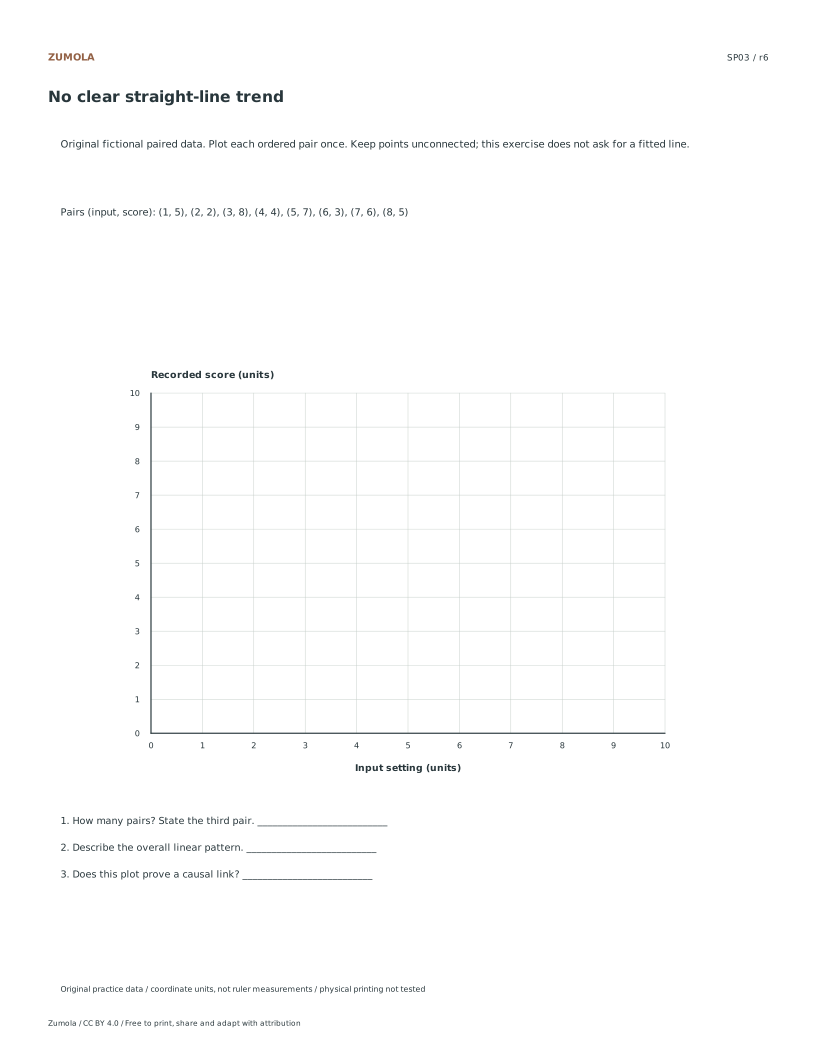
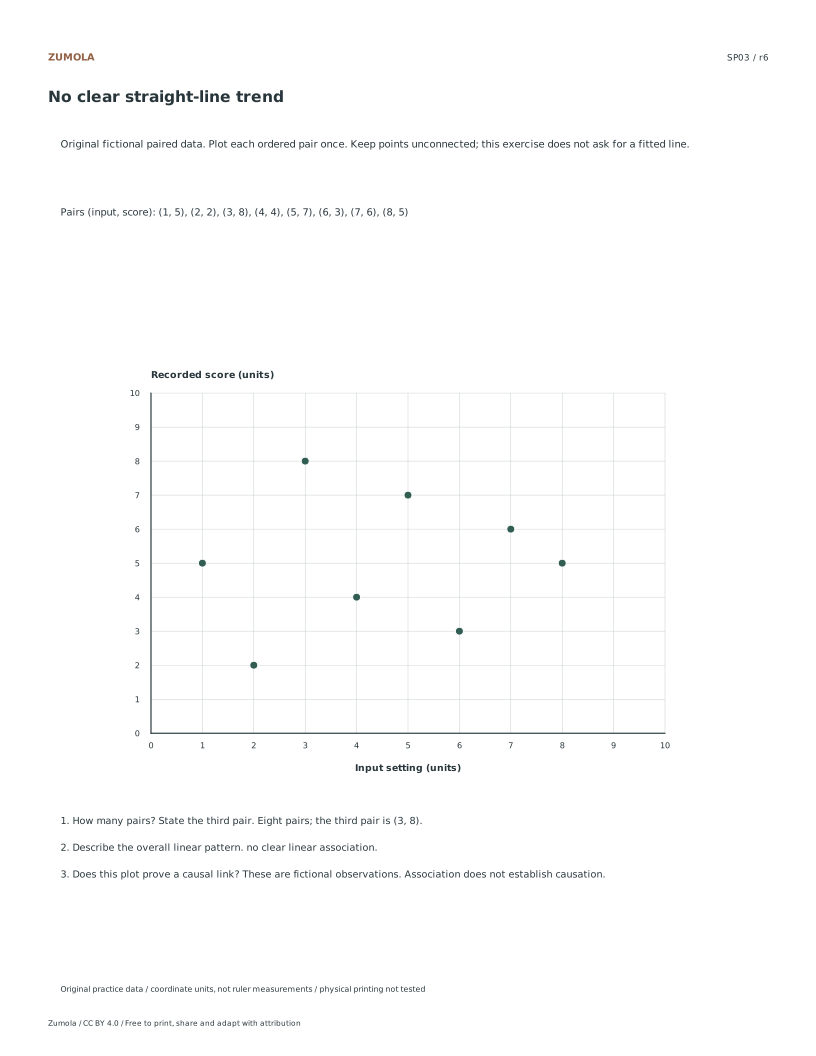
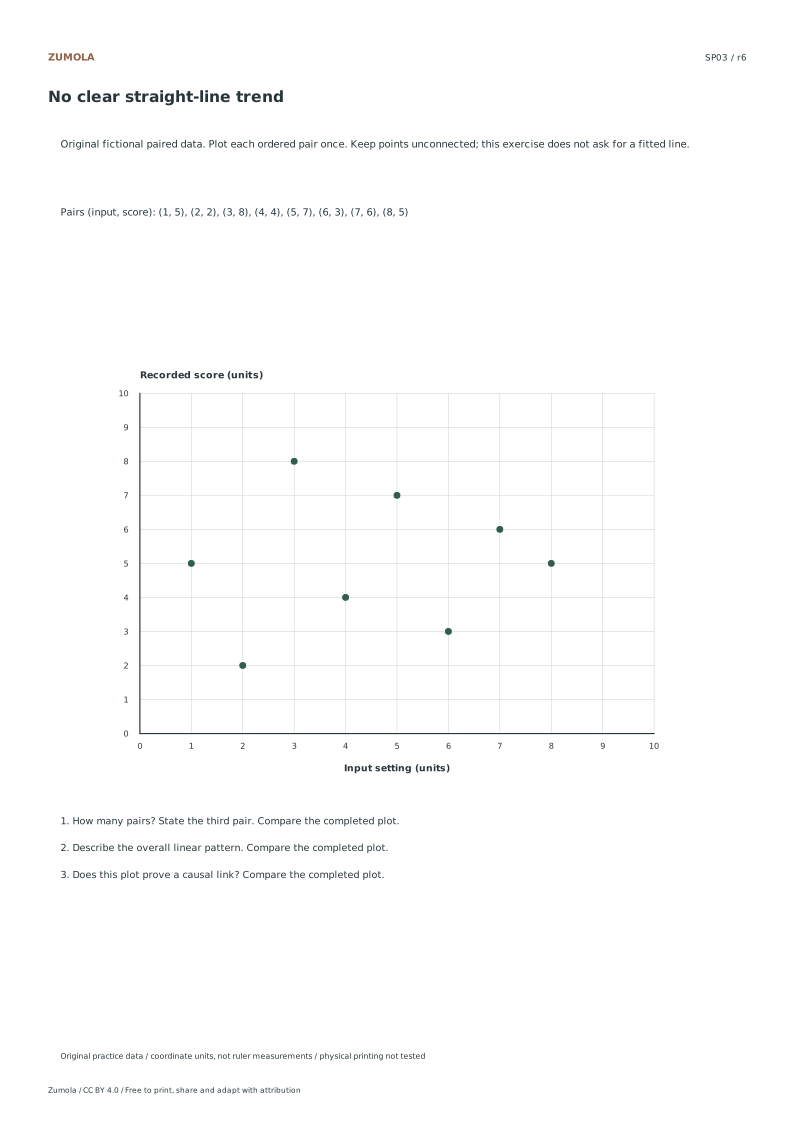
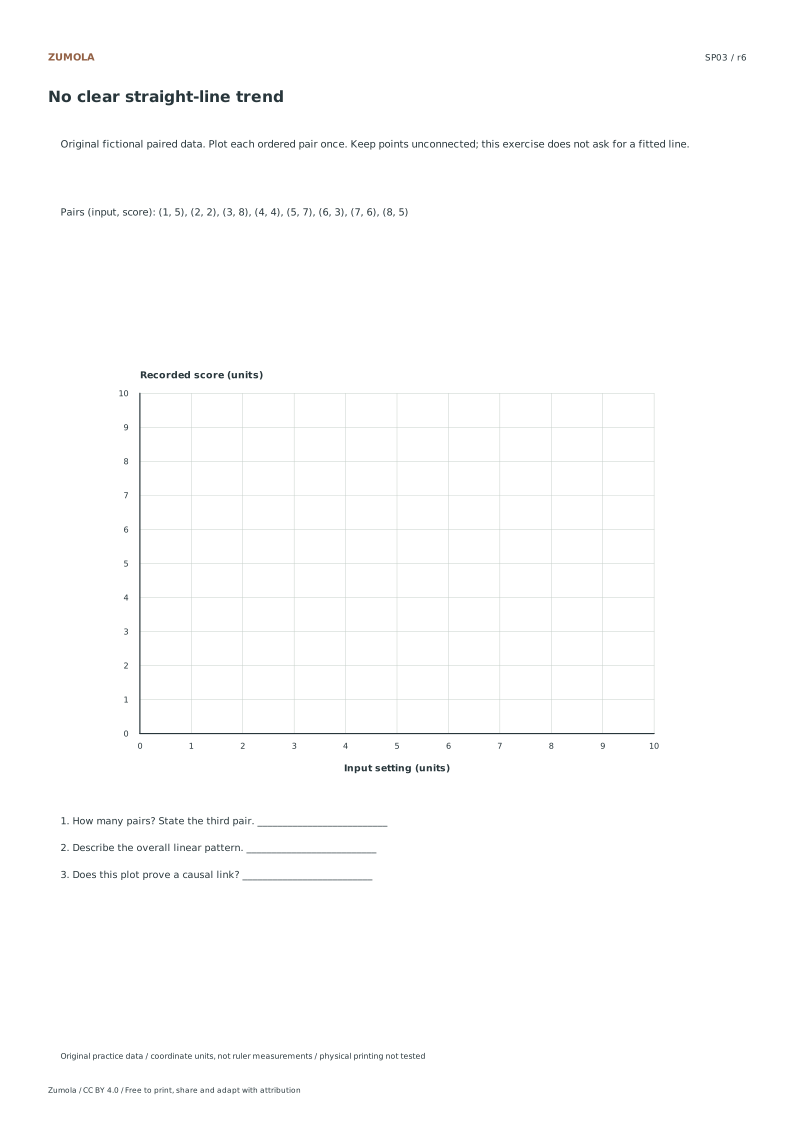
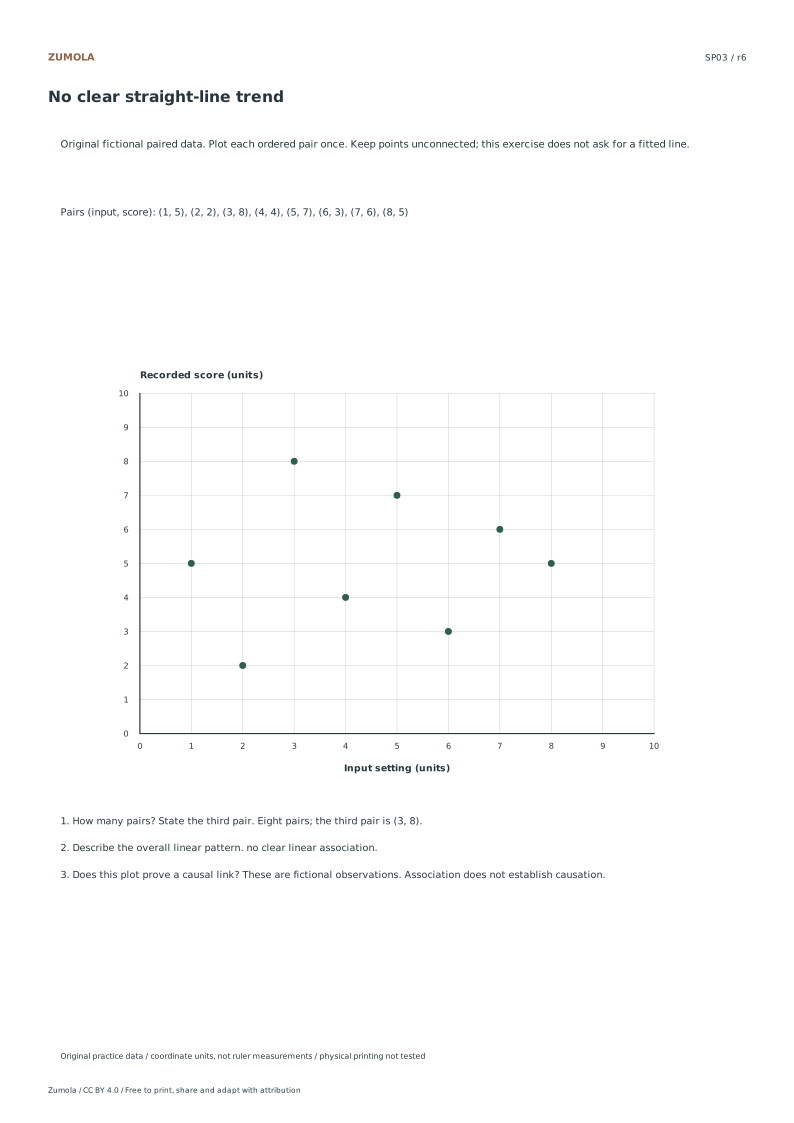
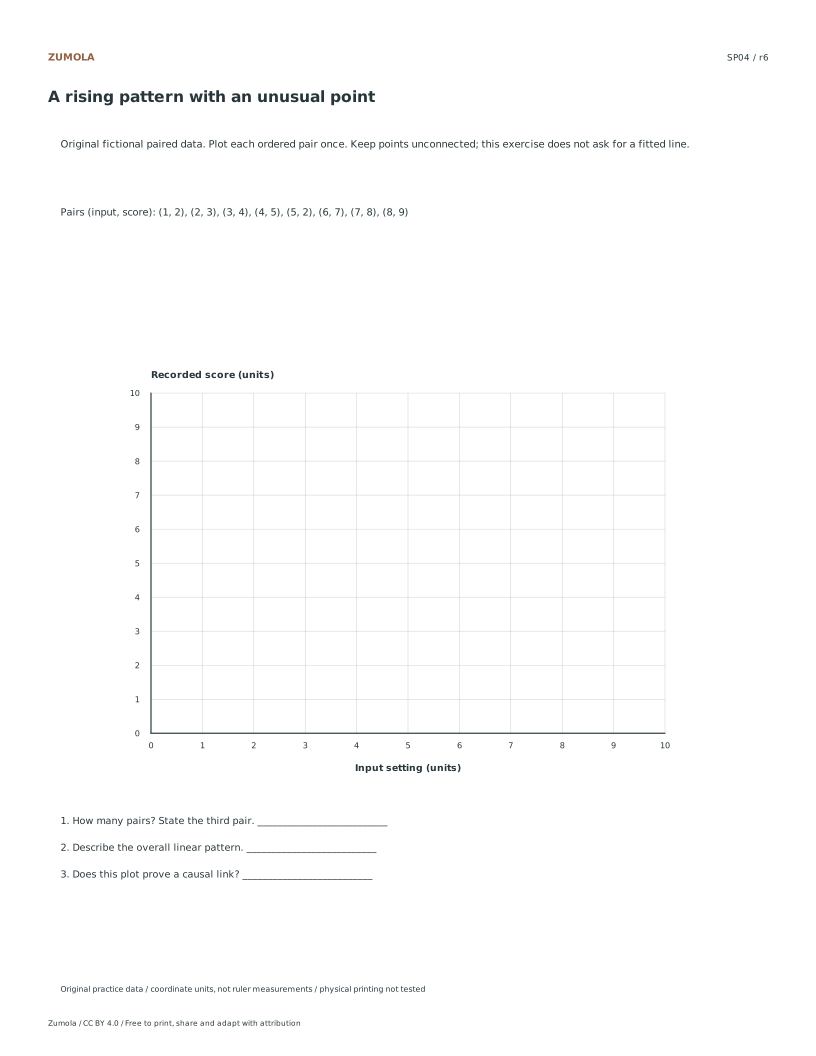
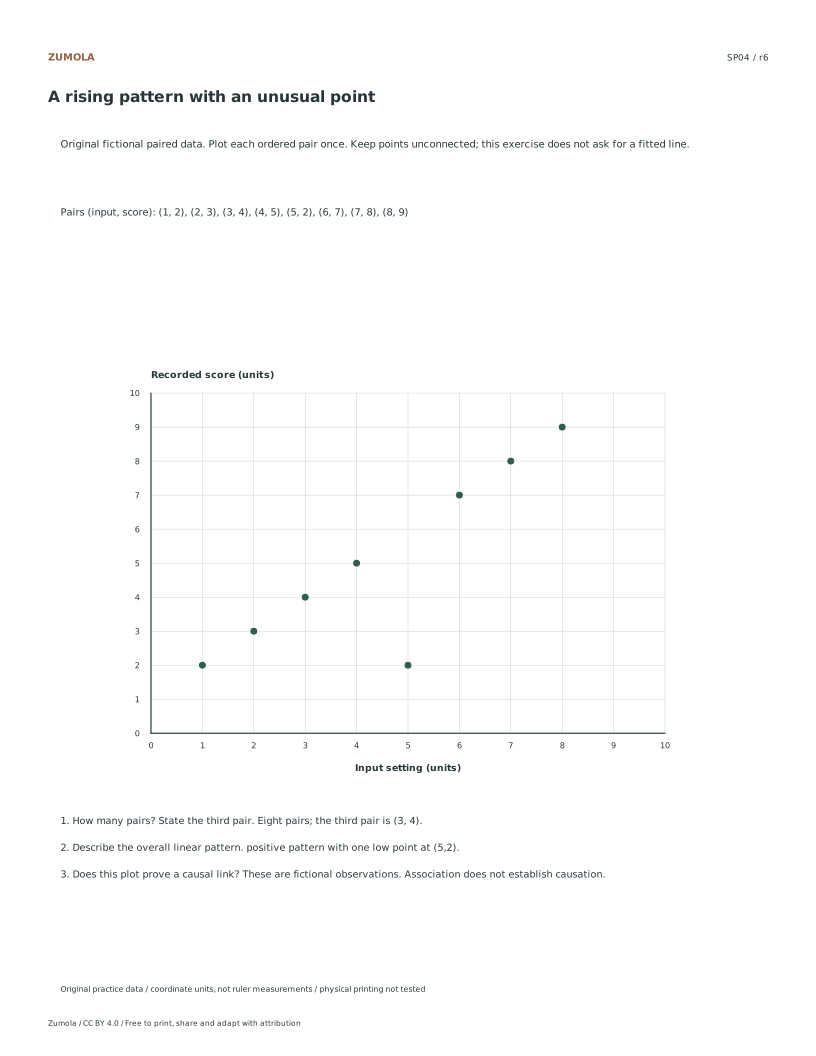
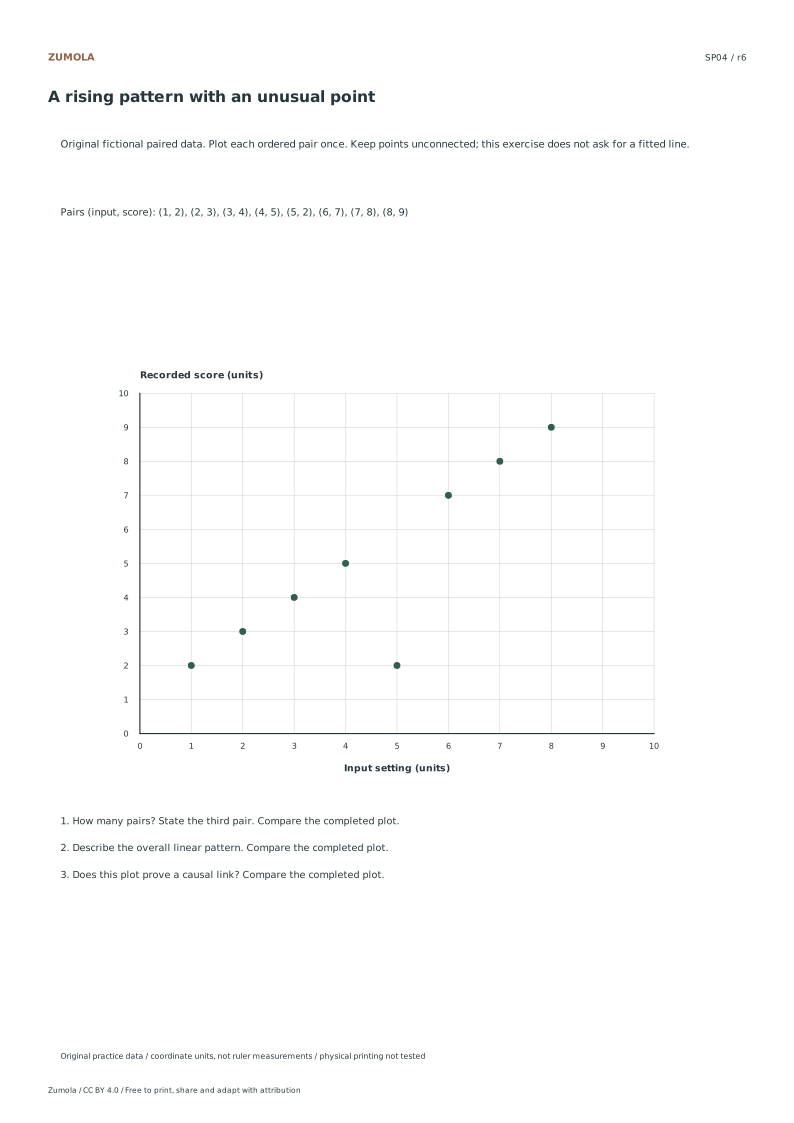
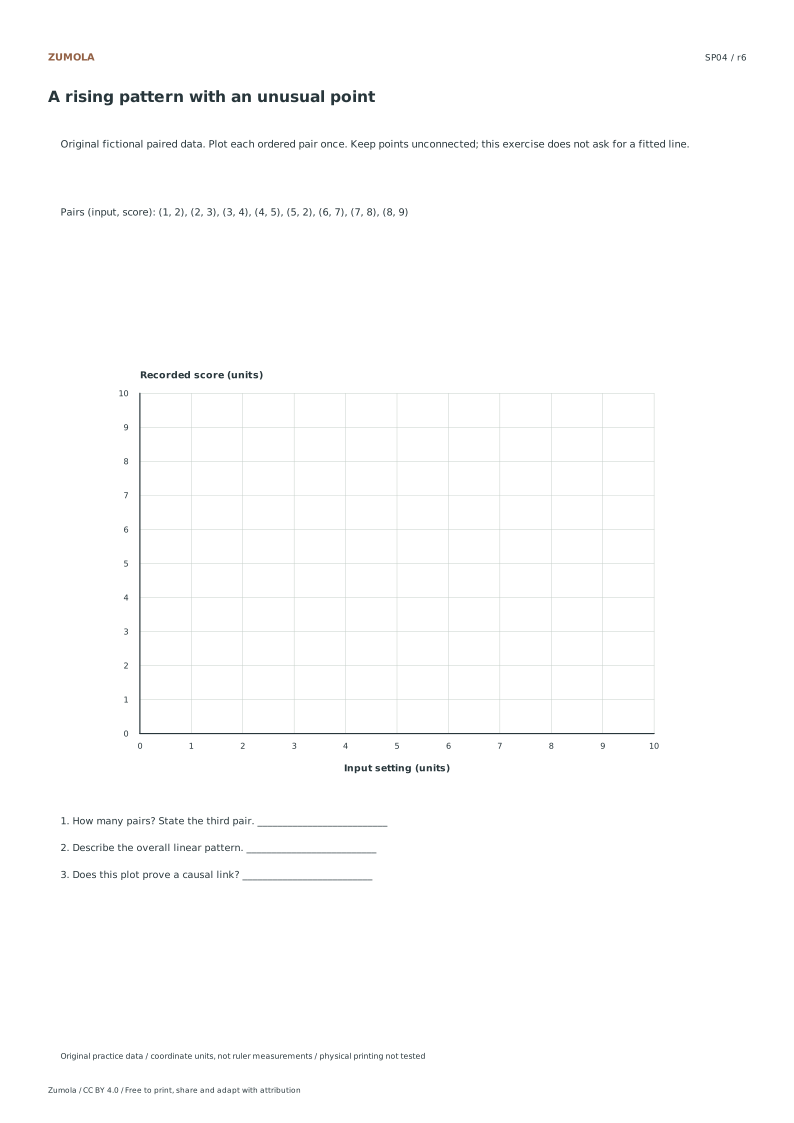
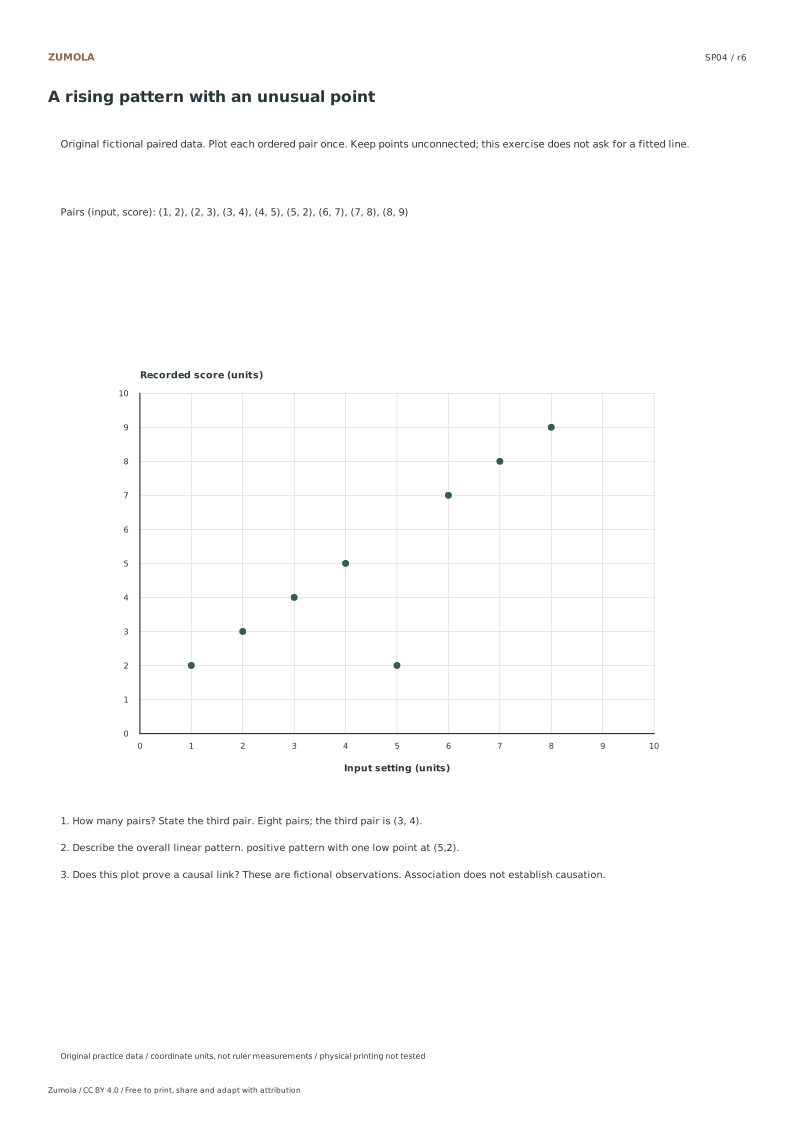
Plot eight numerical pairs in each of four fictional datasets. Compare rising, falling and less clear patterns while keeping association separate from causation.
4 original datasets.
8 pairs per graph; no fitted line.
Keep the labels and margins readable
Choose the Letter or A4 file that matches your paper. Actual size / 100% preserves the designed layout; a different uniform print scale changes physical lengths but does not change the listed numbers or the arithmetic. Keep the whole chart and all labels inside the printable area. A ruler can help draw straight segments, but calculate from the stated numerical scale.
These files have digital geometry, arithmetic and page-boundary checks. Physical printer and classroom trials have not been completed. The resources are practice material, with no claim of curriculum certification or precision-instrument accuracy. The original files use CC BY 4.0: credit Zumola, link the license and indicate changes.
More ways to practice
A mixed-trend plotting task
Use graph paper with a clear origin at the lower left. Label the horizontal axis as study minutes per day, from 0 to 60 in steps of 10. Label the vertical axis as practice score, from 0 to 10 in steps of 2. Plot these pairs: (10, 3), (20, 4), (30, 5), (40, 6), (50, 7), (20, 8), (30, 7), (40, 6), (50, 5). The first five points rise steadily. The next four fall steadily. One point, (20, 8), sits above the rising line and is worth discussing separately.
Keep the plotted point small and centred on its coordinate. A dot that drifts toward a grid line changes the apparent trend. Write each pair beside the graph only if space allows; otherwise keep a separate table so the graph stays readable.
- Draw and label both axes, including units and the scale step.
- Mark the origin and confirm each grid square represents the stated step.
- Plot the rising group first and check each point against its pair.
- Plot the falling group and the unusual point, then compare positions.
- Add a short caption describing the overall pattern and the unusual point.
Reading the pattern without overclaiming
A scatter graph shows association between two measured variables. A rising group suggests that higher horizontal values tend to pair with higher vertical values in that group. A falling group suggests the opposite. The unusual point does not prove an error; it may be a genuine observation or a recording mistake. Describe it as unusual and state what you would check.
Do not describe the pattern as proof that one variable causes the other. The data here are fictional and small, so the graph supports a description, not a conclusion about real study habits.
- State whether each group rises, falls, or shows no clear direction.
- Name the unusual point by its coordinates.
- Say what evidence would help decide whether it is a recording error.
- Avoid words such as proves or causes unless the task supplies evidence.
Diagnostic checks before interpreting
Check the axes before reading the trend. If the vertical scale starts above zero, the visual slope changes even when the pairs do not. If the horizontal step is uneven, distances between points become misleading. Confirm that every plotted point matches its table entry and that no point sits on the wrong grid line.
Compare your graph with a partner only after both are complete. Differences in point placement usually reveal a scale or labelling error rather than a different interpretation.
- Recount the plotted points against the table.
- Confirm both axes have units and a stated step.
- Check that the origin is marked and the scale is even.
- Replot any point that is more than half a grid square from its coordinate.
Try this example
Plot (10, 3), (20, 4), (30, 5), (40, 6), (50, 7) on axes from 0 to 60 horizontally and 0 to 10 vertically, then describe the pattern.
Show the worked explanation
Each increase of 10 horizontal units pairs with an increase of 1 vertical unit, so the five points form a rising line. The description is an association within these five pairs, not evidence of causation. Check that each point sits on the correct grid intersection before writing the caption.
Common mistakes
- Plotting a point one grid square off because the scale step was misread. Write the step beside each axis, then count squares aloud from the origin for the first point.
- Describing the unusual point as an error without evidence. Label it as unusual and list one check, such as re-reading the source table.
- Claiming the rising group proves that more study causes higher scores. Rewrite the sentence to describe association only, using tends to pair with.
Check your work
- Both axes are labelled with units and a stated scale step.
- Every plotted point matches its table pair within half a grid square.
- The caption describes rising, falling, or unclear groups separately.
- The unusual point is named by coordinates and treated as unverified.
- The interpretation avoids claims of causation.
Questions before you start
Should the axes always start at zero?
Not always, but a non-zero start can exaggerate the visual slope. State the starting value clearly and compare graphs only when their scales match.
How do I decide whether a point is an outlier?
Look for a point far from the surrounding pattern, then check the source table. Call it unusual rather than wrong until the value is verified.
Can a scatter graph show two separate trends?
Yes. Separate groups can rise or fall differently. Describe each group and note whether the groups overlap.