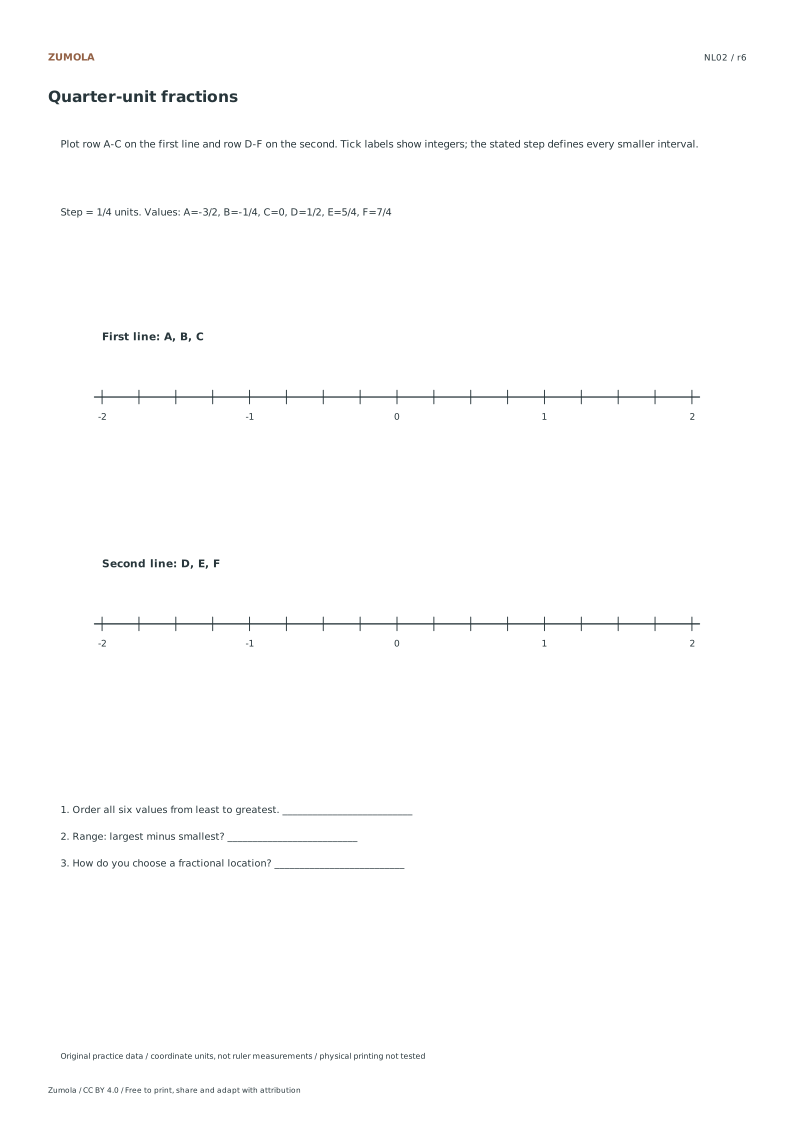
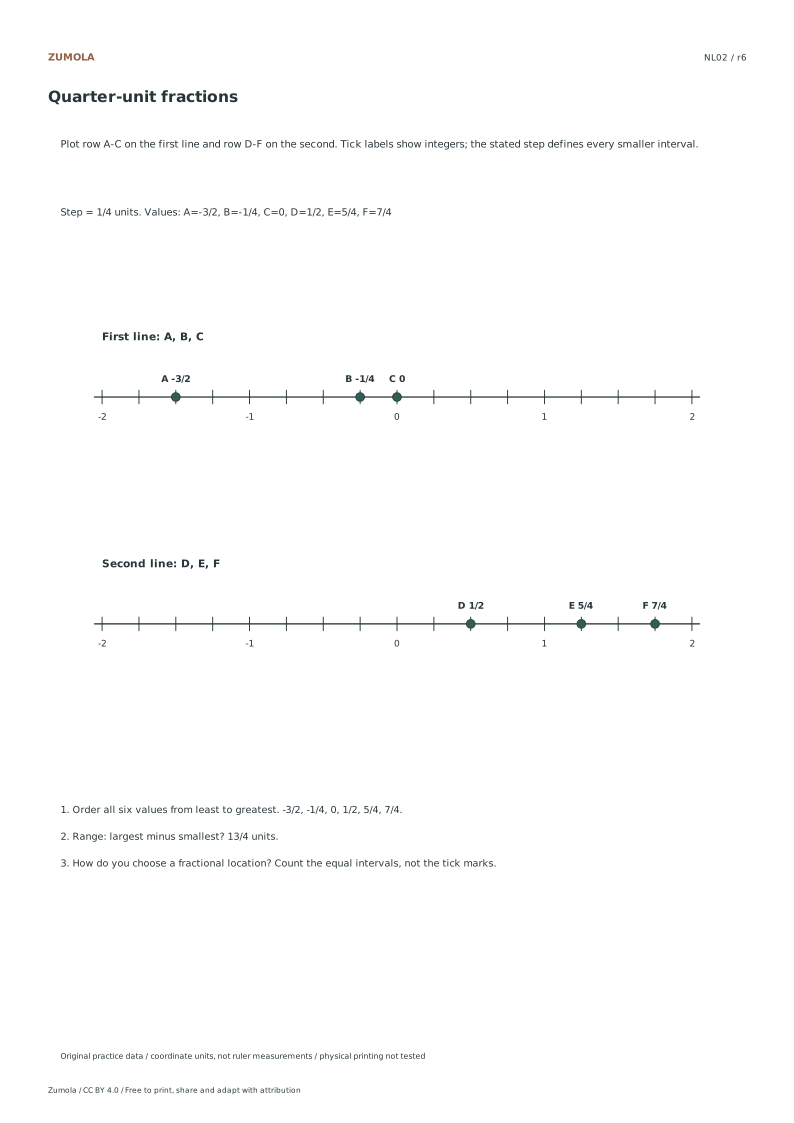
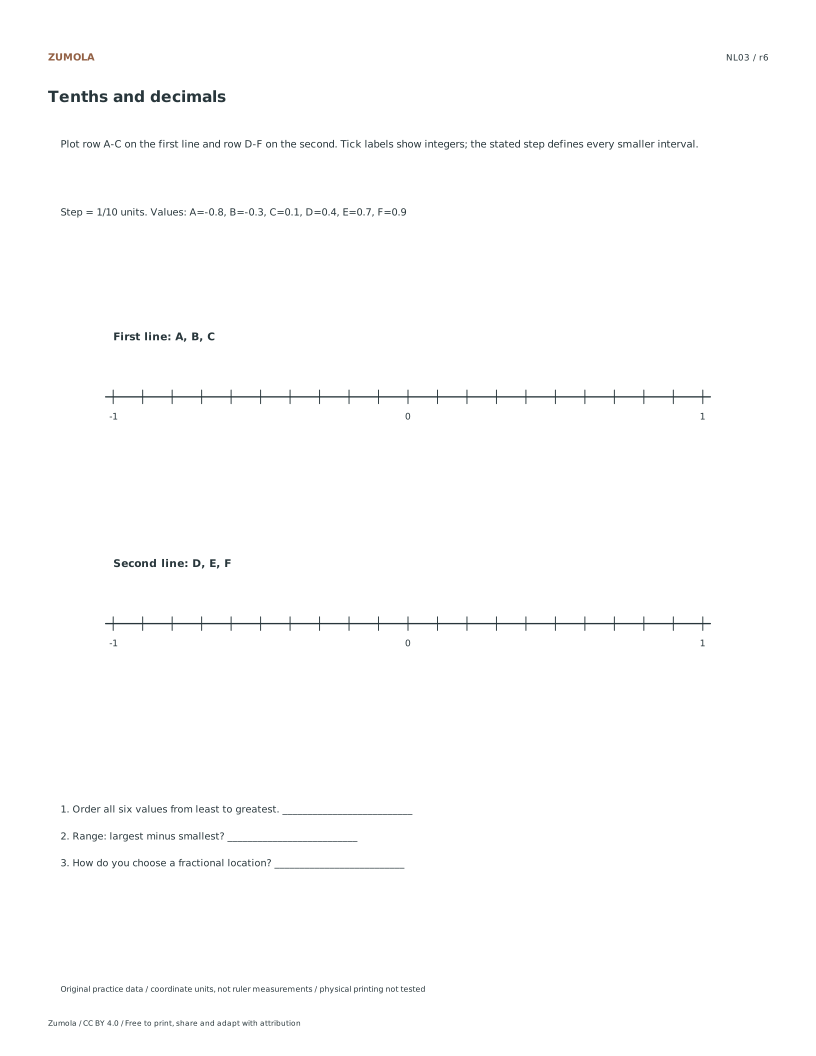
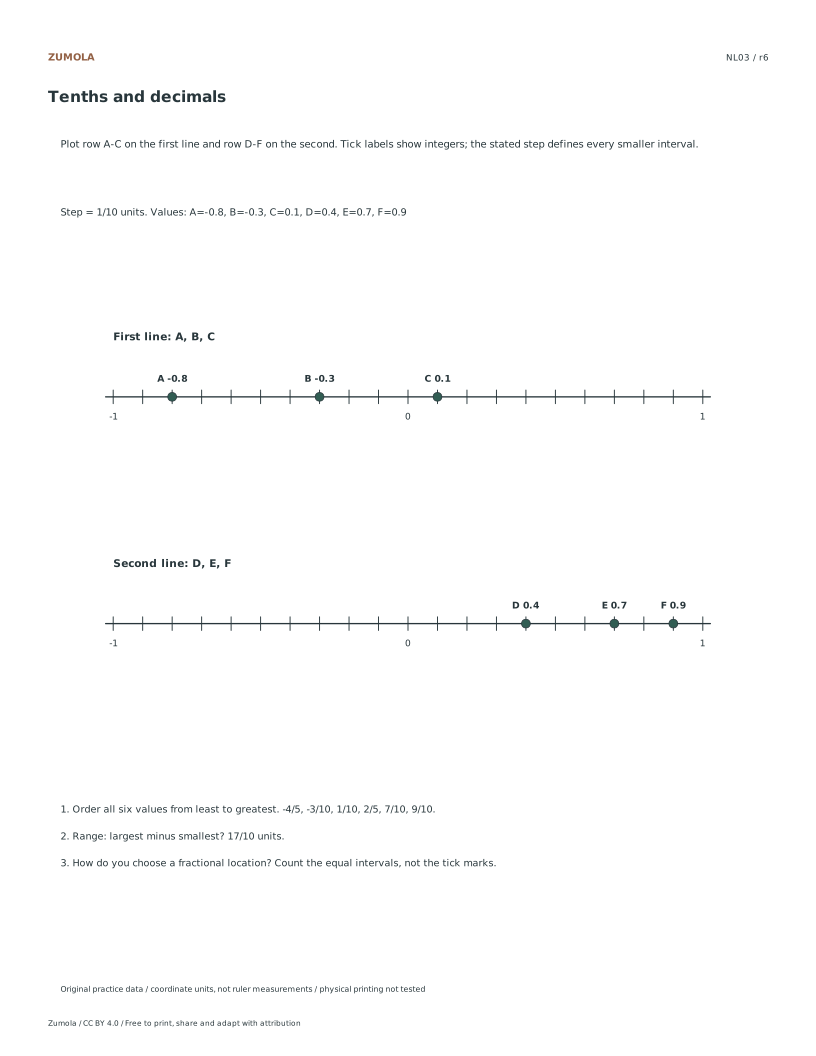
Number line worksheets. Give fractions a position.
Graph fractions on a number line, then compare integer, quarter-unit, decimal and half-unit scales. Sort the six values in each case and calculate their range.
4 rational-number cases. Two lines, six values per case.
A graph, a task and a worked check
Graph fractions on a number line, then compare integer, quarter-unit, decimal and half-unit scales. Sort the six values in each case and calculate their range.
Use the student pack for an attempt, then compare the separate reference or worked answer. Every case is original. All PDF and editable SVG resources are free without signup; each collection pack repeats its individual sheets in the same order.
Choose your paper and download
Download paper size
Every worksheet and answer is free. No signup.
The complete collection
Keep practice and answers separate.
Use the student pack first, then compare the reference or answer. Packs are PDFs; individual sheets below also include editable SVG files. The paper choice applies to every download.
The examples and datasets are made for these worksheets. They are not measured classroom results, published textbook questions or evidence about real people. Axis values and the supplied data determine the answers; paper measurements do not replace those numbers.
Check the first case
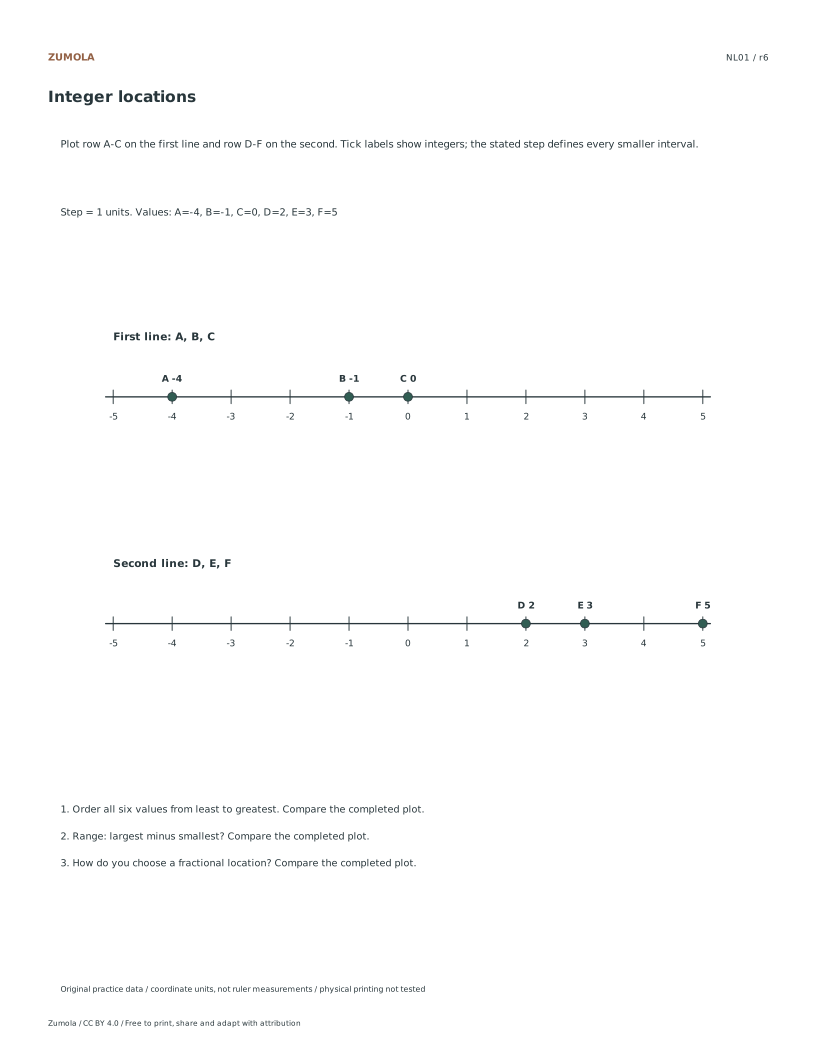
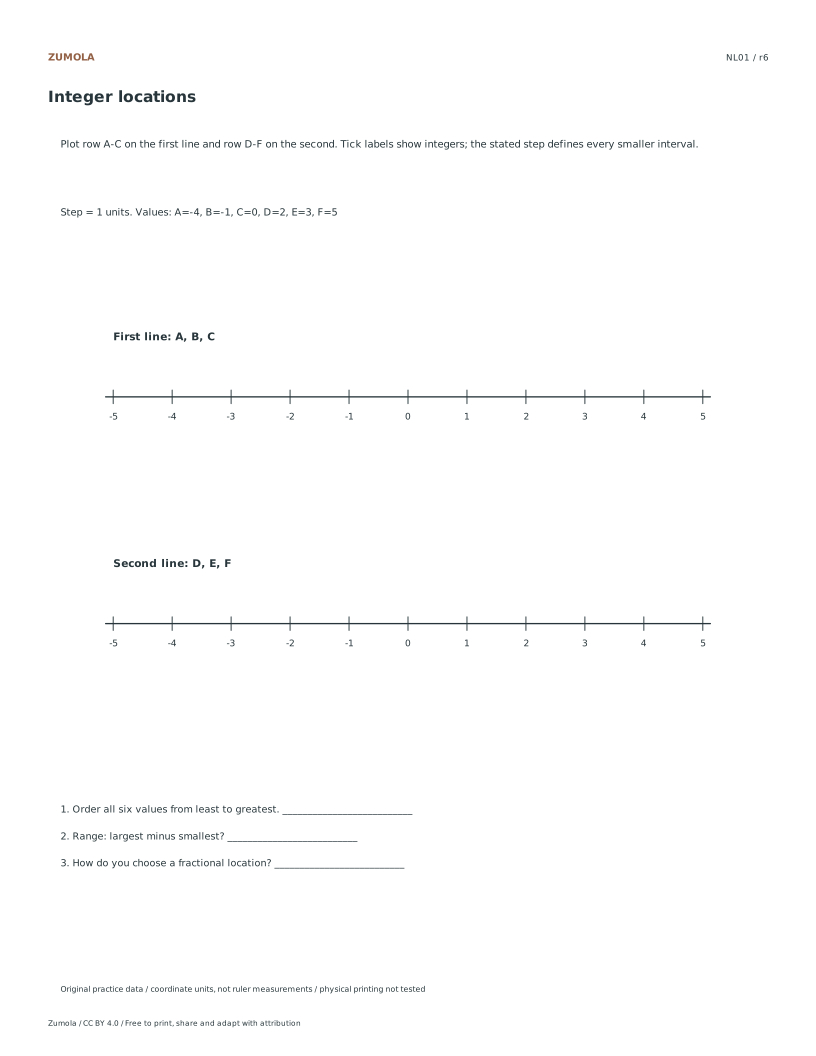
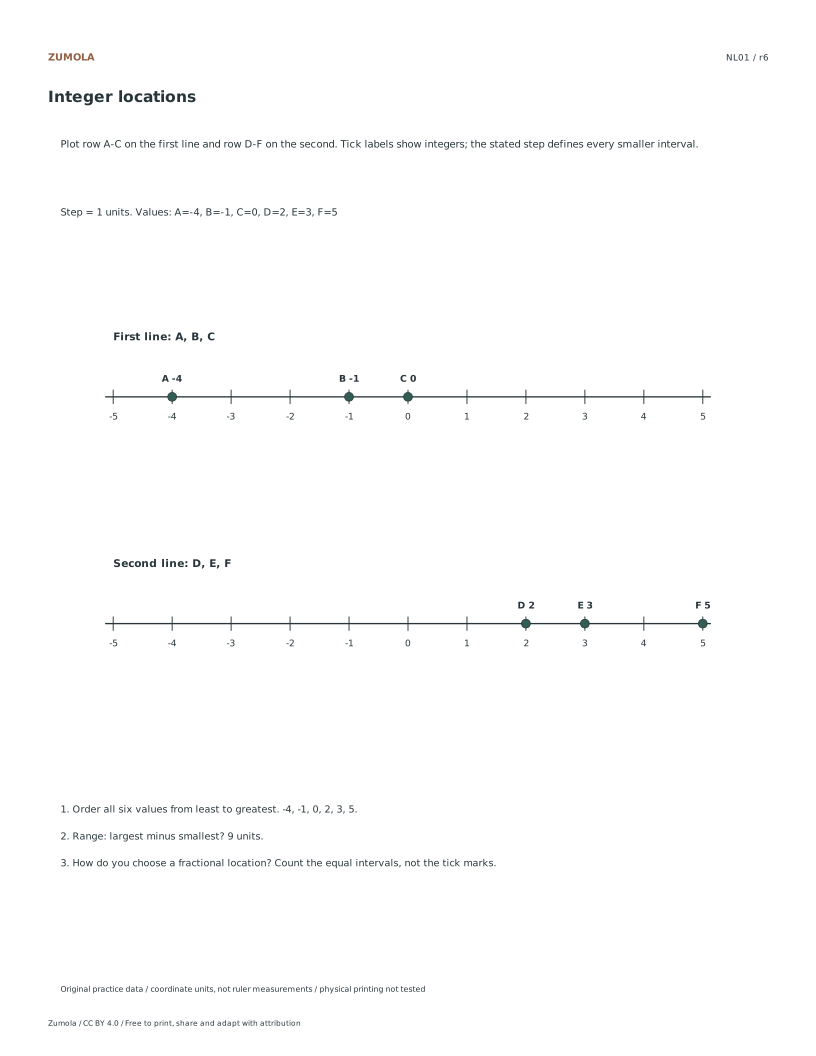
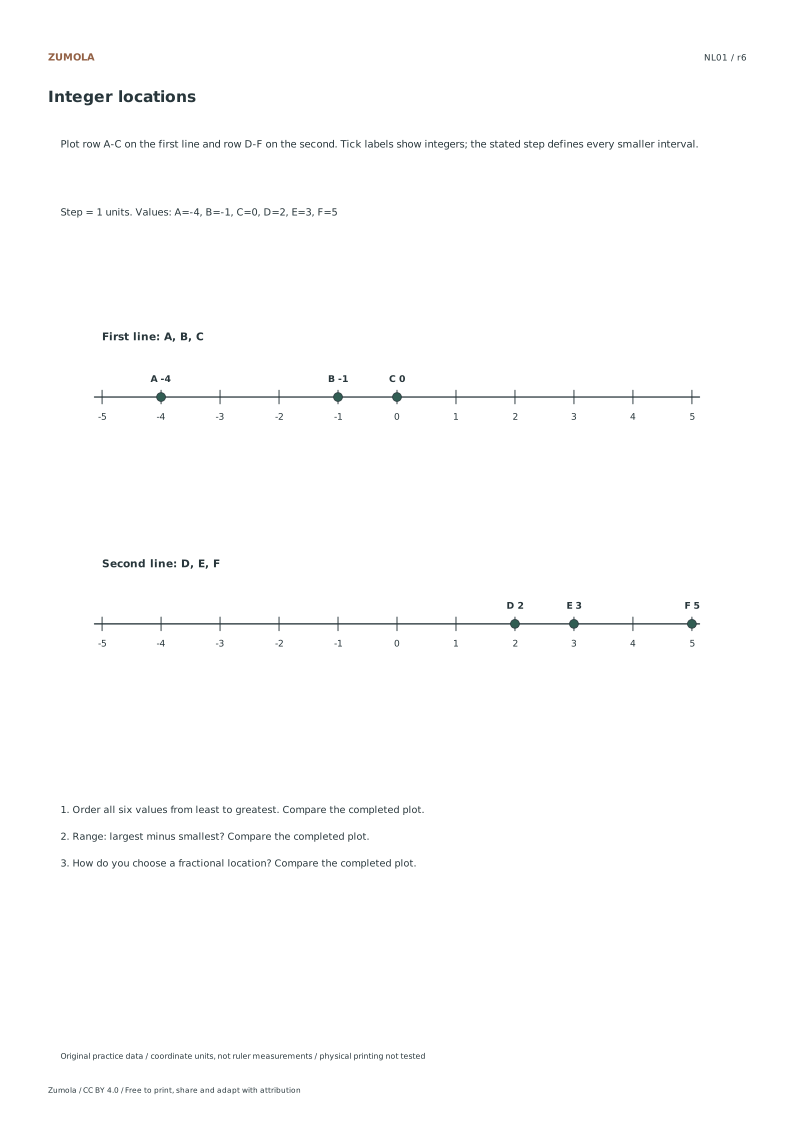
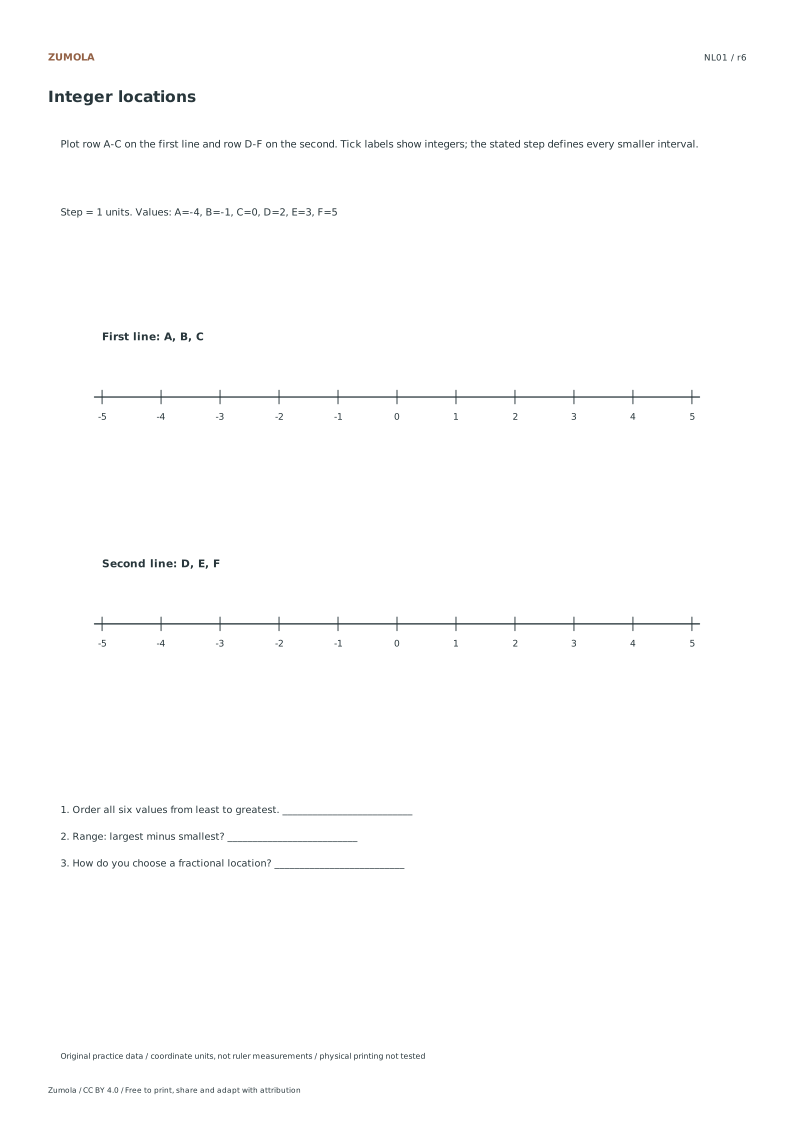
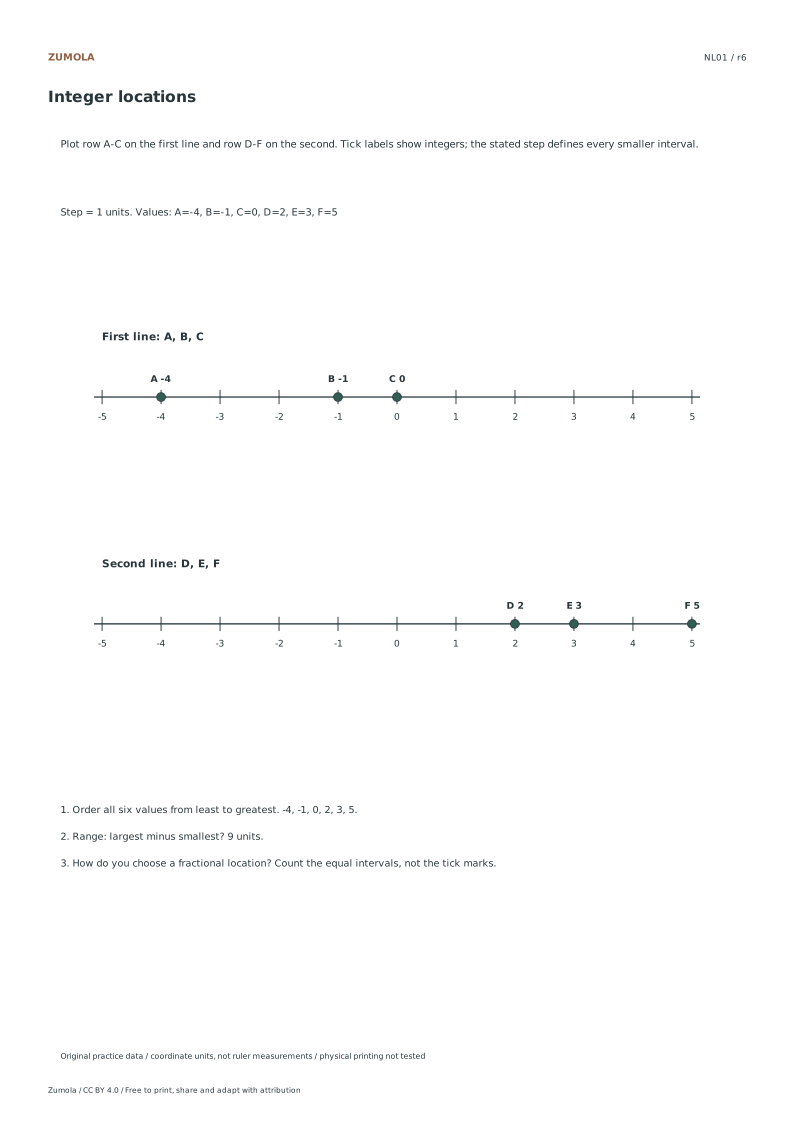
NL01: Integer locations
Check
Worked result
1
-4, -1, 0, 2, 3, 5.
2
9 units.
3
Count the equal intervals, not the tick marks.
The table gives one worked case so you can check the method. The separate answer files contain the completed plots and results for every case. Equivalent fractions and decimals name the same locations.
Work through the graph
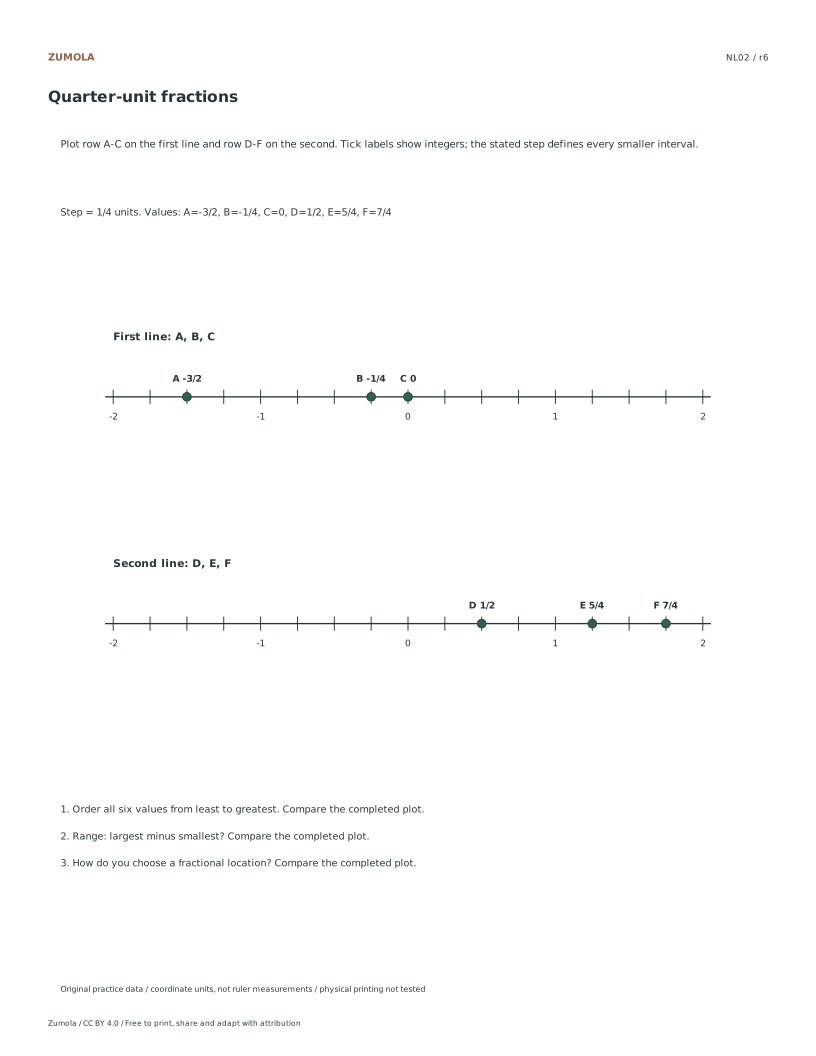
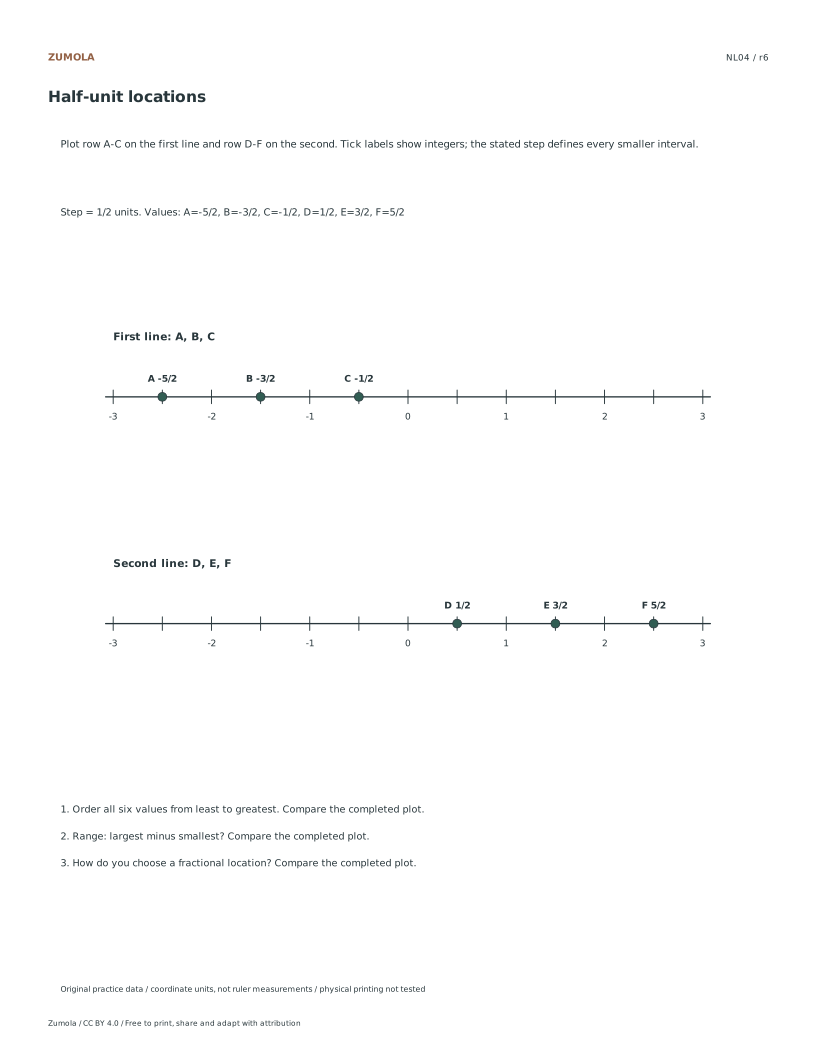
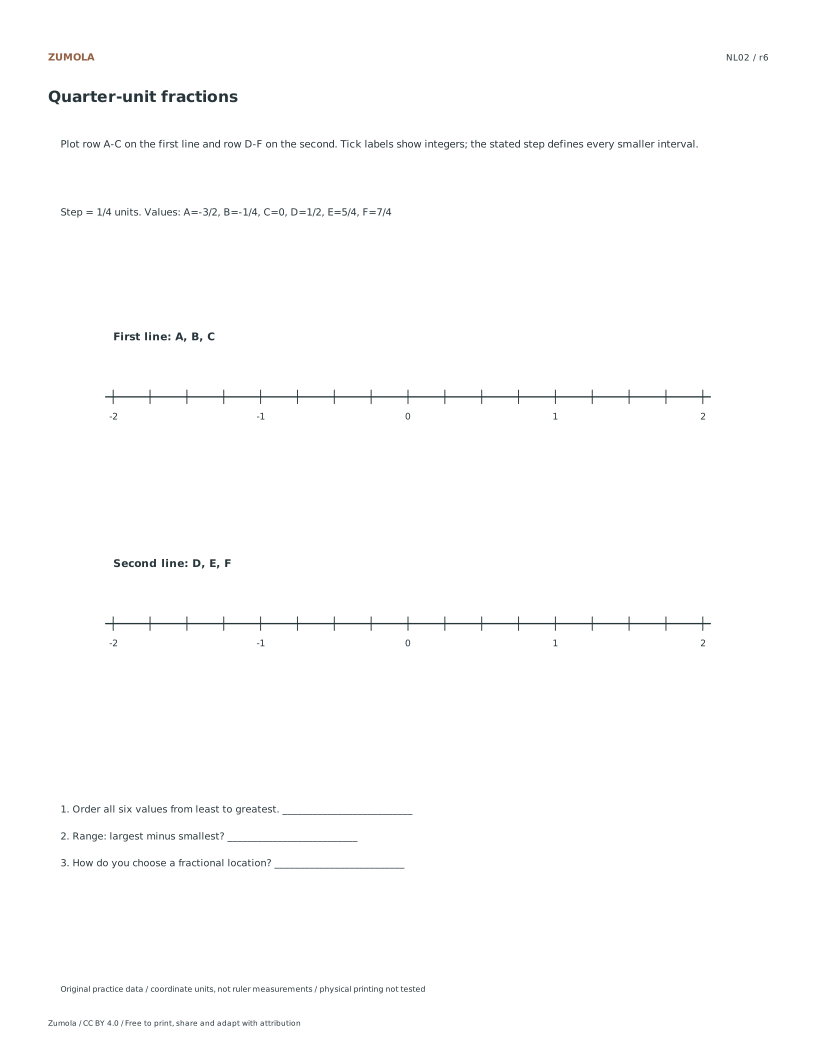
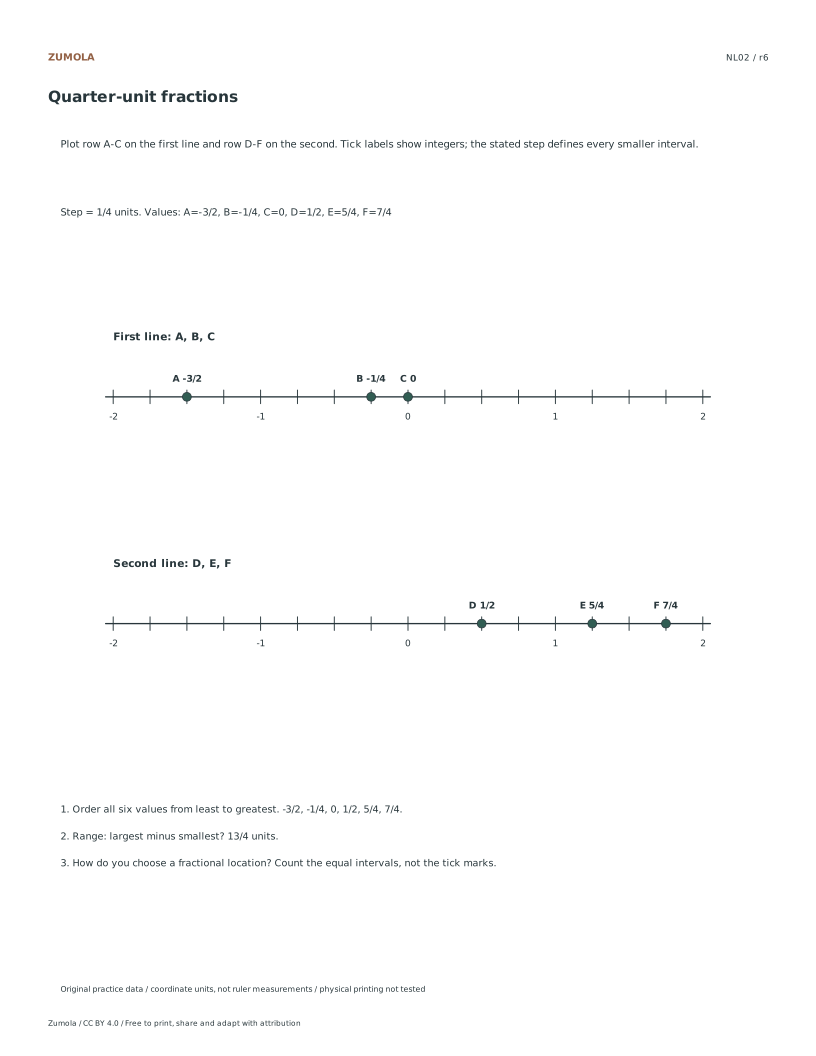
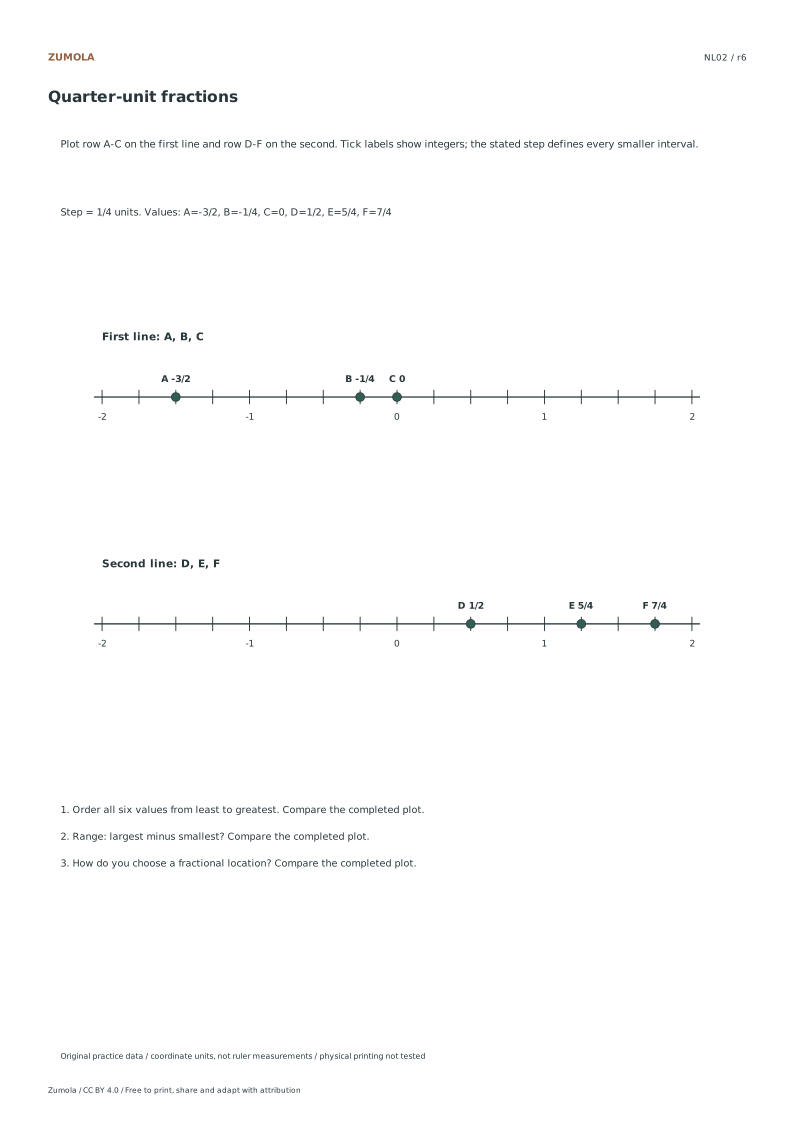
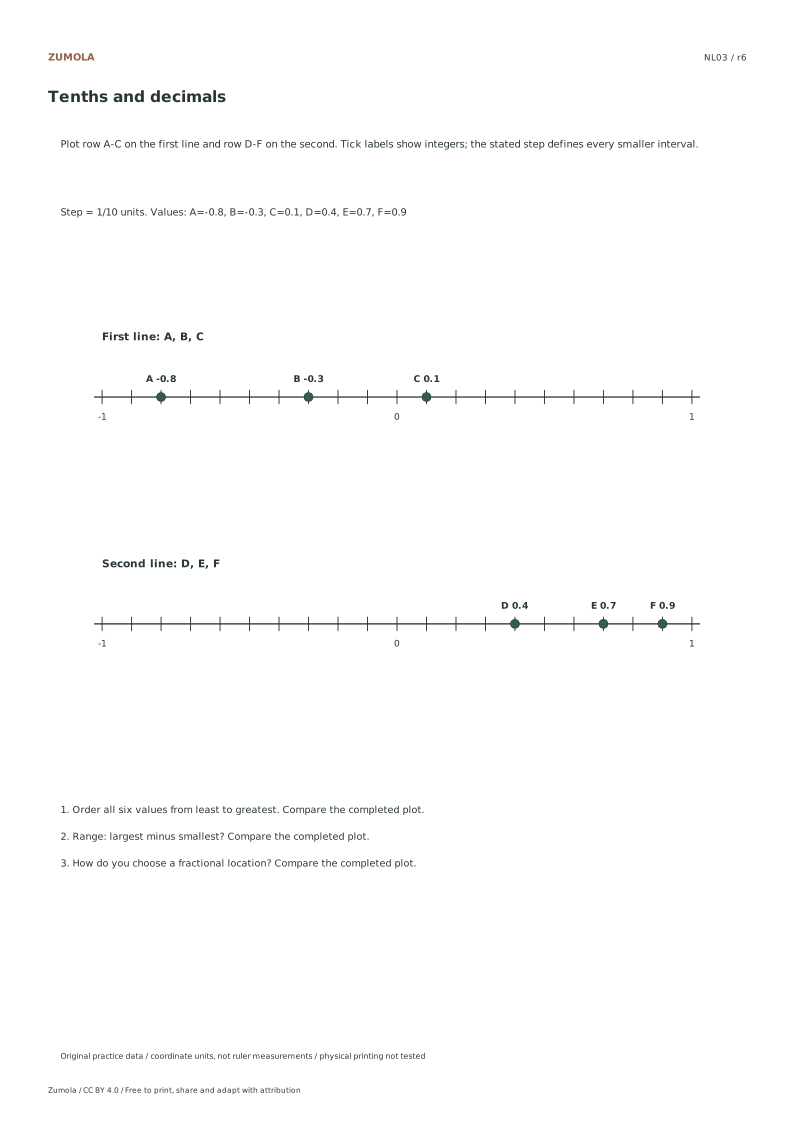
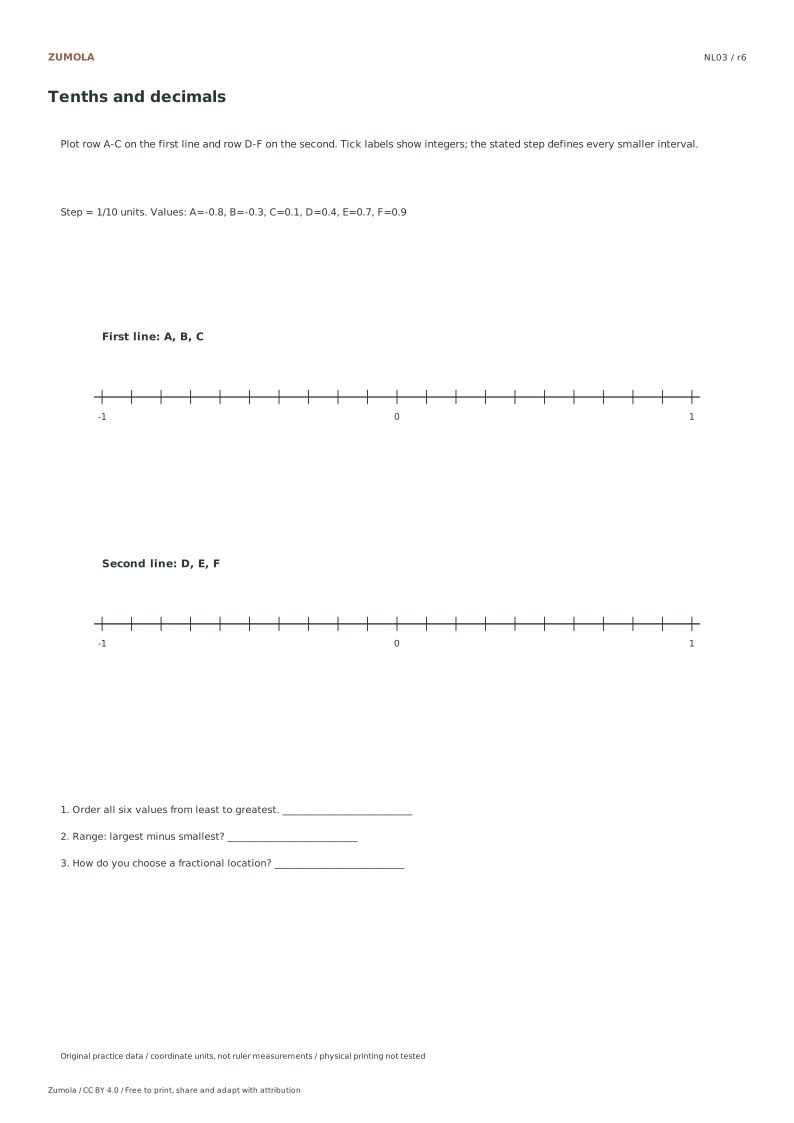
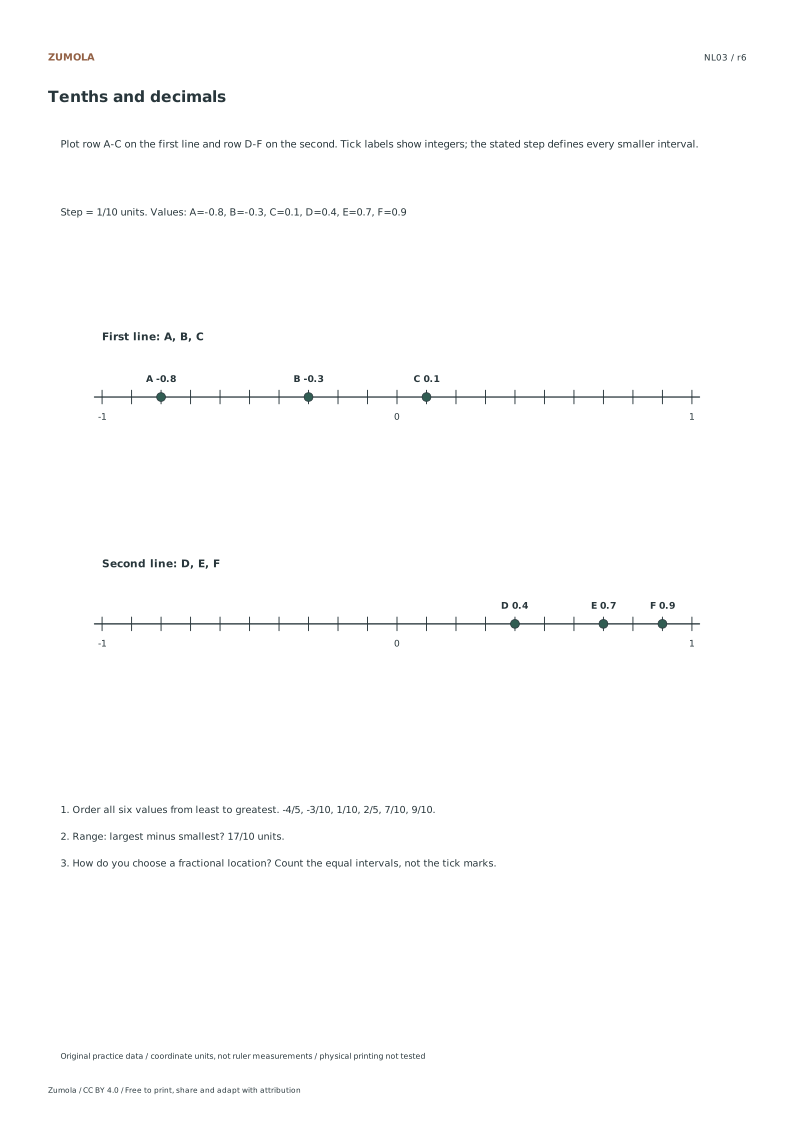
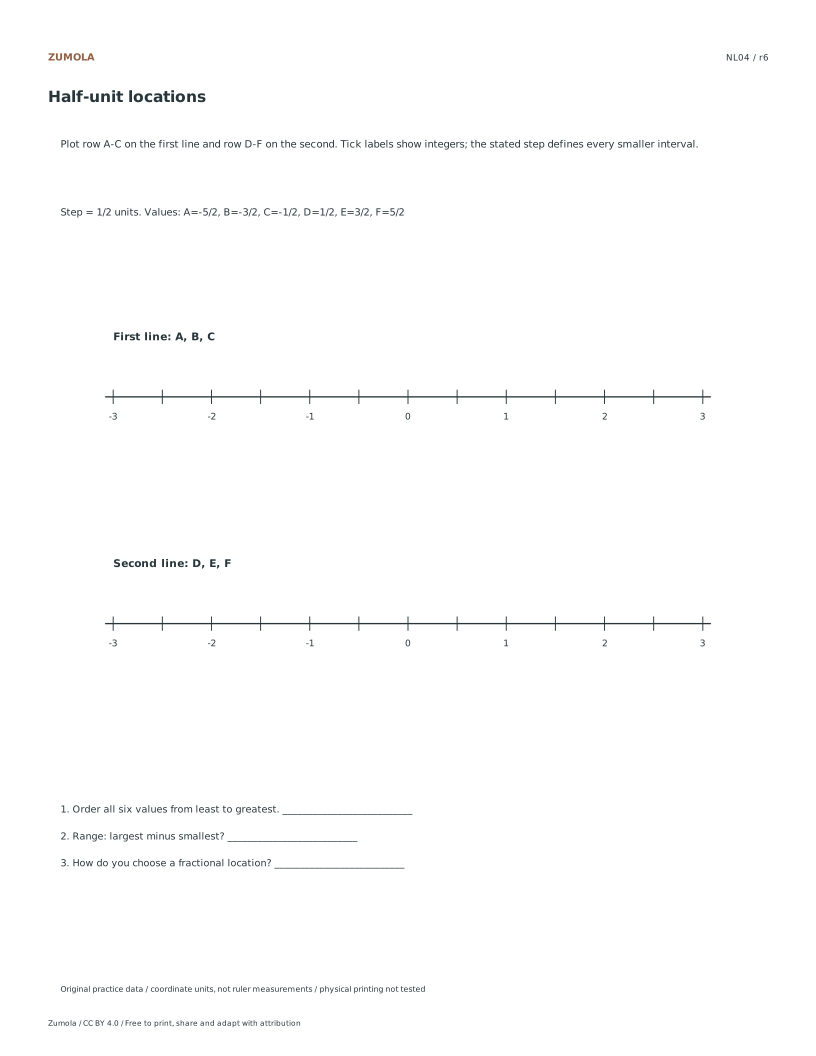
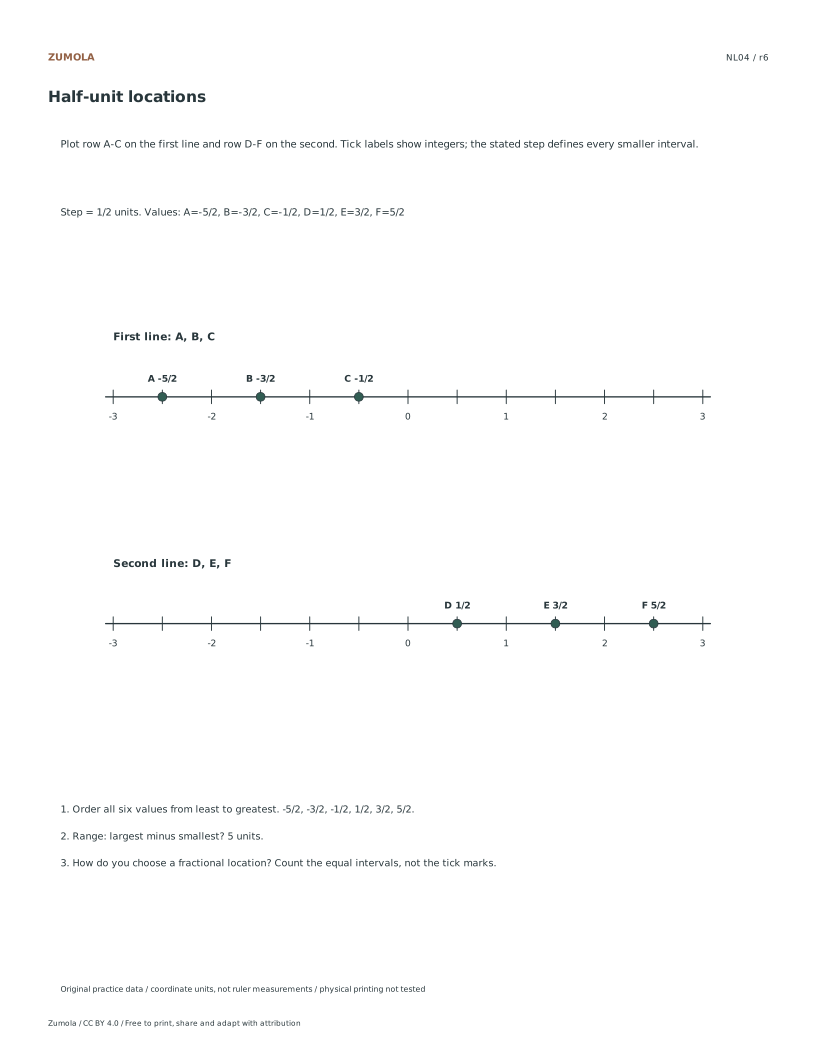
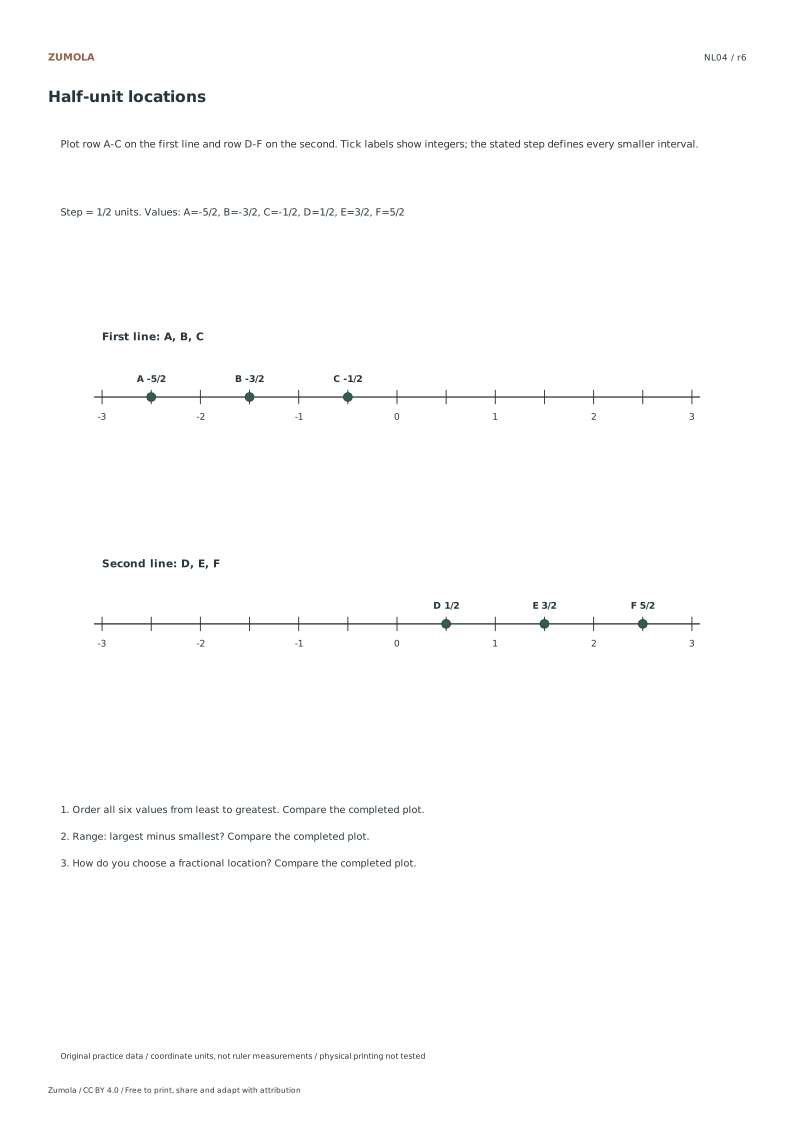
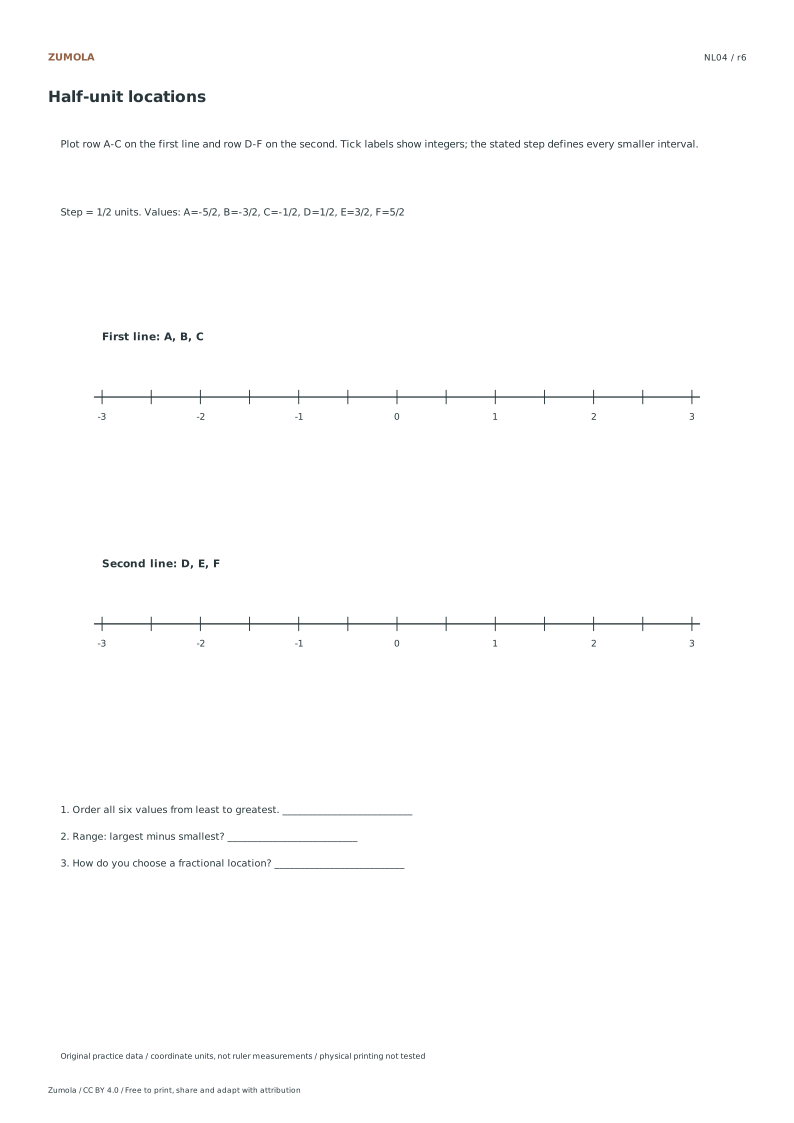
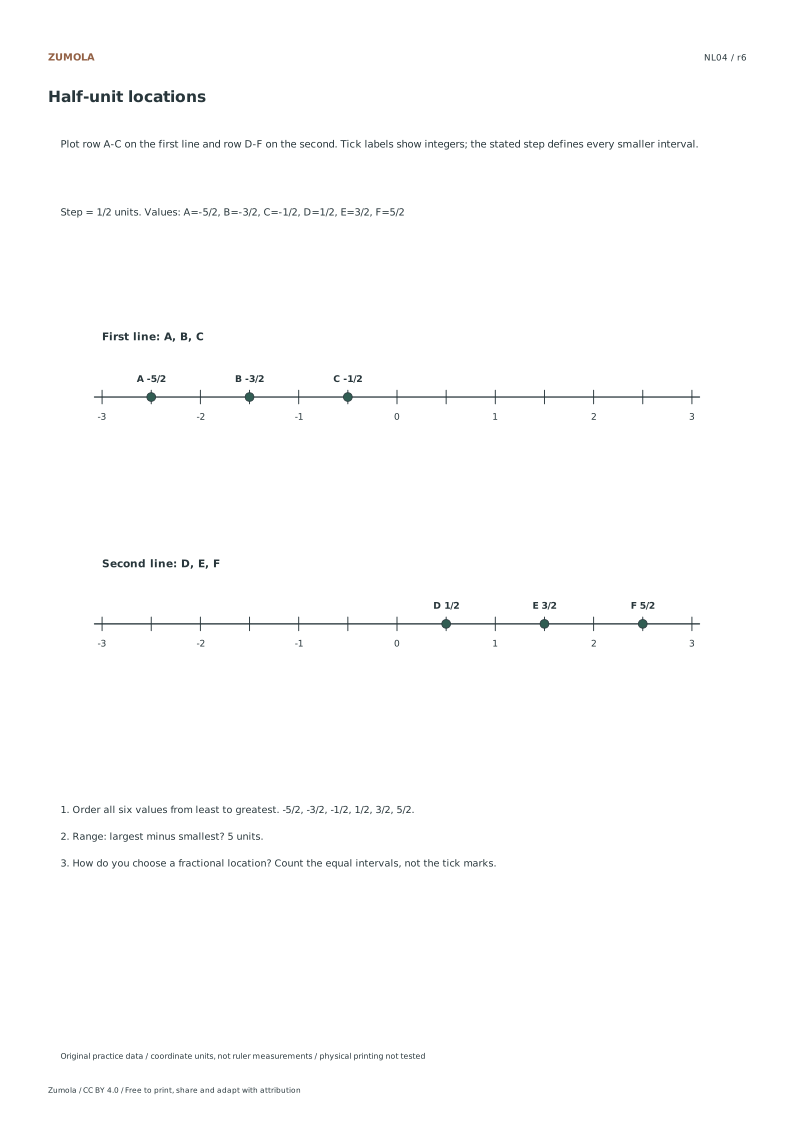
Locating Values on the Number Line Begin by identifying the specific case you are working on, such as integer locations or quarter-unit fractions. Each case provides a defined minimum and maximum value along with a specific step size. For instance, the integer case spans from negative five to positive five with a step of one. Locate zero first, as negative values always appear to the left. Plot the six given numbers in two separate rows of three. Ensure you place each value at its exact coordinate based on the stated step, rather than estimating positions visually. This precise placement is critical for the subsequent sorting and range calculation steps.
Sorting and Calculating Range After plotting the six values, combine them into a single list and sort them from smallest to largest. This ordering is essential for determining the range correctly. Identify the smallest value at the beginning of the sorted list and the largest value at the end. Subtract the smallest value from the largest value to calculate the range. Remember that negative numbers are smaller than positive numbers, so subtracting a negative minimum adds its absolute value in this calculation. This calculation relies entirely on the listed values provided in the resource, ensuring accuracy without physical measurement errors.
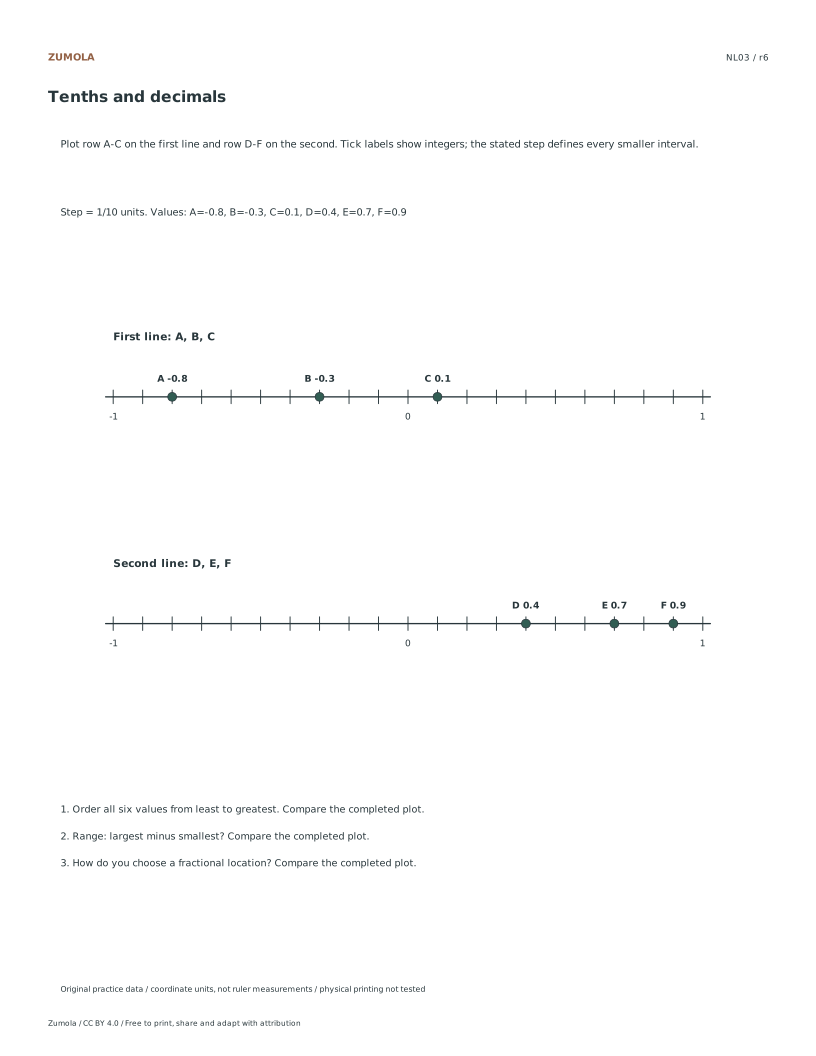
Understanding Interval Counts When analyzing the number line, focus on counting the intervals between marks rather than the marks themselves. This distinction is vital for understanding the scale and step size of each case. For example, in the tenths and decimals case, the step is one-tenth, meaning each interval represents that specific increment. Whole integers are labeled clearly, while fractional subdivisions are indicated by ticks with their step stated. By counting intervals, you verify the distance between plotted points accurately. This method ensures that your interpretation of the number line aligns with the mathematical definitions provided in the original fictional classroom examples.
Checks that catch common errors
Watch for
Check instead
Counting the tick marks instead of the intervals between them when determining distance.
Count the spaces between the marks to determine the correct number of steps or intervals.
Placing negative values to the right of zero on the number line.
Always place negative values to the left of zero, as they represent values less than zero.
Using a physical ruler to measure distances on the printed PDF for answers.
Rely on the digital units and plotting coordinates provided in the resource to determine answers.
Keep the labels and margins readable
Choose the Letter or A4 file that matches your paper. Actual size / 100% preserves the designed layout; a different uniform print scale changes physical lengths but does not change the listed numbers or the arithmetic. Keep the whole chart and all labels inside the printable area. A ruler can help draw straight segments, but calculate from the stated numerical scale.
These files have digital geometry, arithmetic and page-boundary checks. Physical printer and classroom trials have not been completed. The resources are practice material, with no claim of curriculum certification or precision-instrument accuracy. The original files use CC BY 4.0: credit Zumola, link the license and indicate changes.
Useful answers
Why are only integers labeled?
Fractional and decimal positions are still marked by equal ticks. Read the stated step, such as 1/4 or 1/10, to locate values between the labeled integers.
Can a fraction and a decimal share a location?
Yes. Equivalent values such as 1/2 and 0.5 name the same point. Changing notation does not move the point.
How do I find range when the minimum is negative?
Subtract the smallest value from the largest. For the quarter-unit case, 7/4 - (-3/2) = 13/4 units. Count the interval span rather than the tick marks.
Are the answer files and editable graphs free?
Yes. Reference, student and worked-answer files are all free without an account. Single sheets include PDF and SVG; collection packs are PDF files. Analytics consent is not required to download.
Optional Google Analytics helps us understand which free resources are useful. It is off until you allow it. Drawing tools and downloads work with either choice. Privacy details