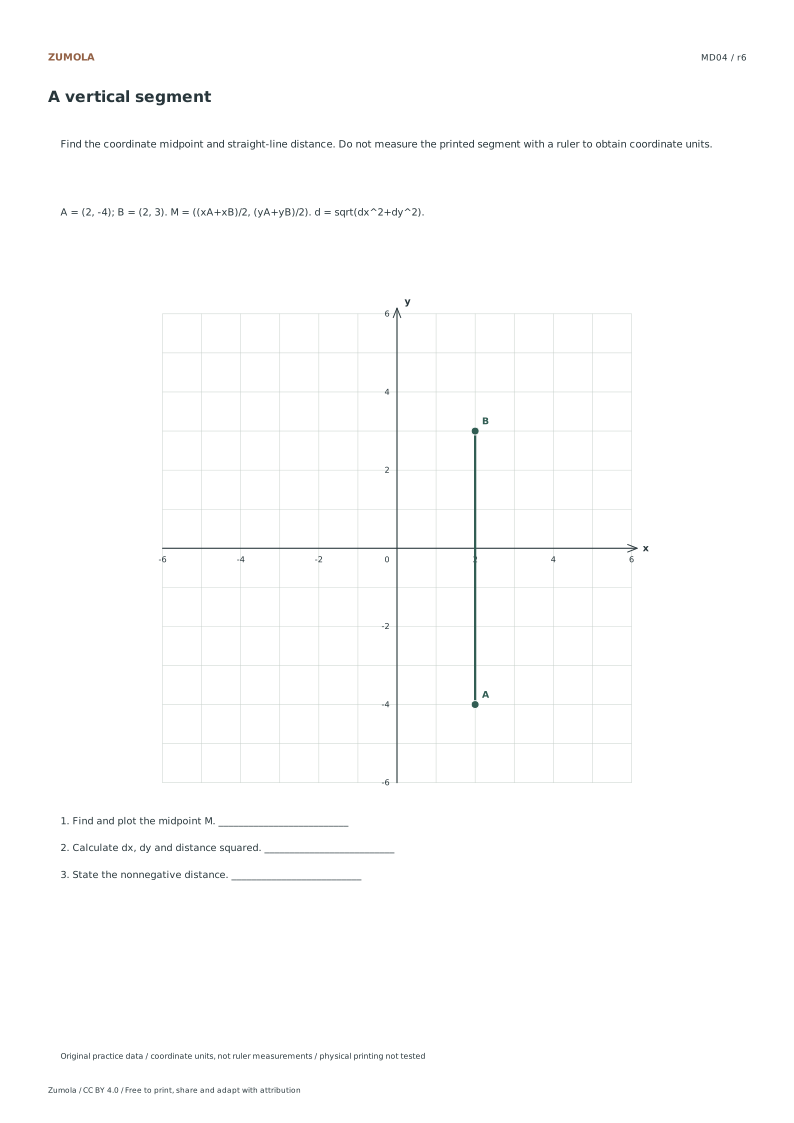
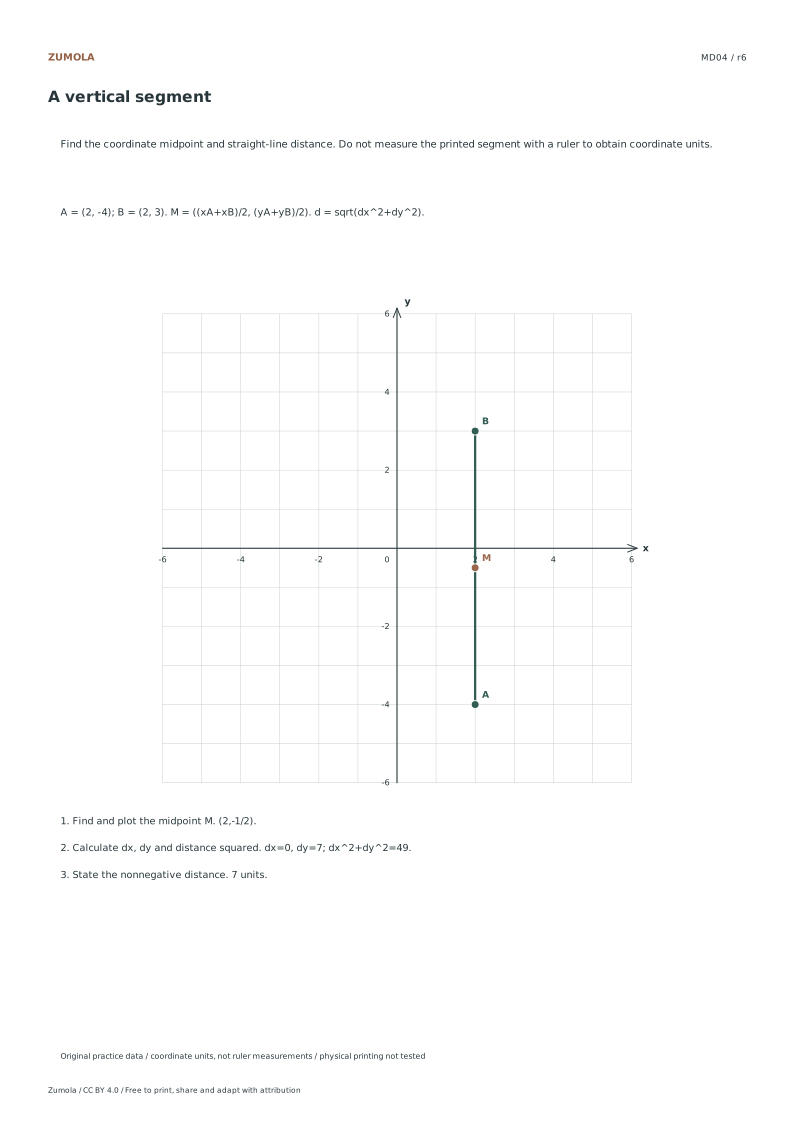
Midpoint and distance. One segment, two calculations.
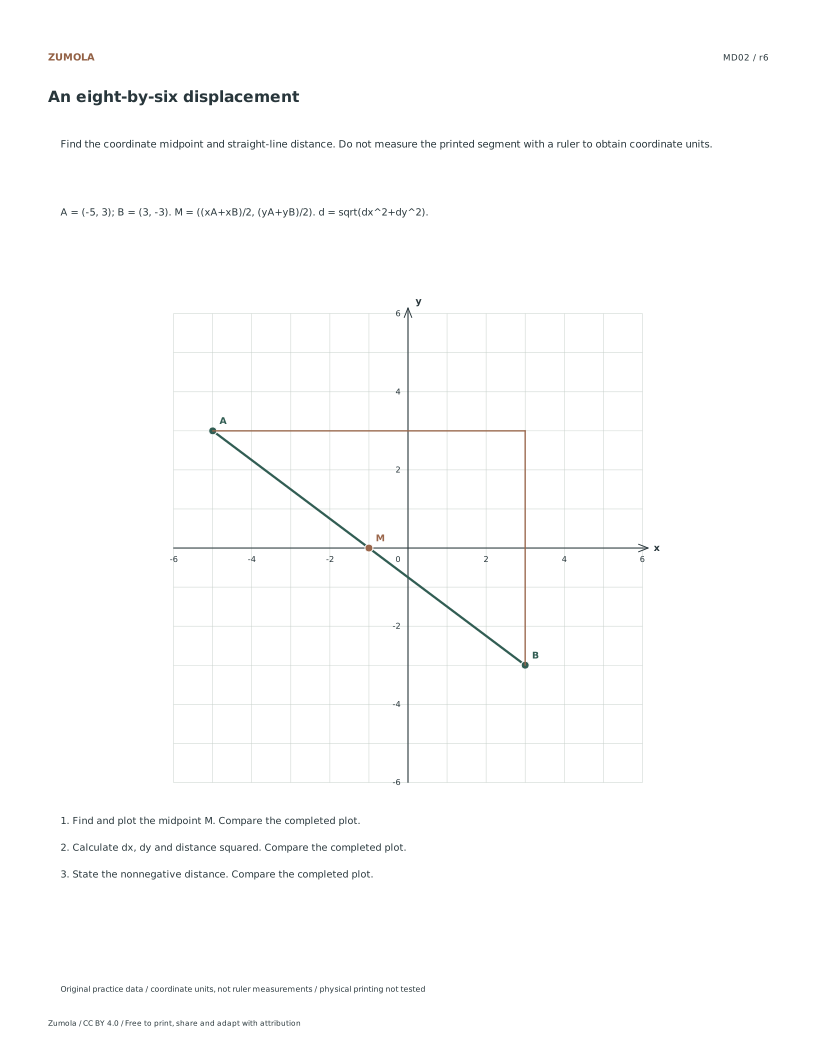
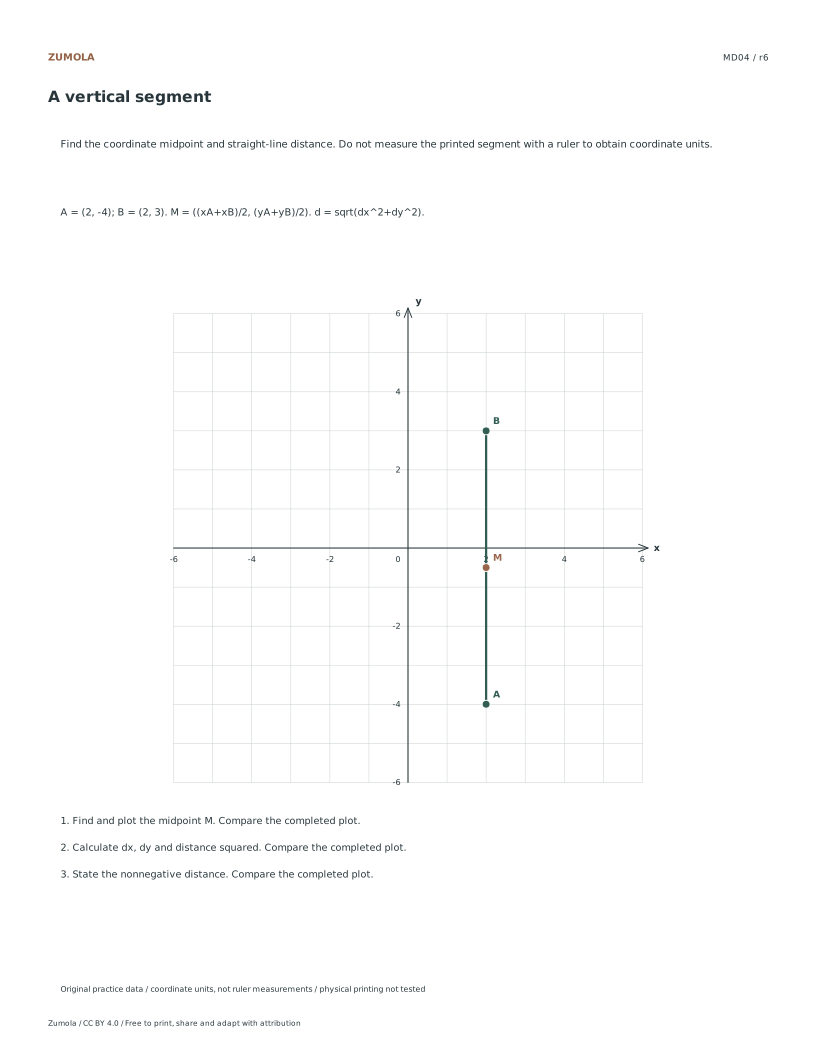
Find a segment midpoint by averaging coordinates, then calculate its straight-line distance. Compare ordinary, vertical, fractional and coincident-endpoint cases.
6 endpoint pairs. Exact radicals + worked answers.
A graph, a task and a worked check
Find a segment midpoint by averaging coordinates, then calculate its straight-line distance. Compare ordinary, vertical, fractional and coincident-endpoint cases.
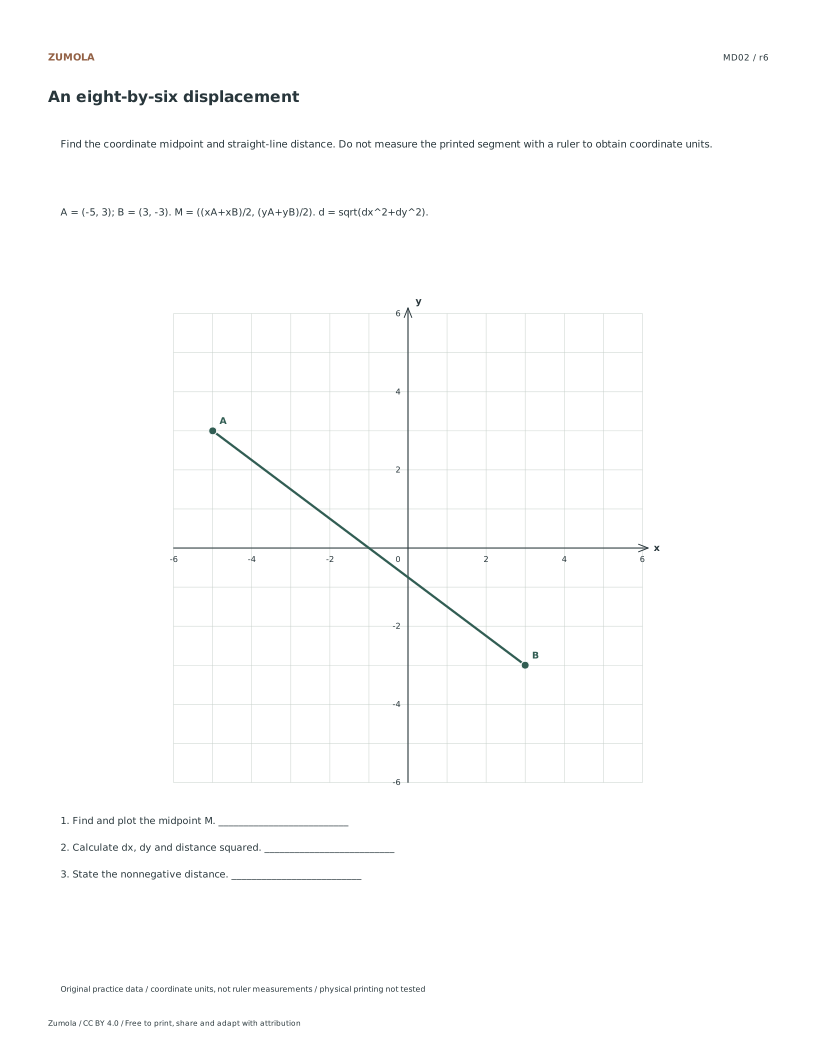
Use the student pack for an attempt, then compare the separate reference or worked answer. Every case is original. All PDF and editable SVG resources are free without signup; each collection pack repeats its individual sheets in the same order.
Choose your paper and download
Download paper size
Every worksheet and answer is free. No signup.
The complete collection
Keep practice and answers separate.
Use the student pack first, then compare the reference or answer. Packs are PDFs; individual sheets below also include editable SVG files. The paper choice applies to every download.
The examples and datasets are made for these worksheets. They are not measured classroom results, published textbook questions or evidence about real people. Axis values and the supplied data determine the answers; paper measurements do not replace those numbers.
Check the first case
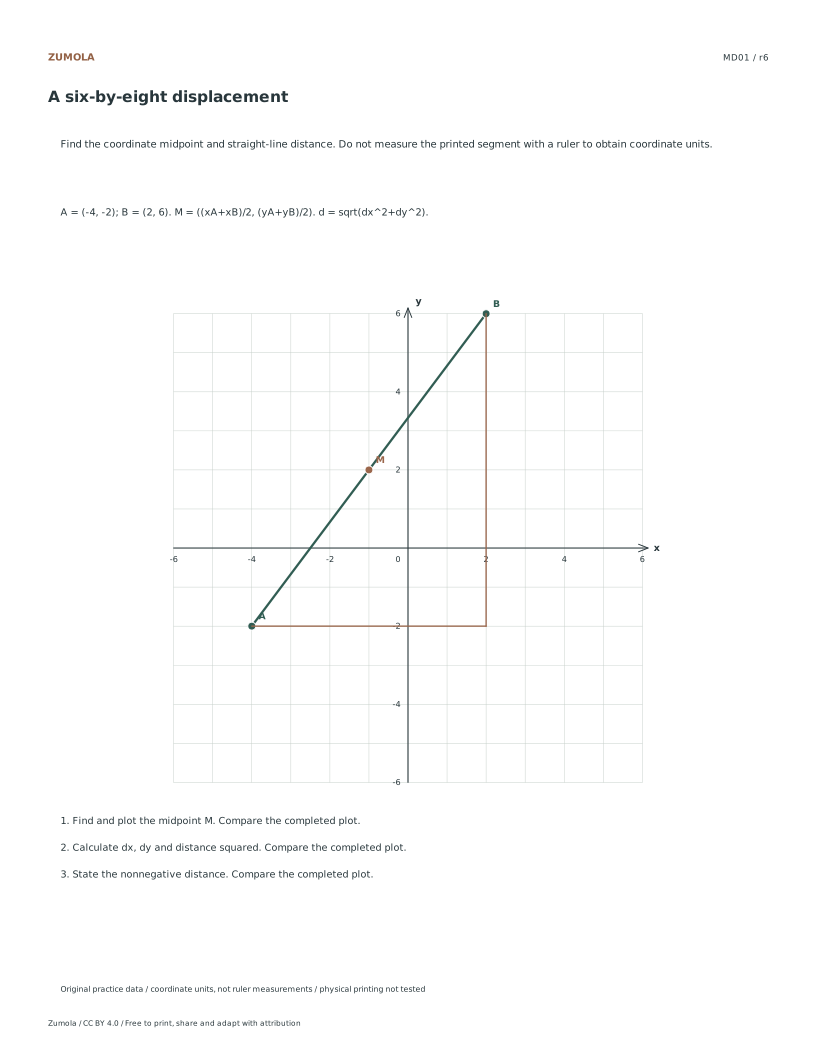
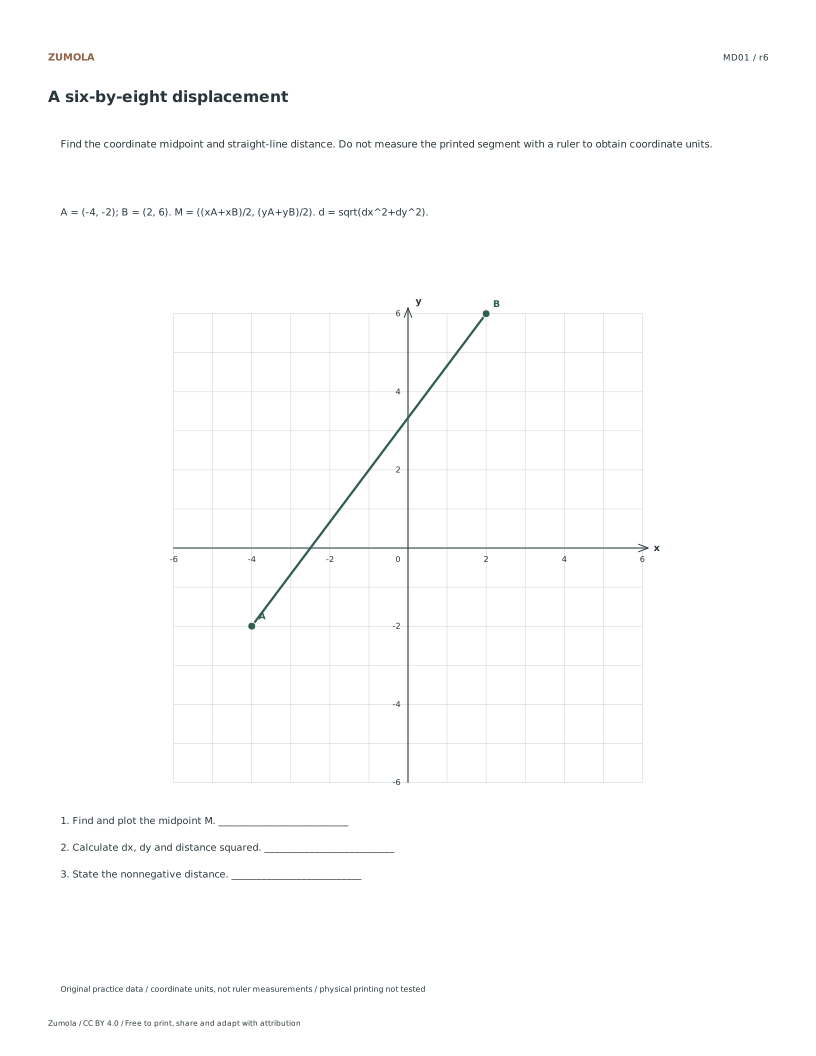
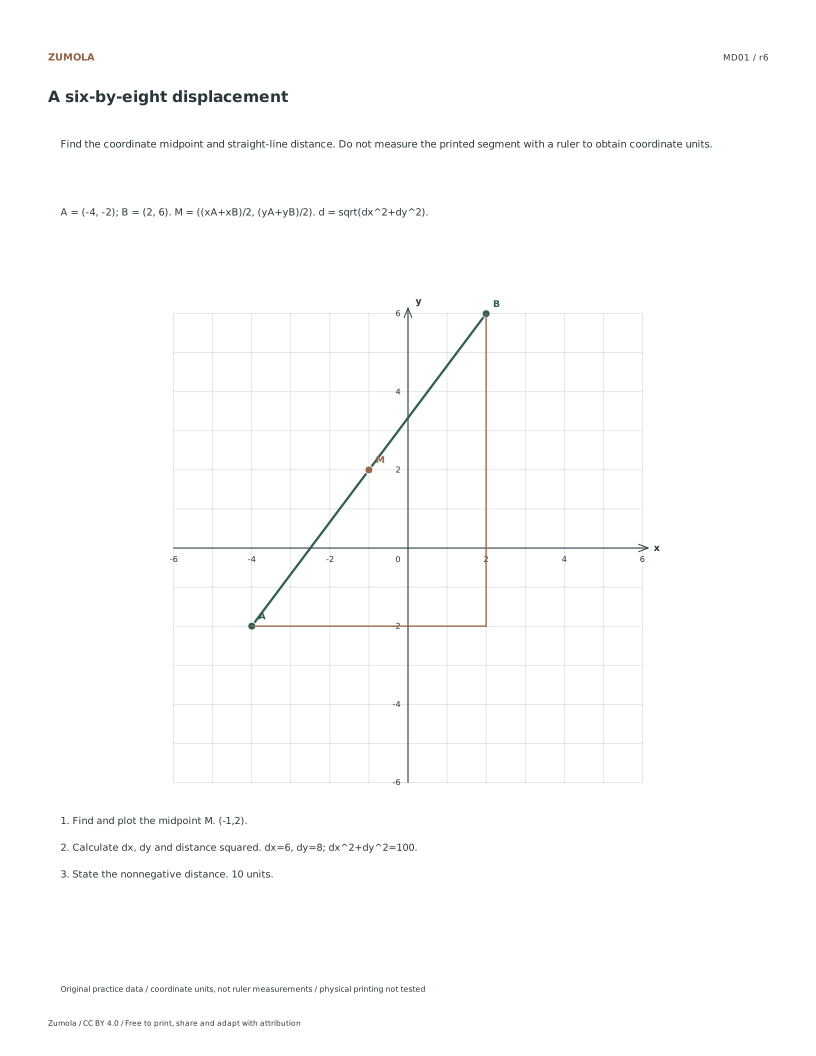
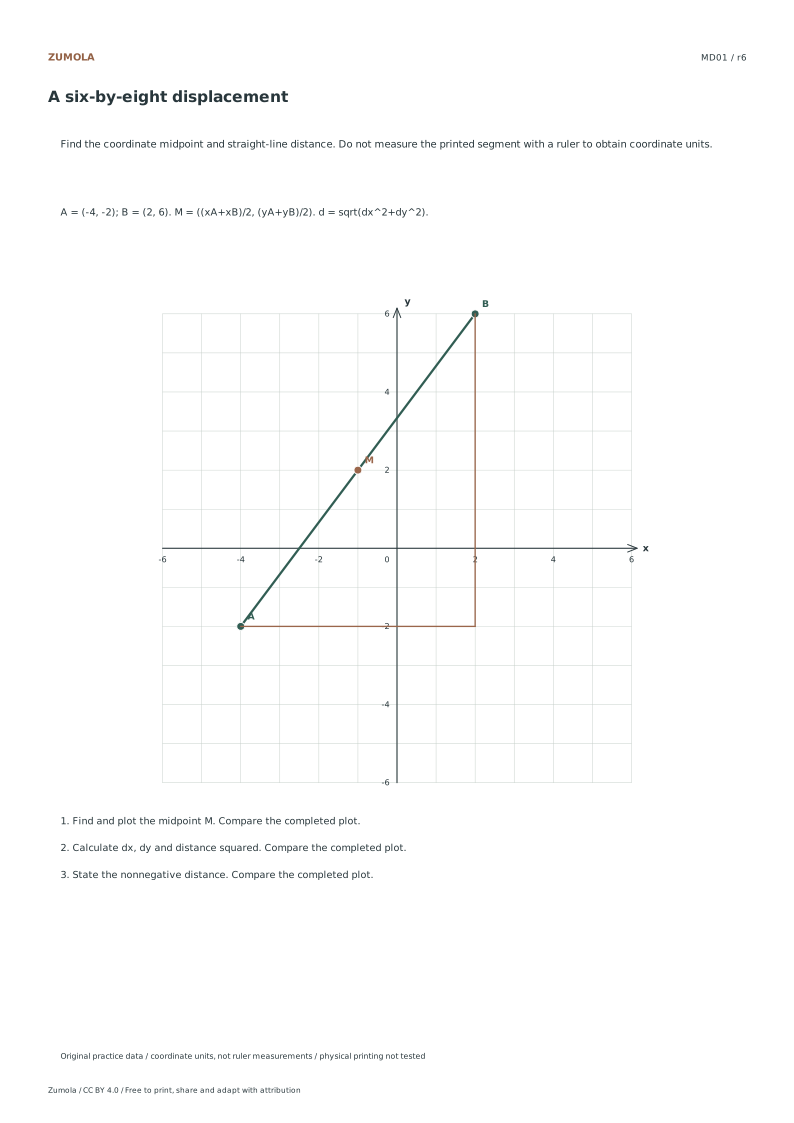
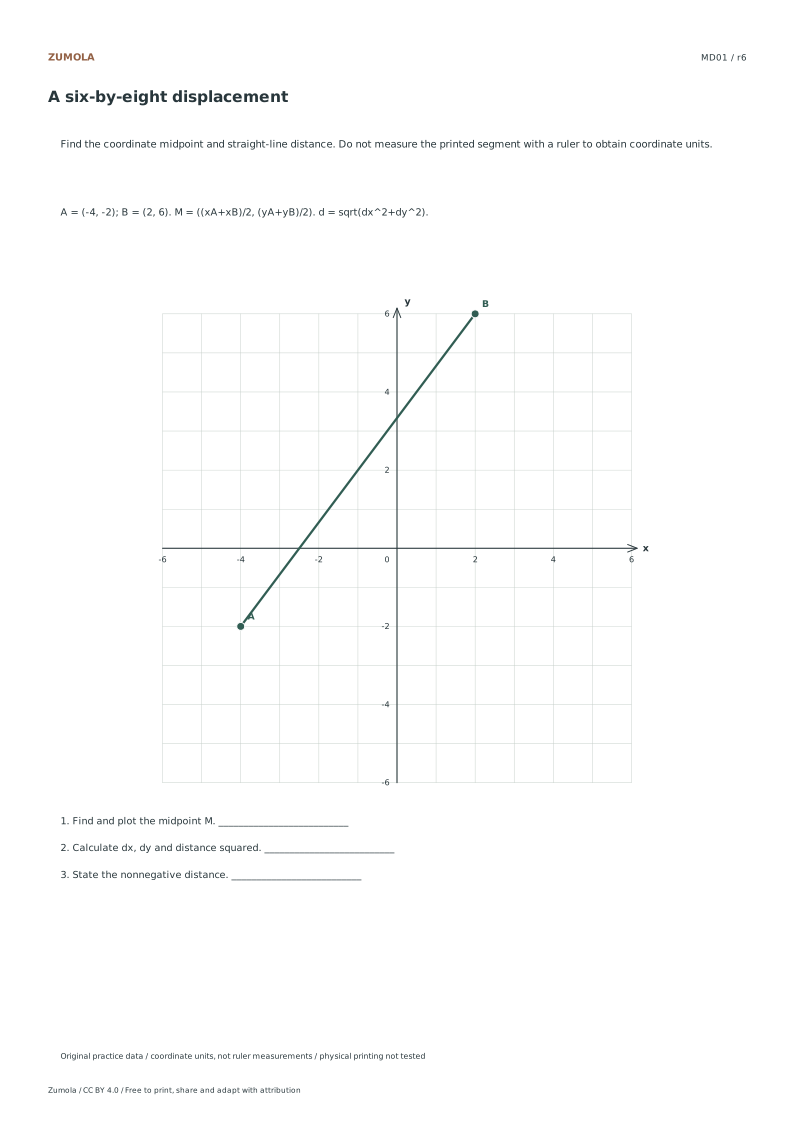
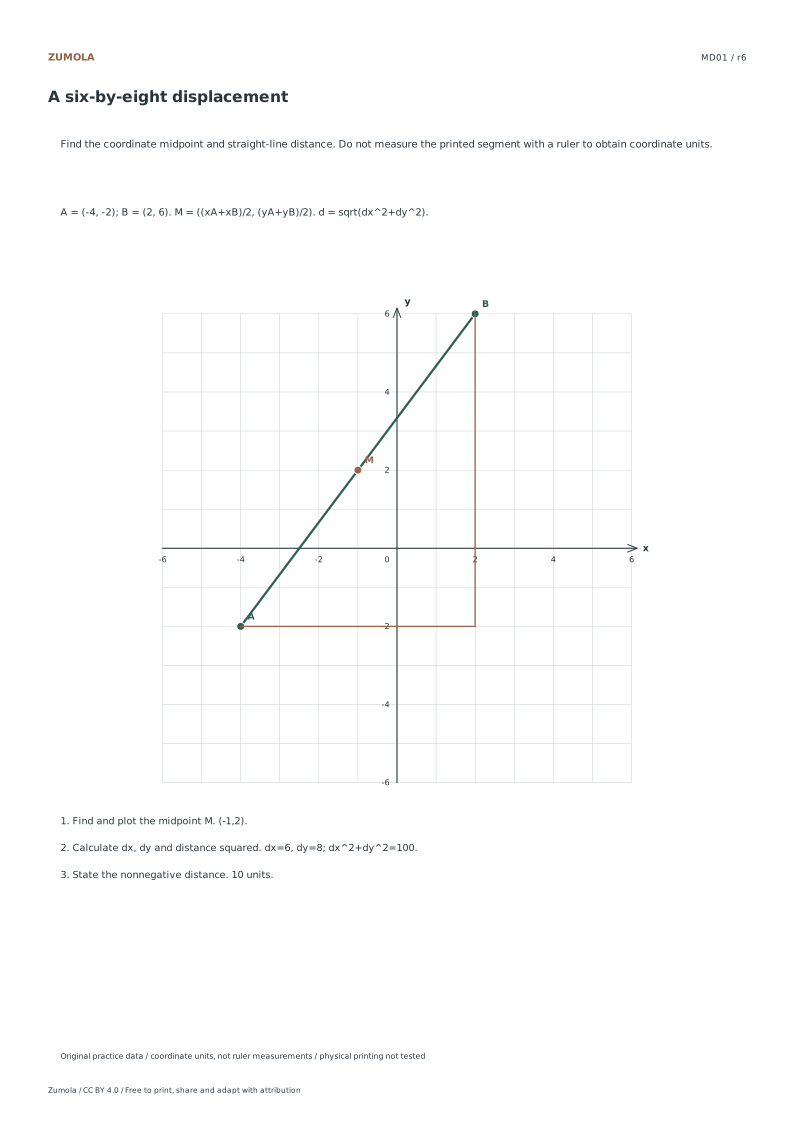
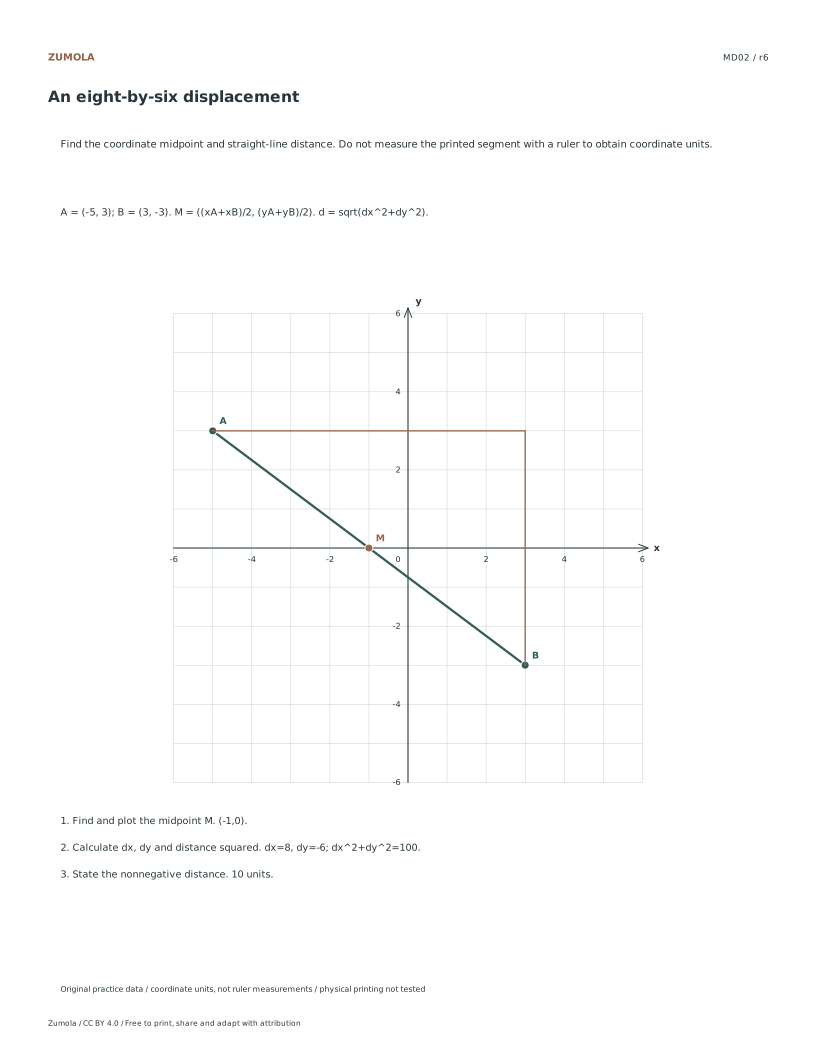
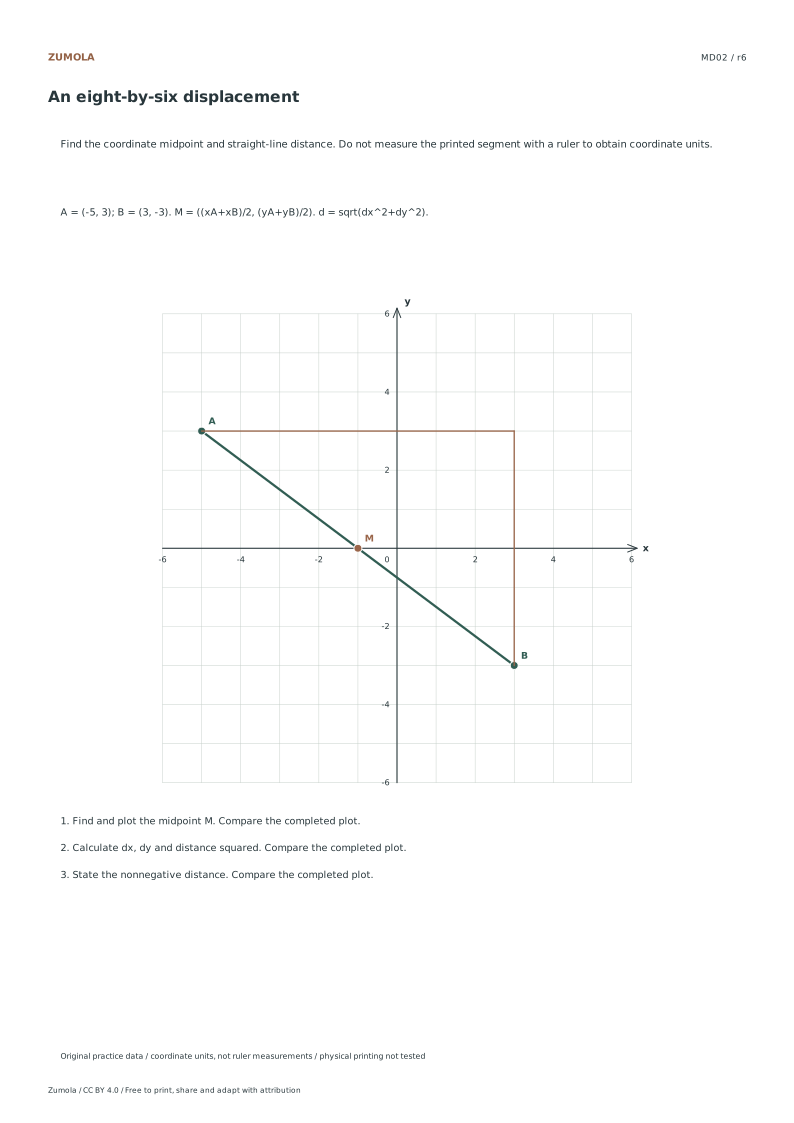
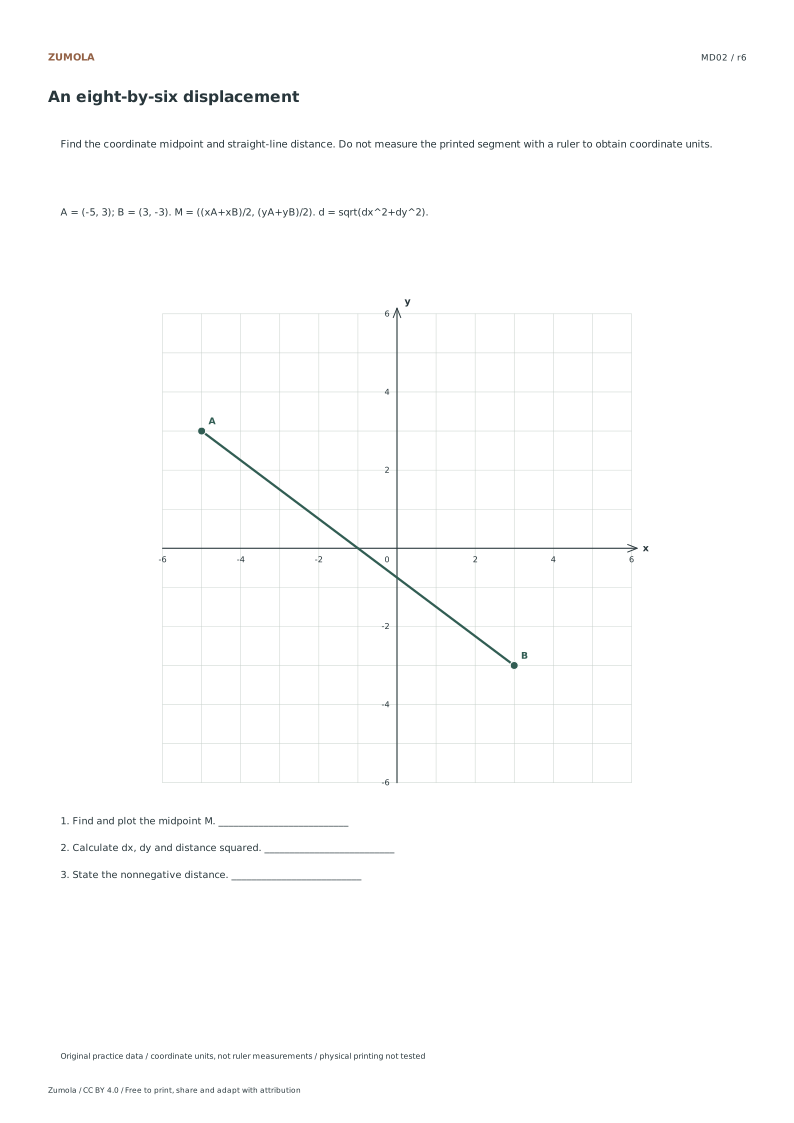
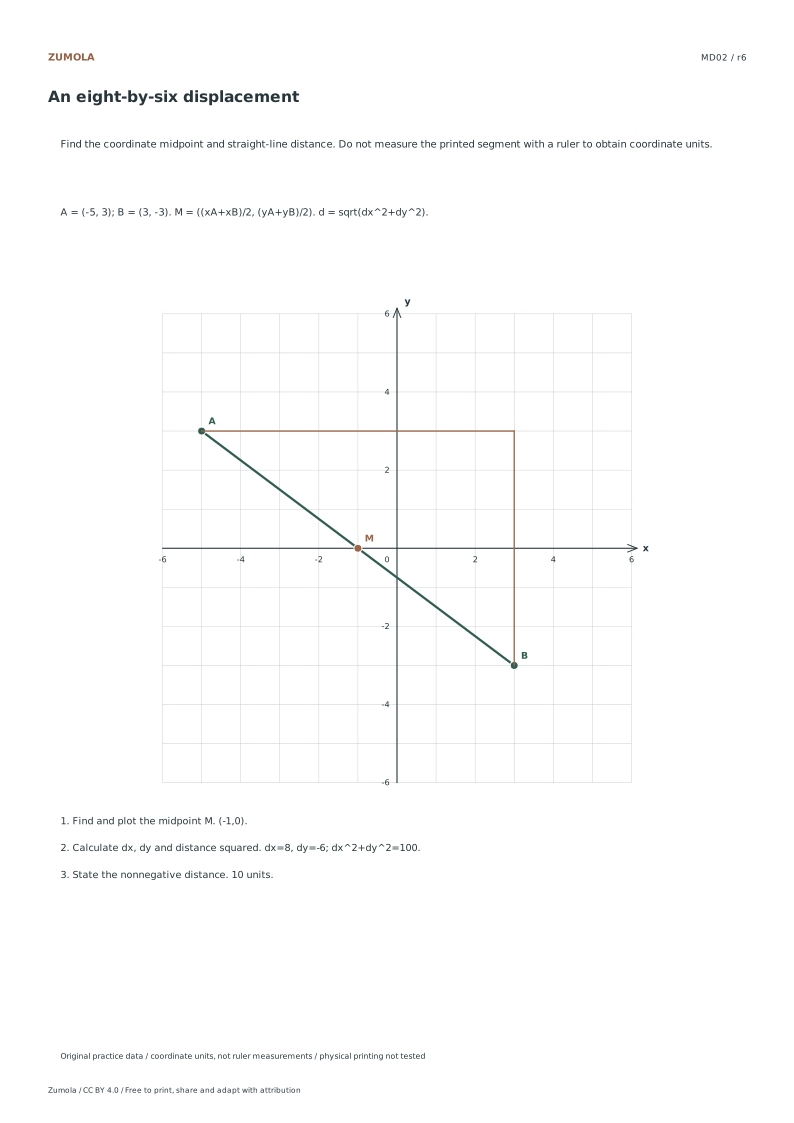
MD01: A six-by-eight displacement
Check
Worked result
1
(-1,2).
2
dx=6, dy=8; dx^2+dy^2=100.
3
10 units.
The table gives one worked case so you can check the method. The separate answer files contain the completed plots and results for every case. An exact radical is preferred; label a decimal distance as approximate.
Work through the graph
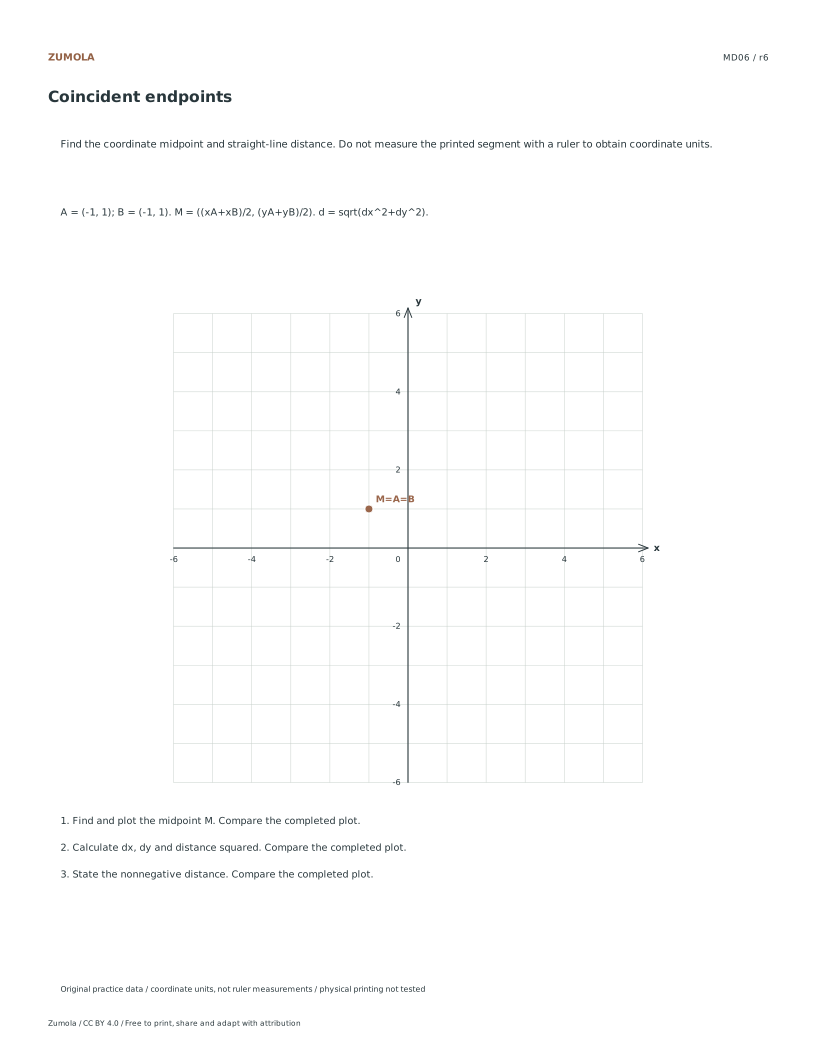
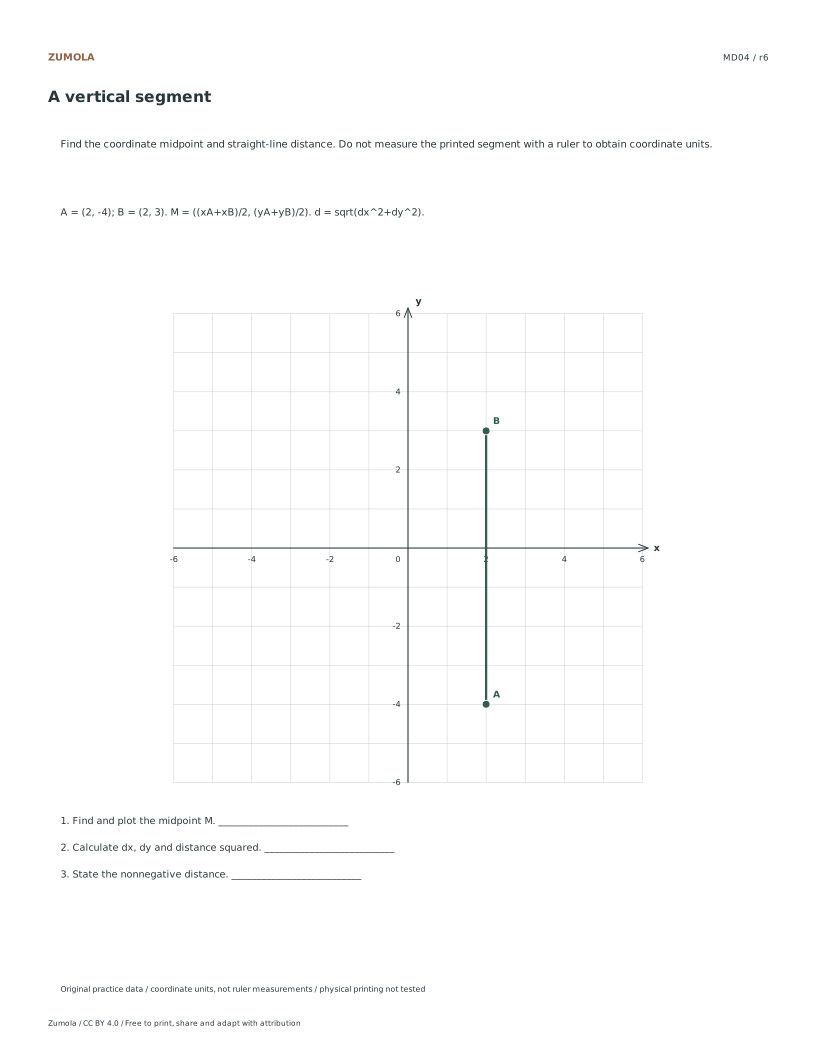
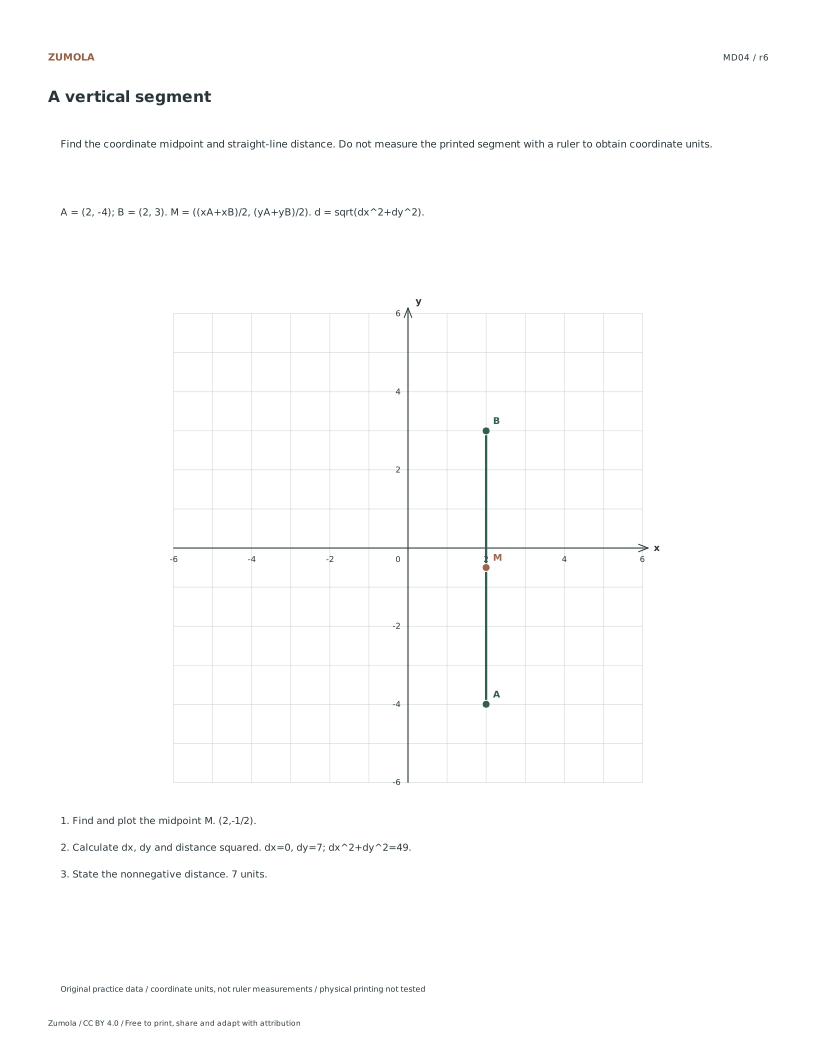
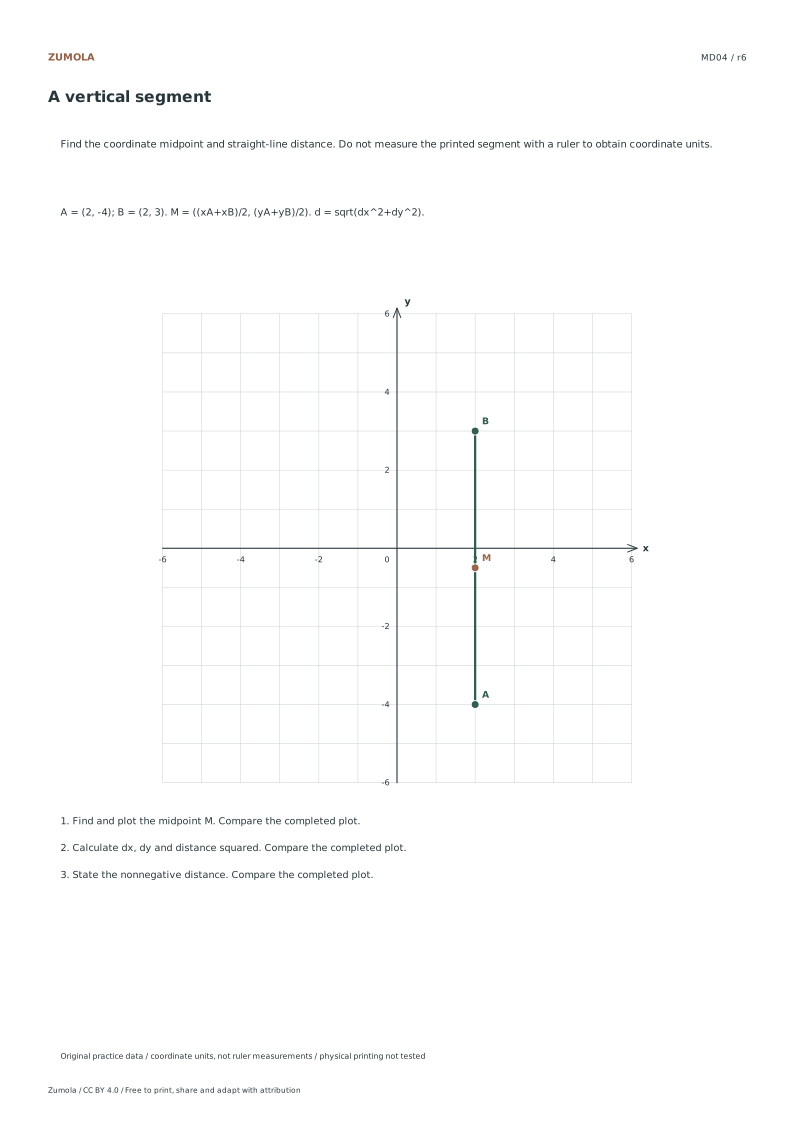
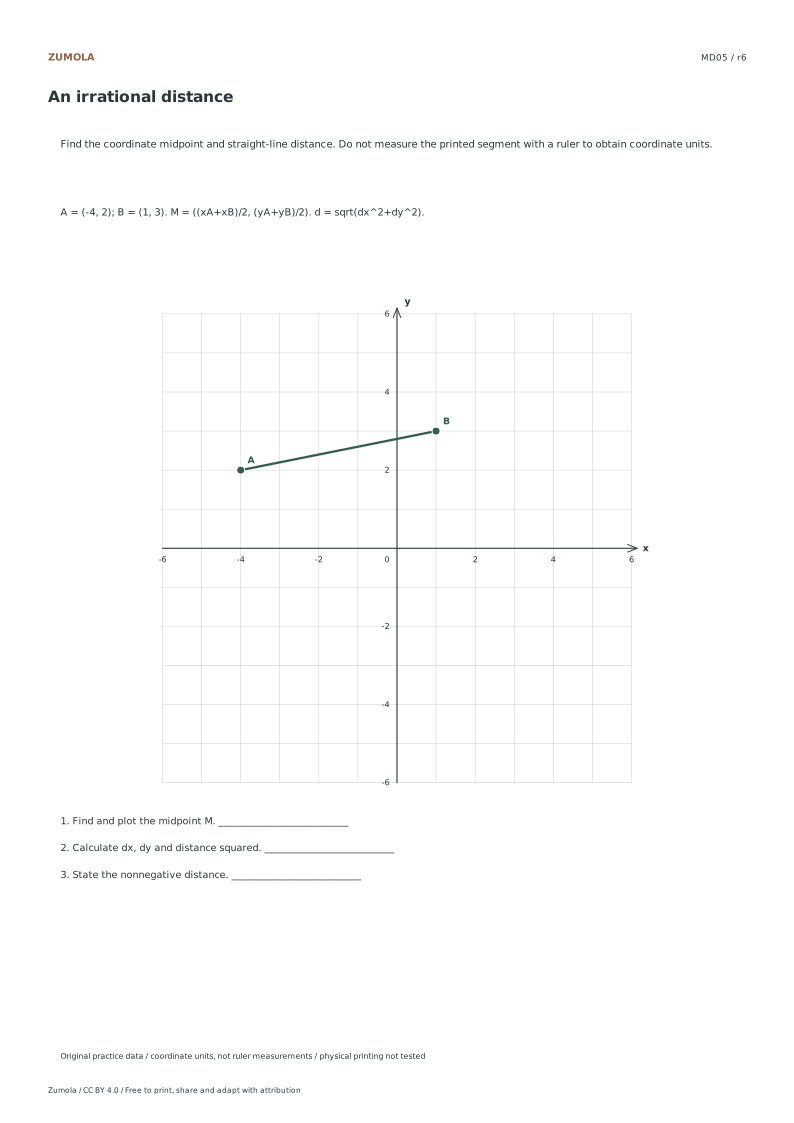
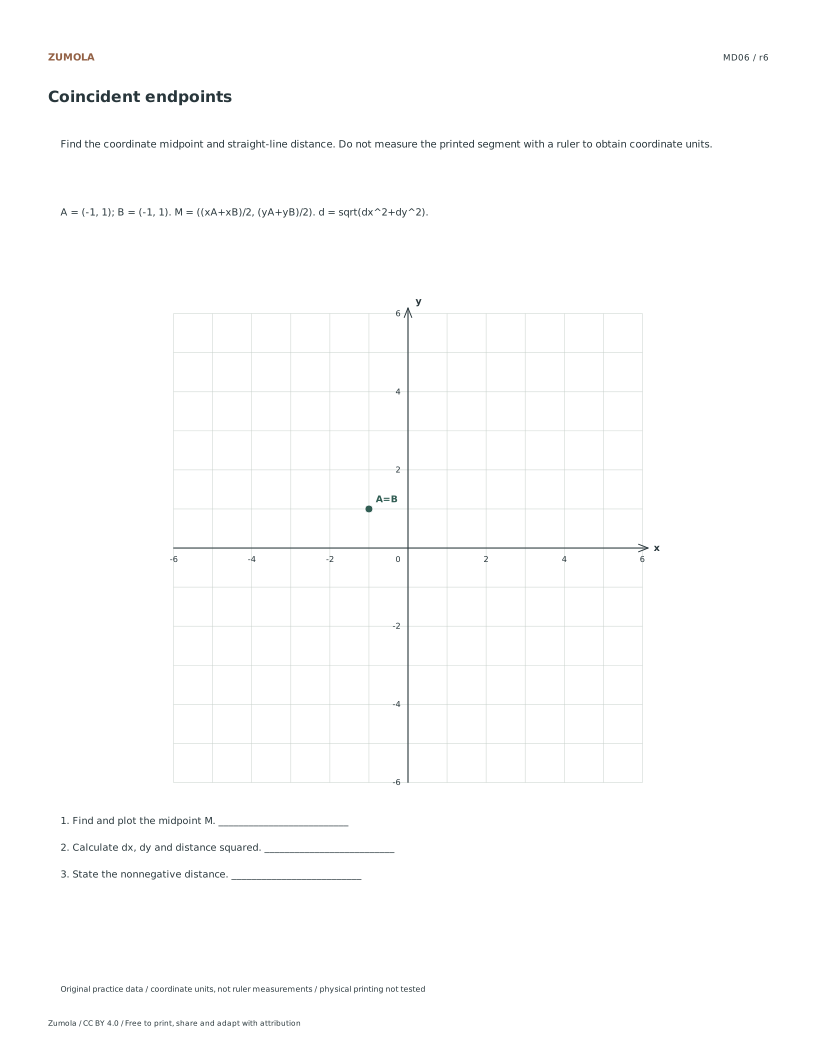
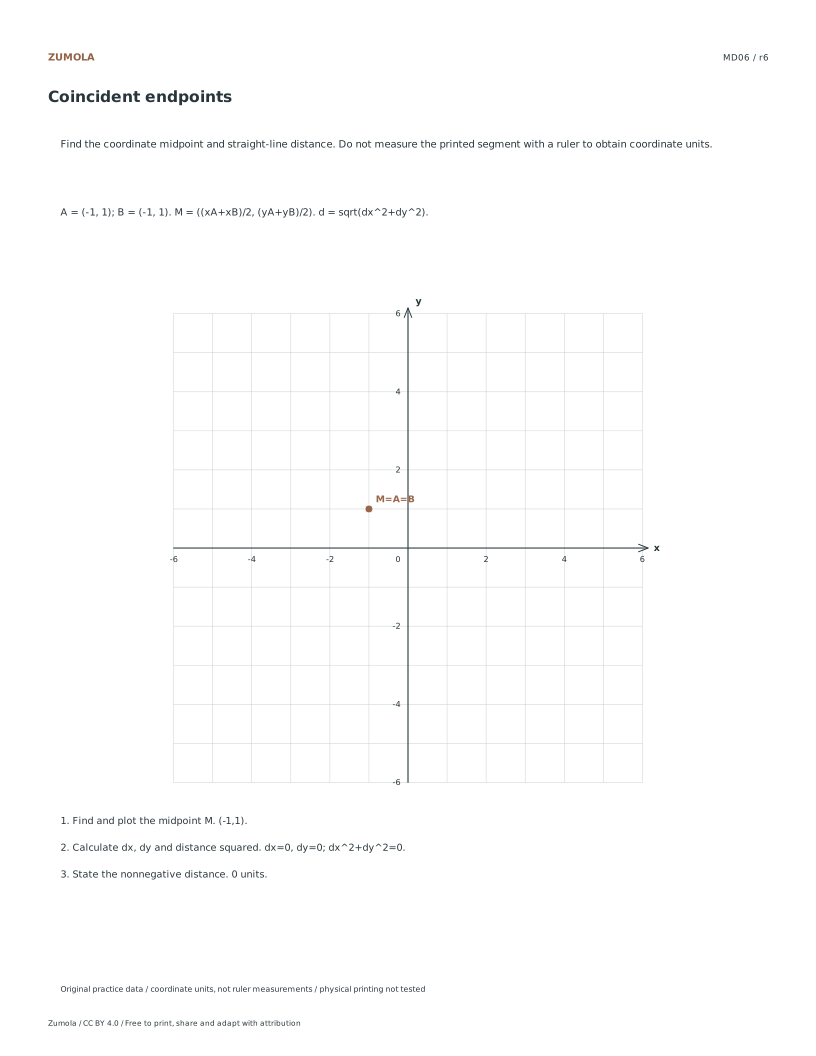
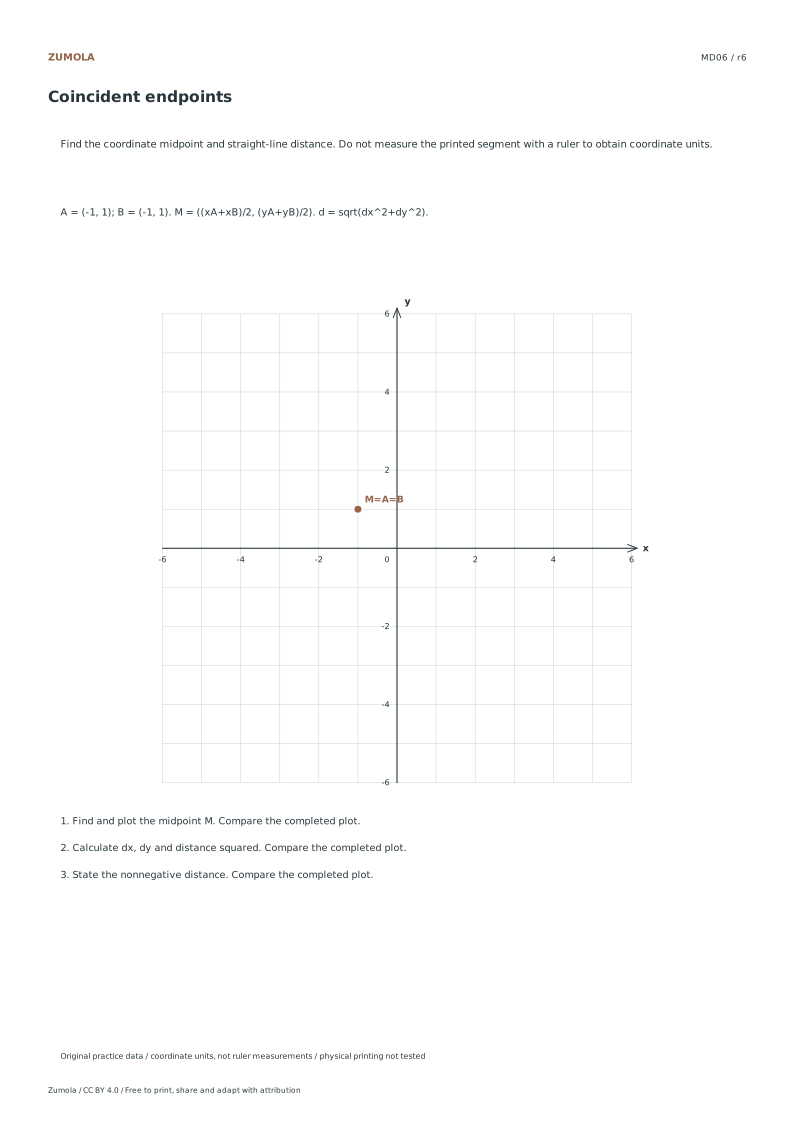
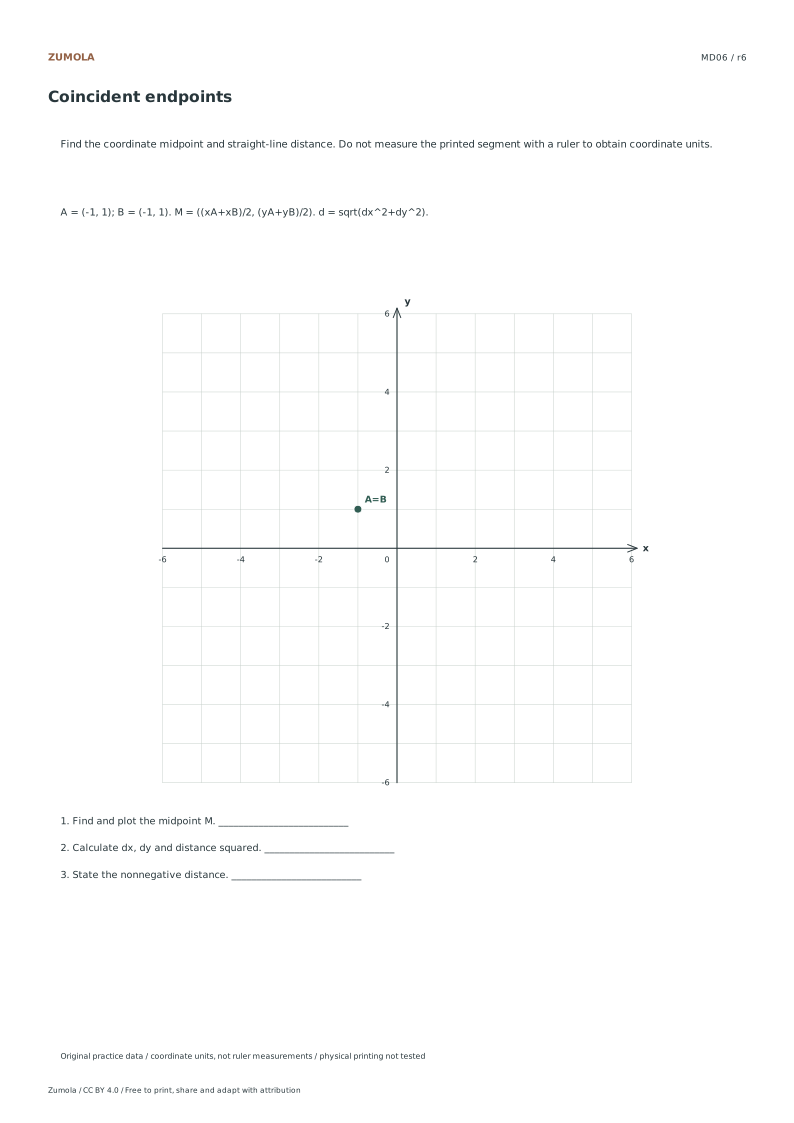
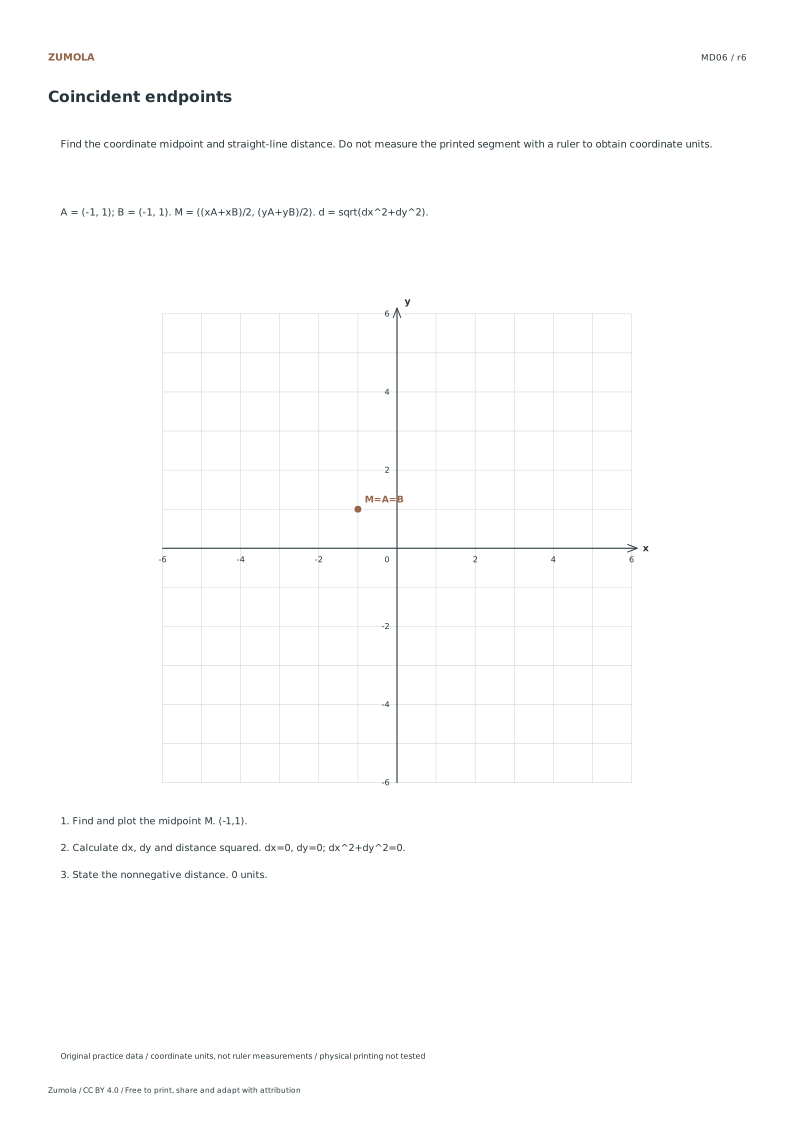
Confirm the endpoints already supplied The student sheet gives A and B as coordinates and as plotted markers joined by their segment. Confirm the numbers before finding a new point. In MD01, A=(-4,-2) and B=(2,6); the coordinate changes from A to B are 6 horizontally and 8 vertically. The reference adds the midpoint and an axis-aligned construction guide. Keep that file aside while calculating. In MD06 the endpoints coincide, so one location is marked A=B; a missing visible segment is the intended zero-length case, not an instruction to invent another endpoint.
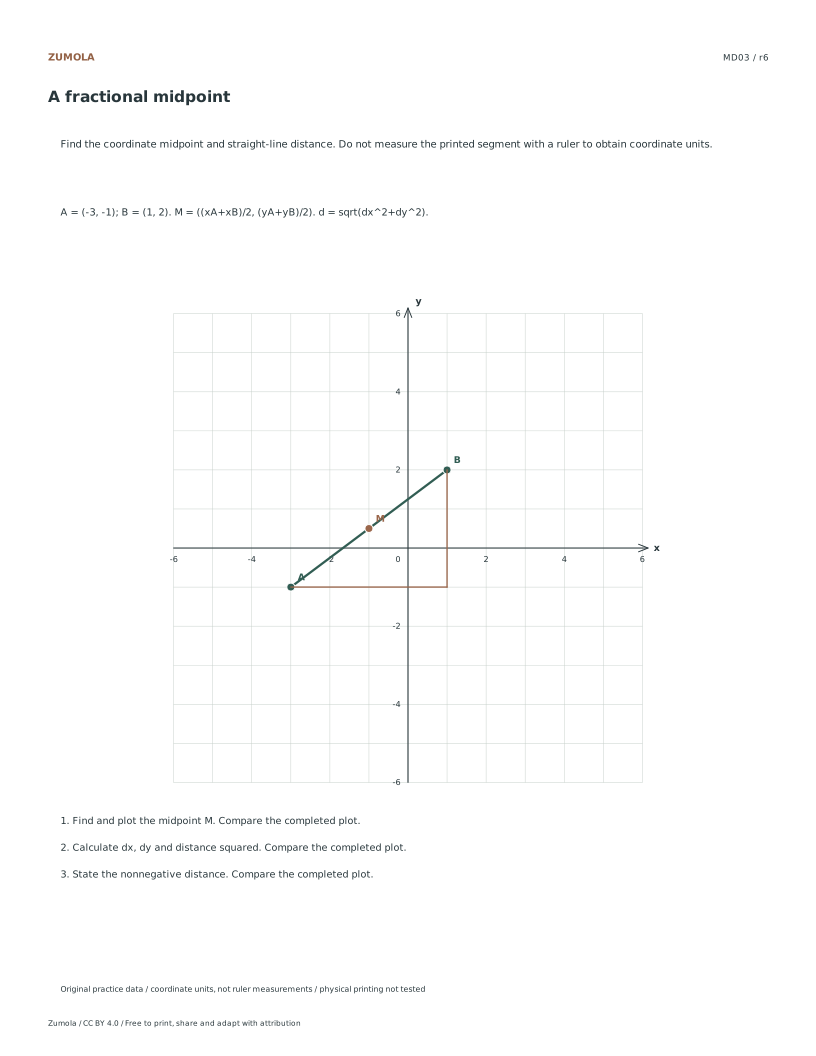
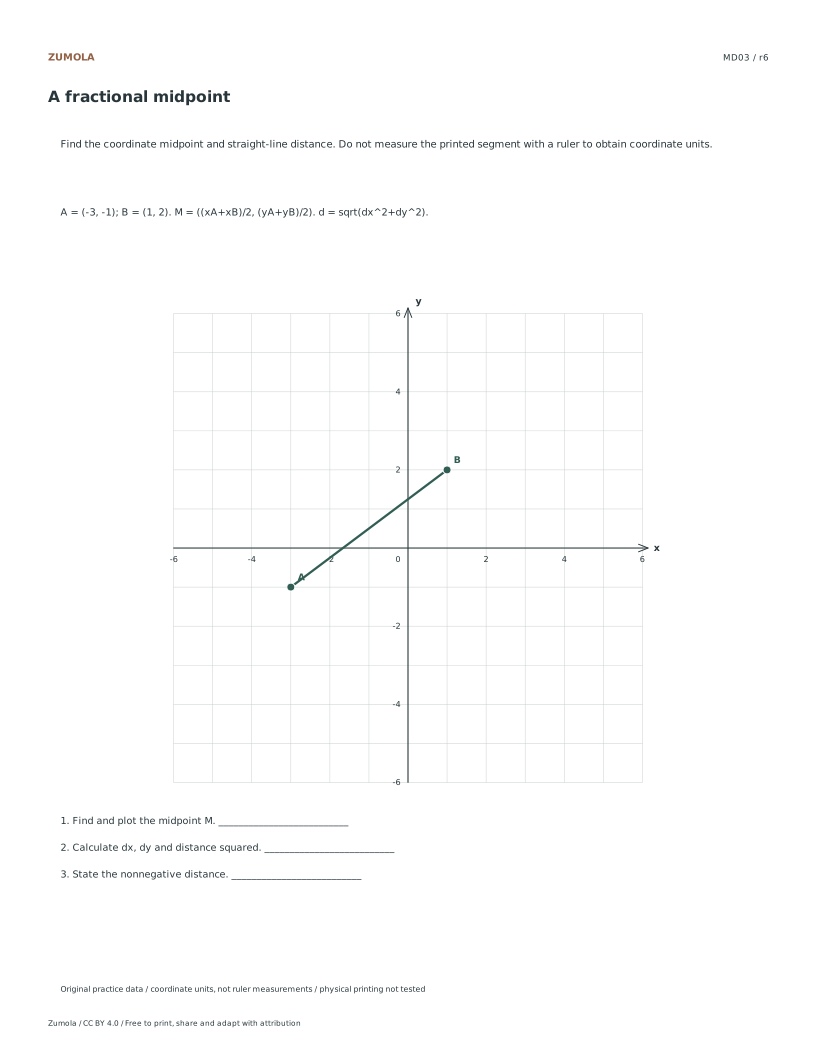
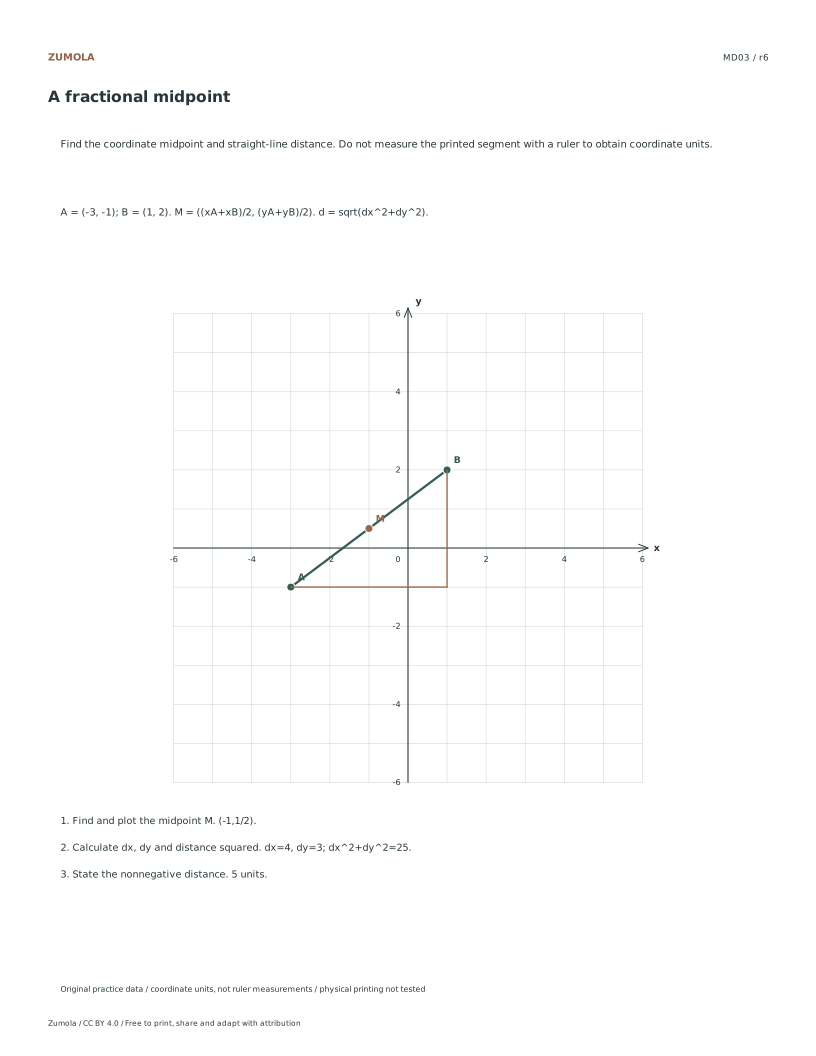
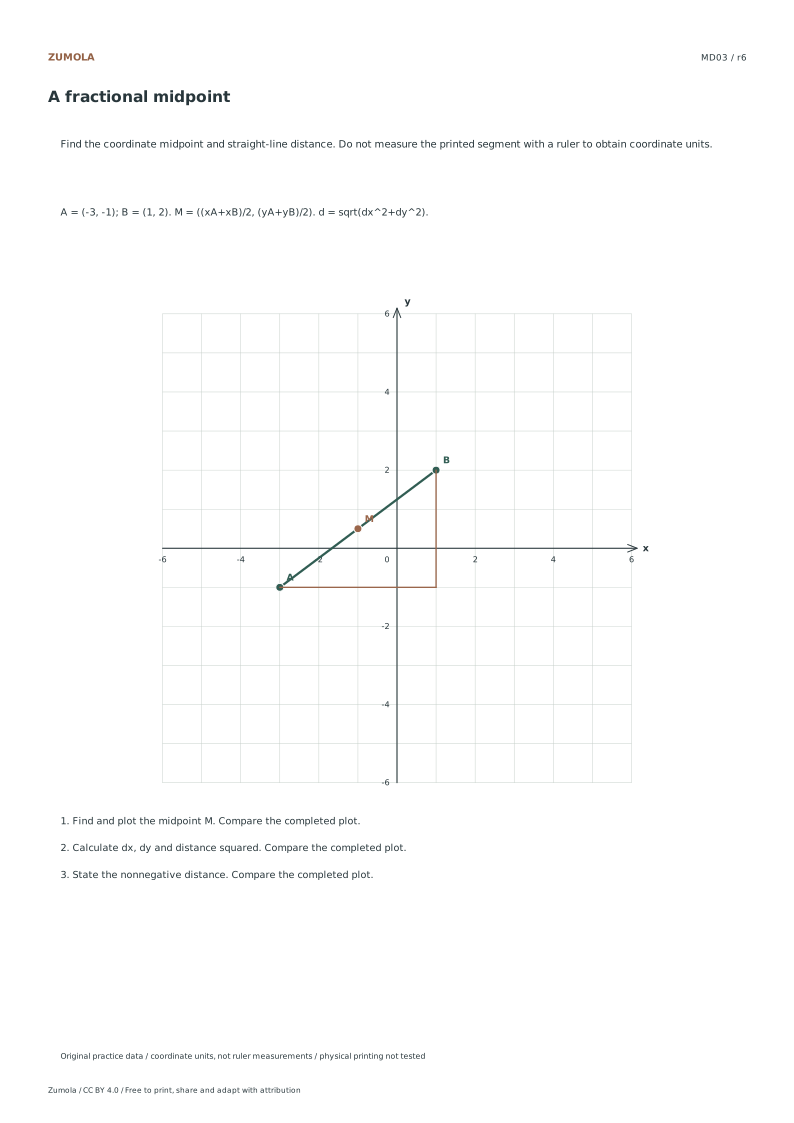
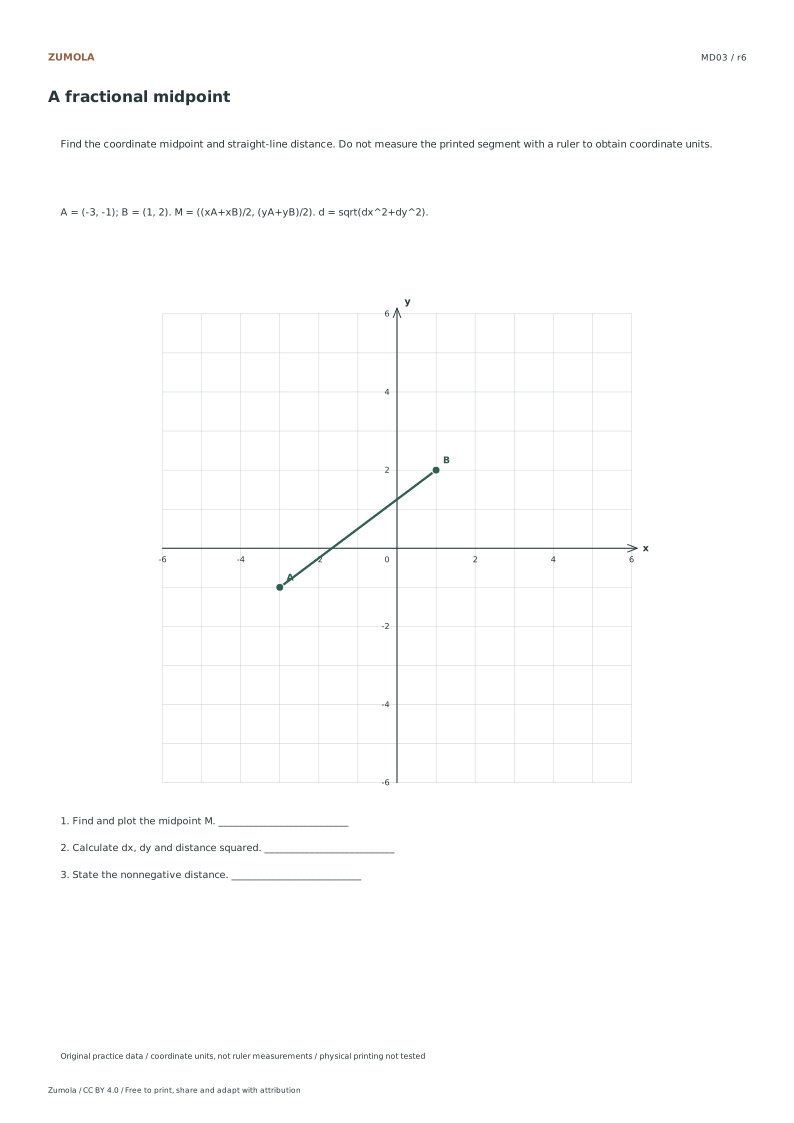
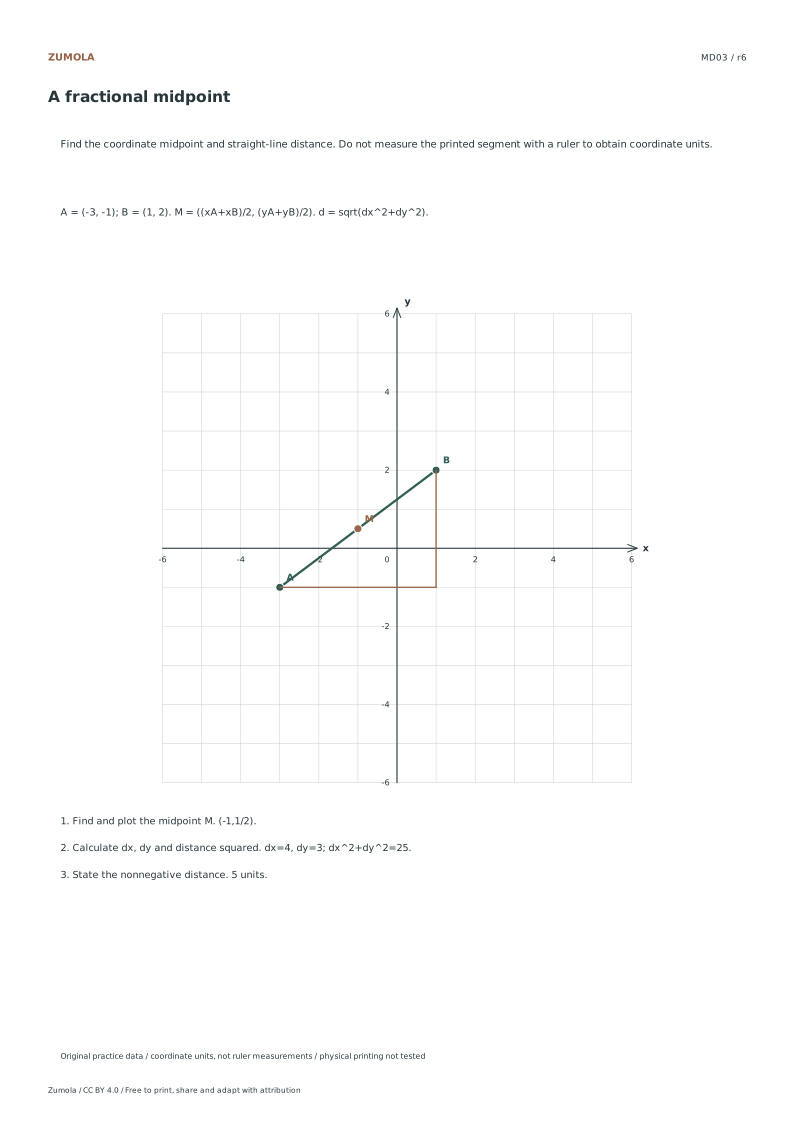
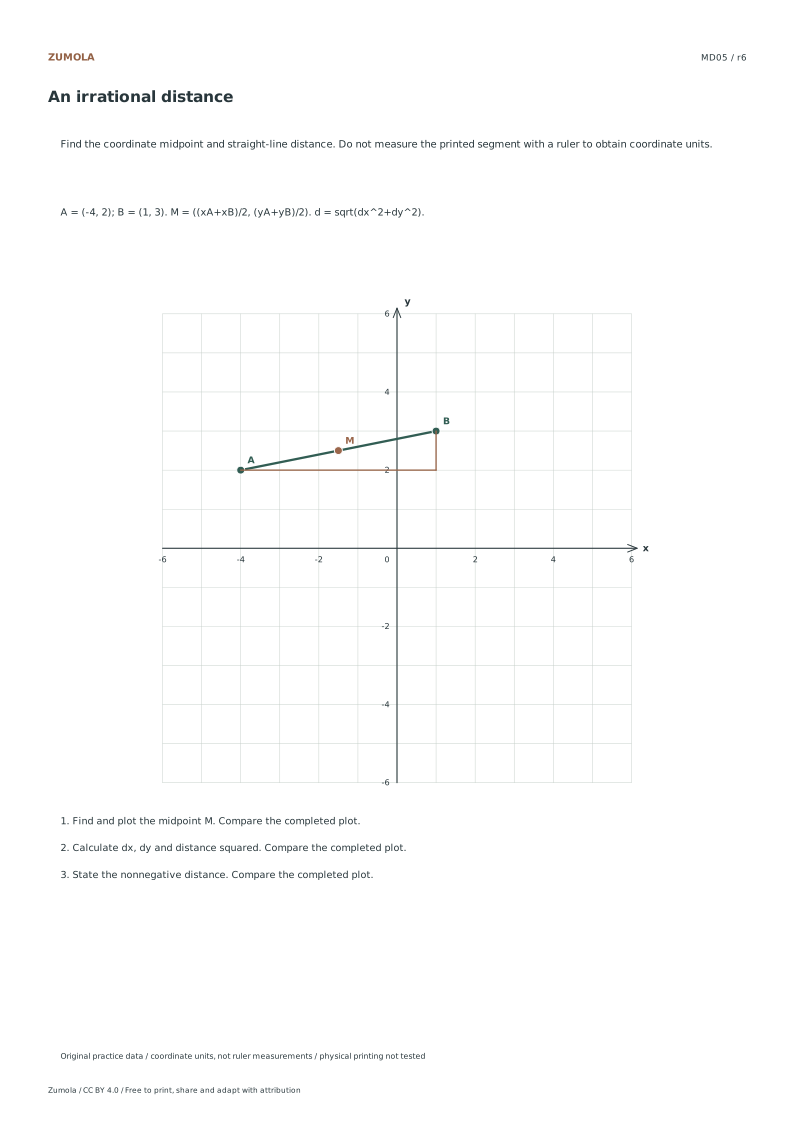
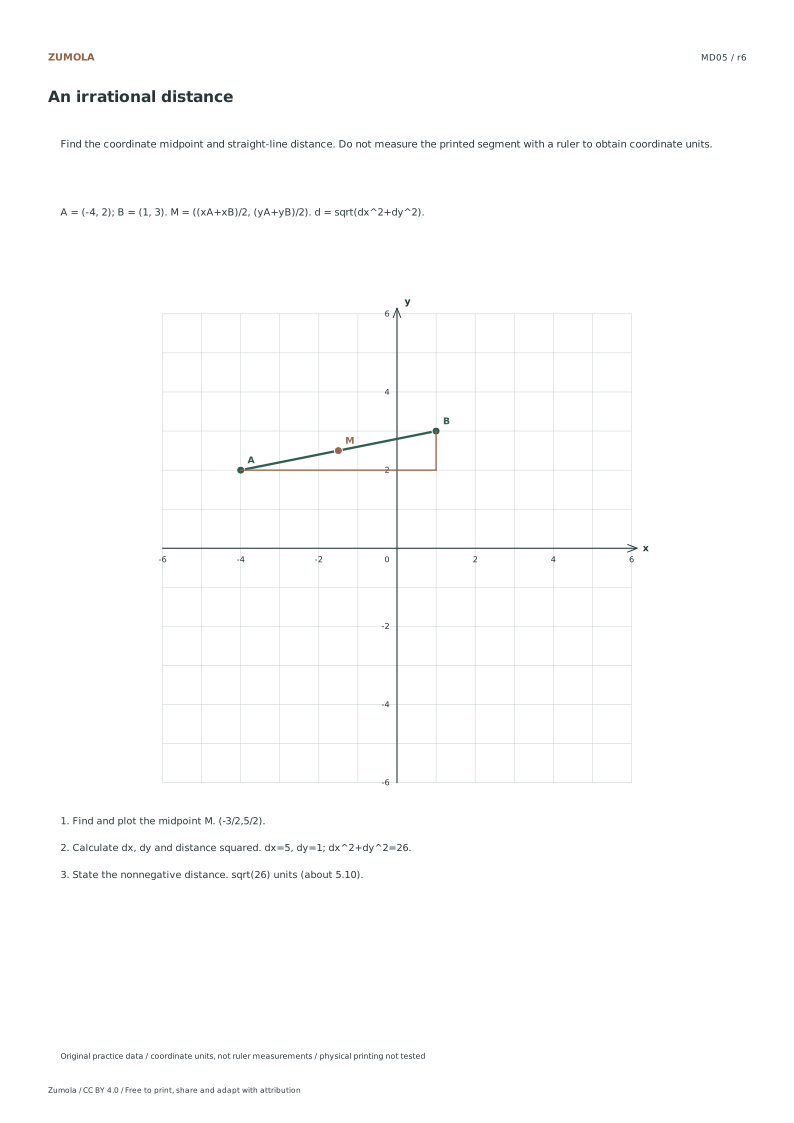
Calculate Midpoint Coordinates Determine the midpoint by averaging the corresponding x and y coordinates of the endpoints. For case MD03, average negative three and one for the x-coordinate, and negative one and two for the y-coordinate. This yields a fractional midpoint, which is a specific feature of this exercise set. Remember that the midpoint is simply the arithmetic mean of the positions. Do not measure physical distances on the paper, as the answers rely on digital unit calculations. If endpoints coincide, as in case MD06, the midpoint remains identical to the endpoints. This method ensures consistency across all fictional examples without requiring physical ruler measurement.
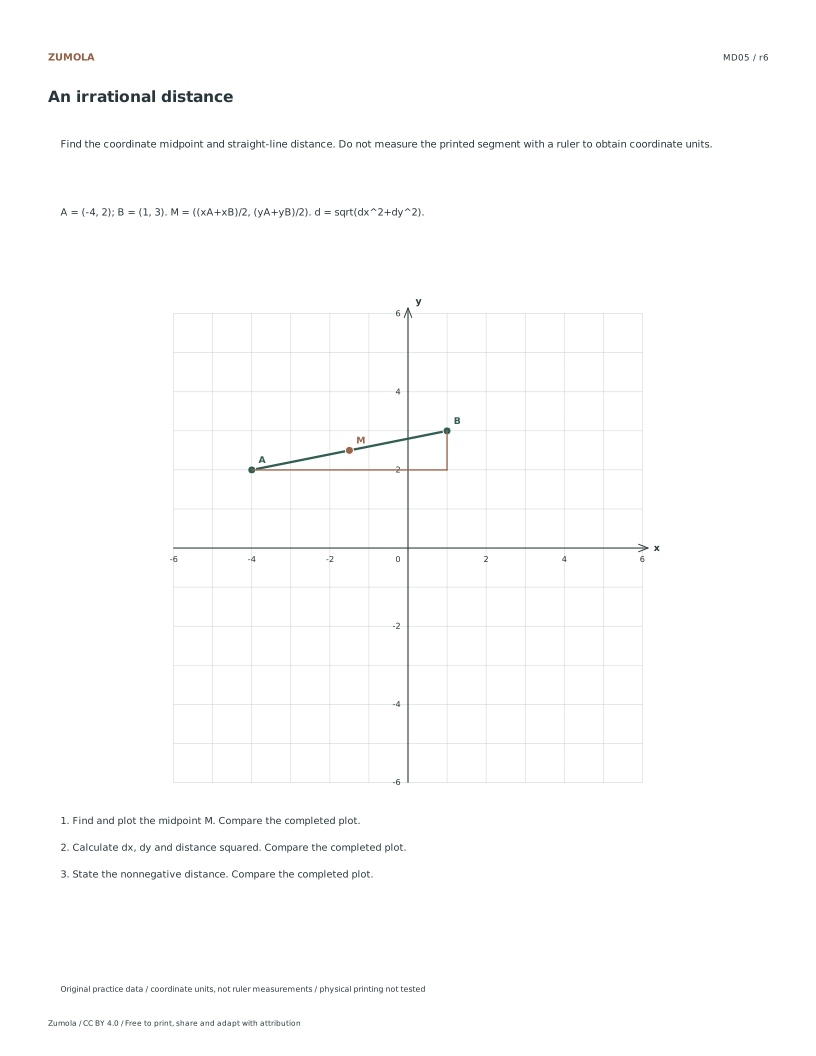
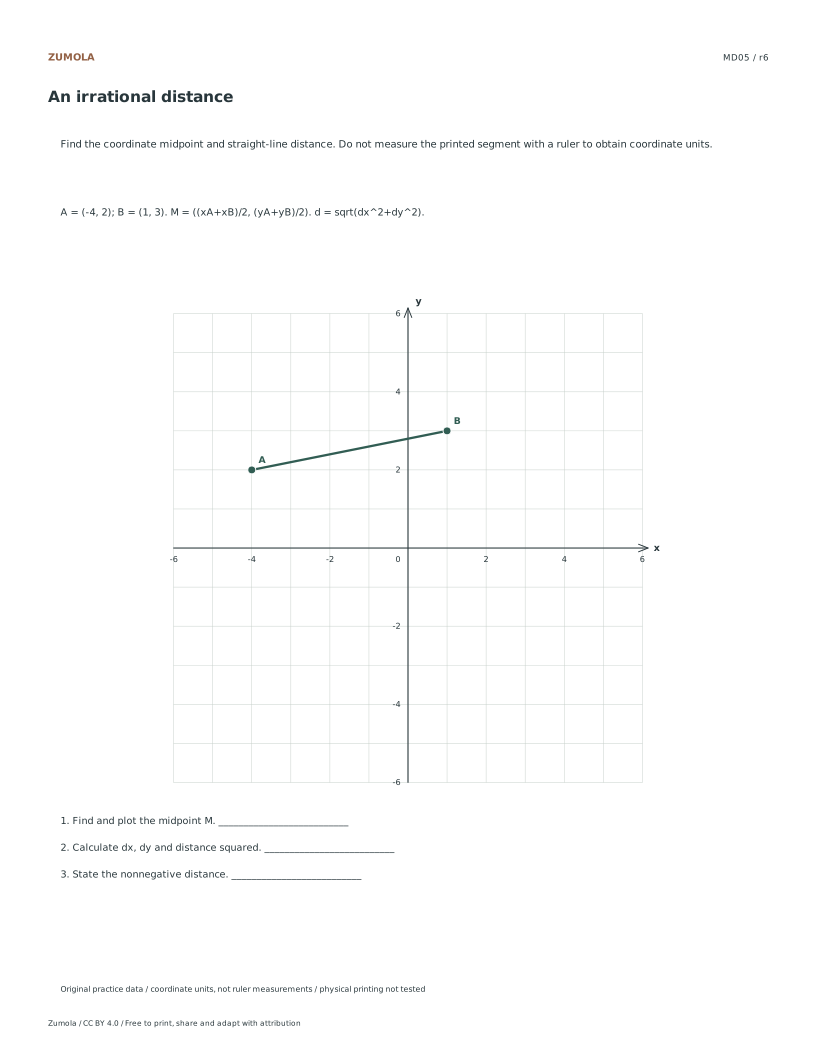
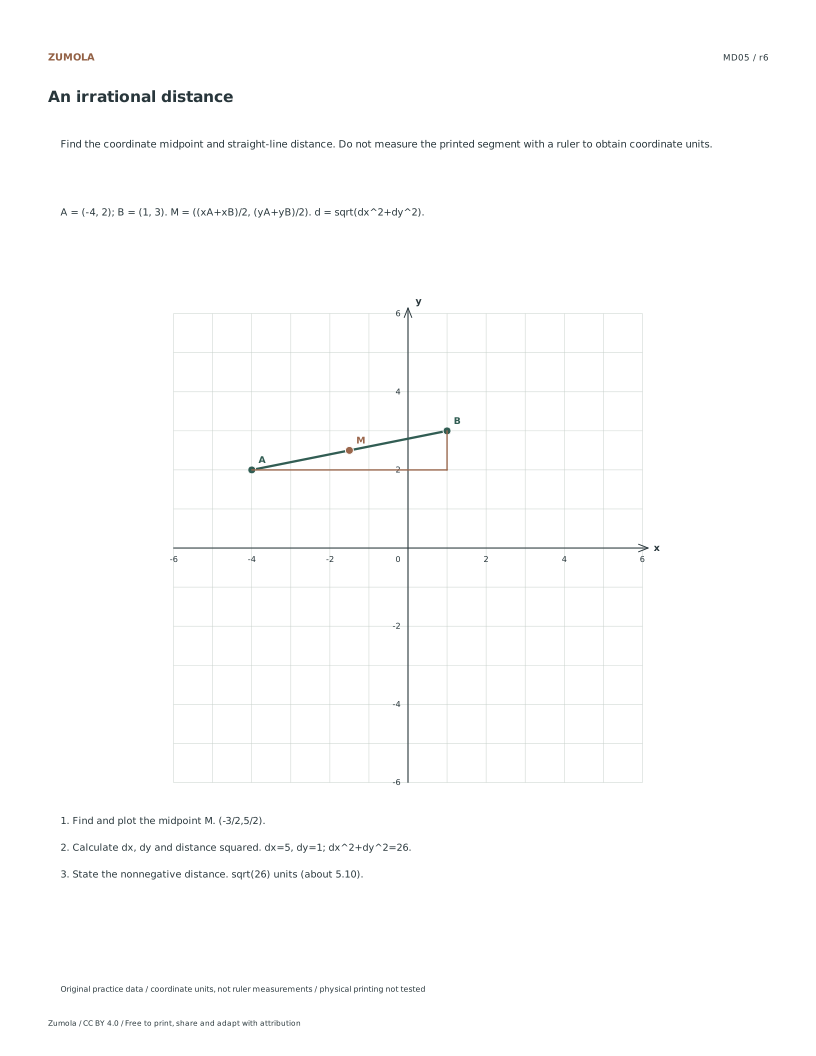
Compute Euclidean Distance Apply the distance formula using the differences in x and y coordinates. Calculate the square root of the sum of the squared differences. For case MD05, the result is an irrational number, so prefer the exact radical form over a decimal approximation. If you provide a decimal, label it as about to indicate approximation. The distance is always nonnegative. In case MD06, where endpoints coincide, the distance is zero. Note that these distances represent axis units, not millimeters on the printed page. This distinction prevents errors from physical printer scaling issues, as no physical printer checks have been performed for these digital resources.
Checks that catch common errors
Watch for
Check instead
Measuring the printed line with a physical ruler to determine distance.
Use the coordinate differences and the distance formula, as answers depend on digital units, not physical paper measurements.
Rounding an irrational distance to a decimal without labeling it as approximate.
Prefer the exact radical form, or if using a decimal, explicitly label it as about to indicate approximation.
Assuming the midpoint is always an integer coordinate.
Calculate the average of the coordinates, which may result in fractional values as seen in case MD03.
Keep the labels and margins readable
Choose the Letter or A4 file that matches your paper. Actual size / 100% preserves the designed layout; a different uniform print scale changes physical lengths but does not change the listed numbers or the arithmetic. Keep the whole chart and all labels inside the printable area. A ruler can help draw straight segments, but calculate from the stated numerical scale.
These files have digital geometry, arithmetic and page-boundary checks. Physical printer and classroom trials have not been completed. The resources are practice material, with no claim of curriculum certification or precision-instrument accuracy. The original files use CC BY 4.0: credit Zumola, link the license and indicate changes.
Useful answers
Can a midpoint have fractional coordinates?
Yes. Average each coordinate pair separately. MD03 has midpoint (-1,1/2), even though both endpoints use integer coordinates.
Is the distance the same as adding horizontal and vertical changes?
No. The straight-line distance is the square root of dx squared plus dy squared. Adding absolute changes instead measures an axis-aligned route, generally a longer path.
What if the endpoints coincide?
The midpoint is that same point and the distance is zero. MD06 deliberately includes this case; it is not a missing segment.
Are the answer files and editable graphs free?
Yes. Reference, student and worked-answer files are all free without an account. Single sheets include PDF and SVG; collection packs are PDF files. Analytics consent is not required to download.
When a segment crosses both axes, the graph gives you two extra reference points that do not depend on the midpoint formula. If your plotted segment misses an axis crossing that the coordinates require, either the plotting or the arithmetic is wrong. This check is stronger than eyeballing whether the midpoint looks central, because a midpoint can look plausible while the segment length is wrong.
The method stays the same: midpoint coordinates are the averages of the endpoint coordinates, and distance is the square root of the sum of squared coordinate differences. Intercepts are only a verification layer, not a replacement for the formula. Keep the segment straight and the axes labeled so the crossing points can be read.
Plot both endpoints accurately against labeled axes.
Draw the straight segment between them.
Mark where the segment crosses each axis.
Compute the midpoint by averaging x-coordinates and y-coordinates separately.
Compute the distance from the squared coordinate differences.
Compare the plotted crossings and midpoint with your computed values.
A new worked case with both axes crossed
Take endpoints A(-3, -2) and B(5, 4). The x-difference is 5 - (-3) = 8 and the y-difference is 4 - (-2) = 6. The midpoint is ((-3 + 5)/2, (-2 + 4)/2) = (1, 1). The distance is the square root of 8 squared plus 6 squared, which is the square root of 64 + 36 = 100, so the distance is 10 units.
The segment crosses the y-axis where x = 0 and the x-axis where y = 0. Using the slope 6/8 = 3/4, from A the y-axis crossing is at y = -2 + (3/4)(3) = 0.25, and the x-axis crossing is at x = -3 + (4/3)(2) = -1/3. These are check values, not required answers, but a graph that misses them by a visible margin signals a plotting error.
Subtract coordinates in a consistent order before squaring.
Square each difference before adding; never add first.
Take the square root only after the sum is complete.
Use the slope to predict axis crossings, then compare with the drawing.
Separating the algebra answer from the drawing answer
The midpoint and distance are exact values. The drawing is an approximation limited by the grid and by pencil width, so a plotted midpoint that sits slightly off the computed point is not automatically wrong. Judge the drawing against a tolerance you state in advance, such as within half a grid square, and judge the algebra against exact arithmetic.
Do not treat a blank coordinate grid as an answer to a function question. This page concerns segments defined by two points; function behavior such as domain, intercepts, and asymptotes belongs to separate tasks with their own goals.
State the drawing tolerance before judging the plot.
Check the algebra independently of the graph.
Record the exact midpoint and distance alongside the sketch.
Try this example
Find the midpoint and distance for endpoints (-3, -2) and (5, 4), then state one graph check.
Show the worked explanation
x-difference is 8 and y-difference is 6. Midpoint is (1, 1). Distance is the square root of 64 + 36 = 100, which is 10 units. Graph check: the segment should cross the y-axis near y = 0.25 and the x-axis near x = -1/3.
Common mistakes
Adding coordinate differences before squaring them. Square each difference separately, then add the two squares, then take the square root.
Averaging only one coordinate and copying the other endpoint value. Average x-coordinates and y-coordinates in separate calculations, then pair the results.
Judging a plotted midpoint as wrong because it is not exactly on a grid intersection. Compare against a stated tolerance such as half a grid square, and keep the exact value as the answer.
Check your work
Midpoint coordinates are computed by averaging each coordinate separately.
Distance uses squared differences added before the square root.
The plotted segment is straight and endpoints sit on labeled axes.
Axis crossings on the graph are compared with slope-based predictions.
Drawing tolerance is stated and applied consistently.
Exact values are recorded separately from the sketch.
Questions before you start
Does the order of the endpoints change the midpoint or distance?
No. Averages and squared differences are unchanged when the two points are swapped, so both results stay the same.
What if the two endpoints are identical?
The midpoint equals that point and the distance is zero, since both coordinate differences are zero.
Can a graph alone prove the distance is correct?
No. A graph supports a check within a stated tolerance, but the exact distance comes from the formula.
Optional Google Analytics helps us understand which free resources are useful. It is off until you allow it. Drawing tools and downloads work with either choice. Privacy details