Free graphing resources · Original practice
Graphing quadratics.
Find the turn, then the curve.
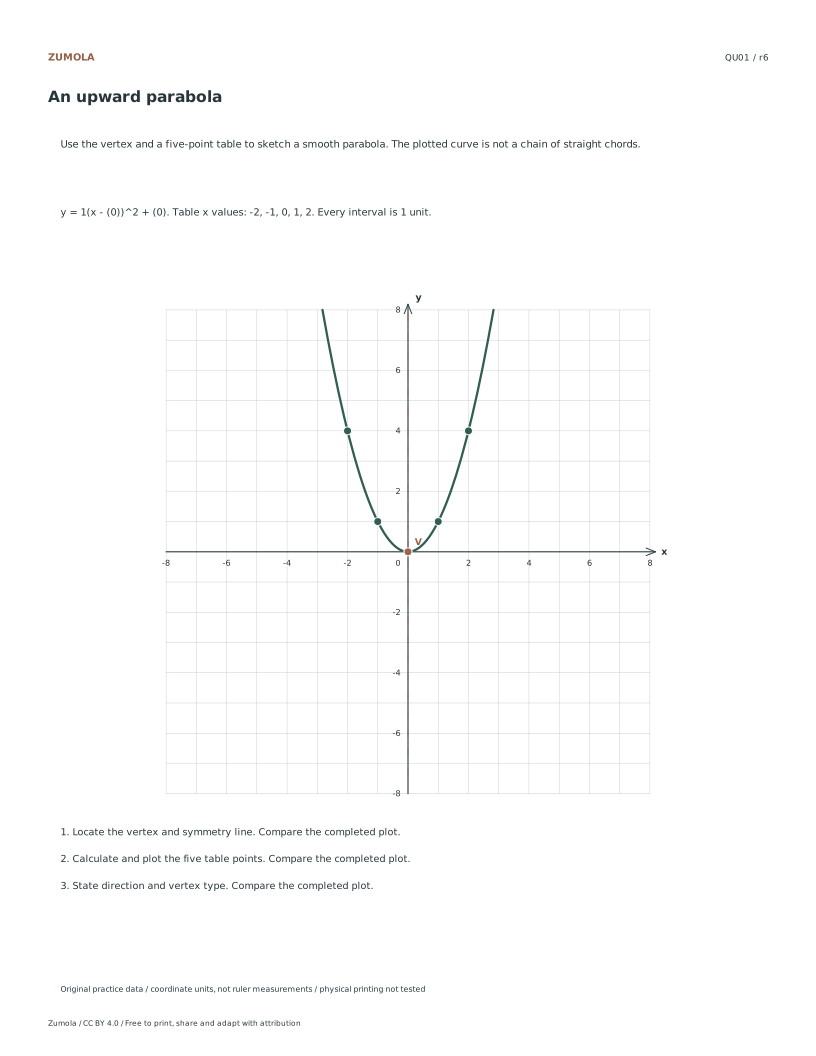
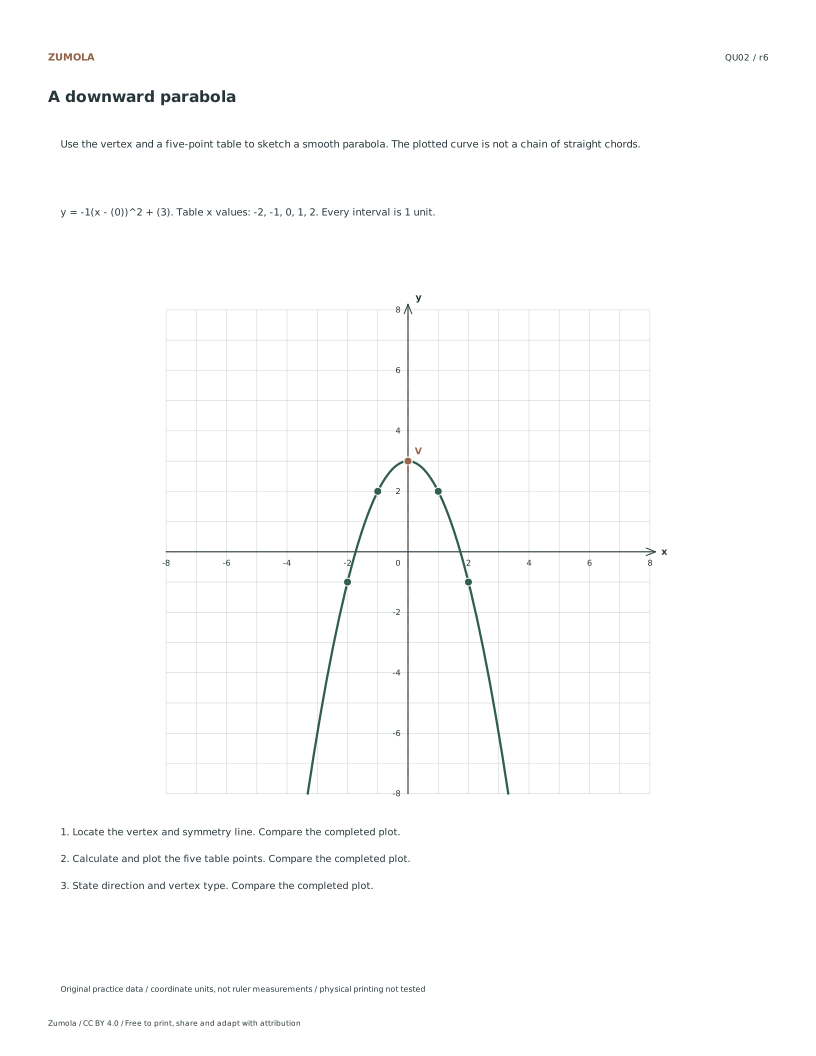
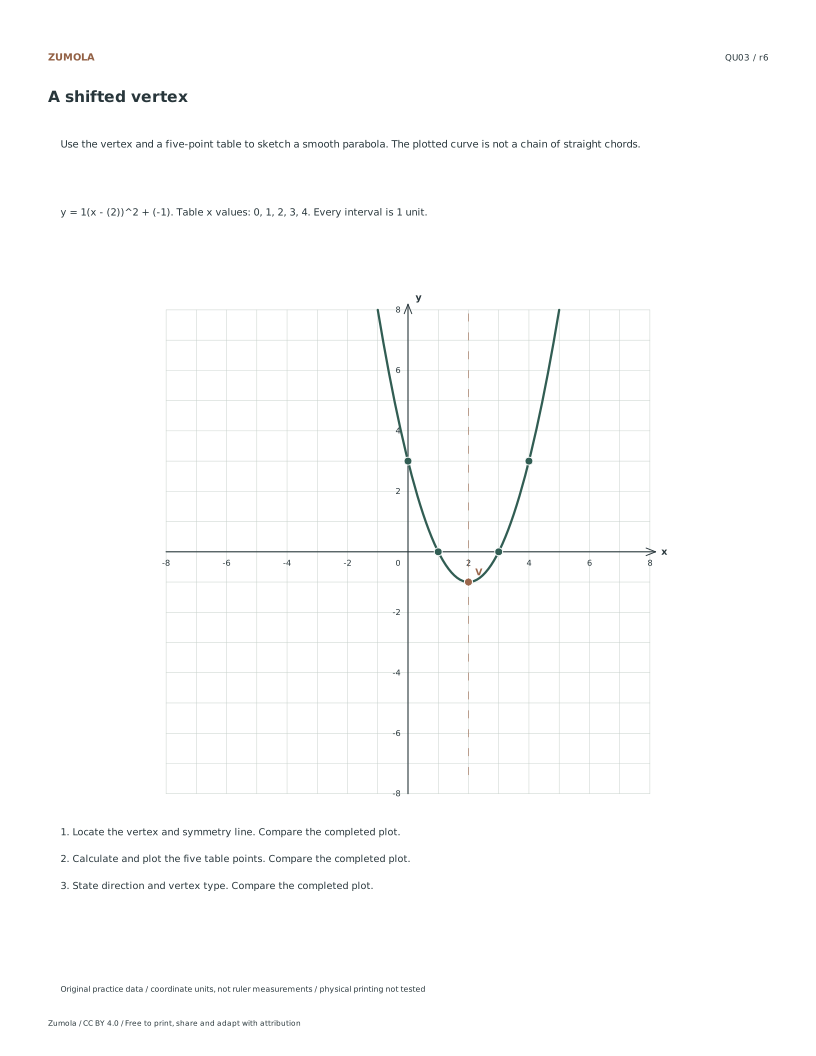
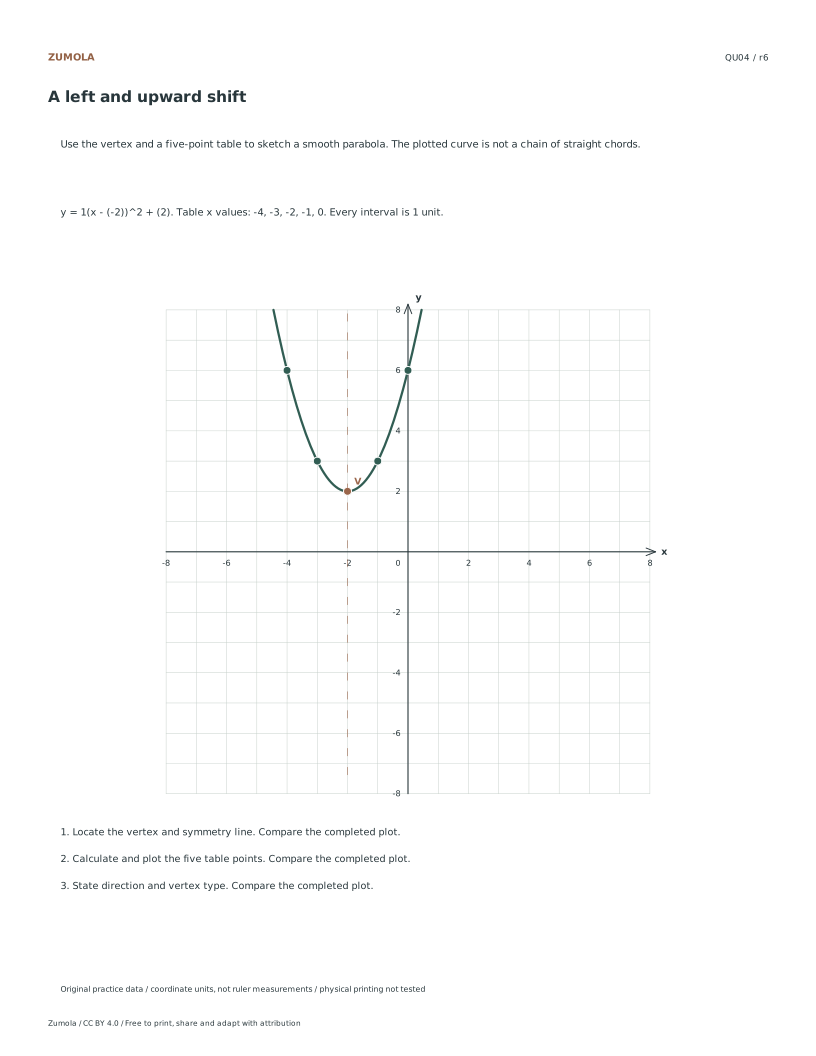
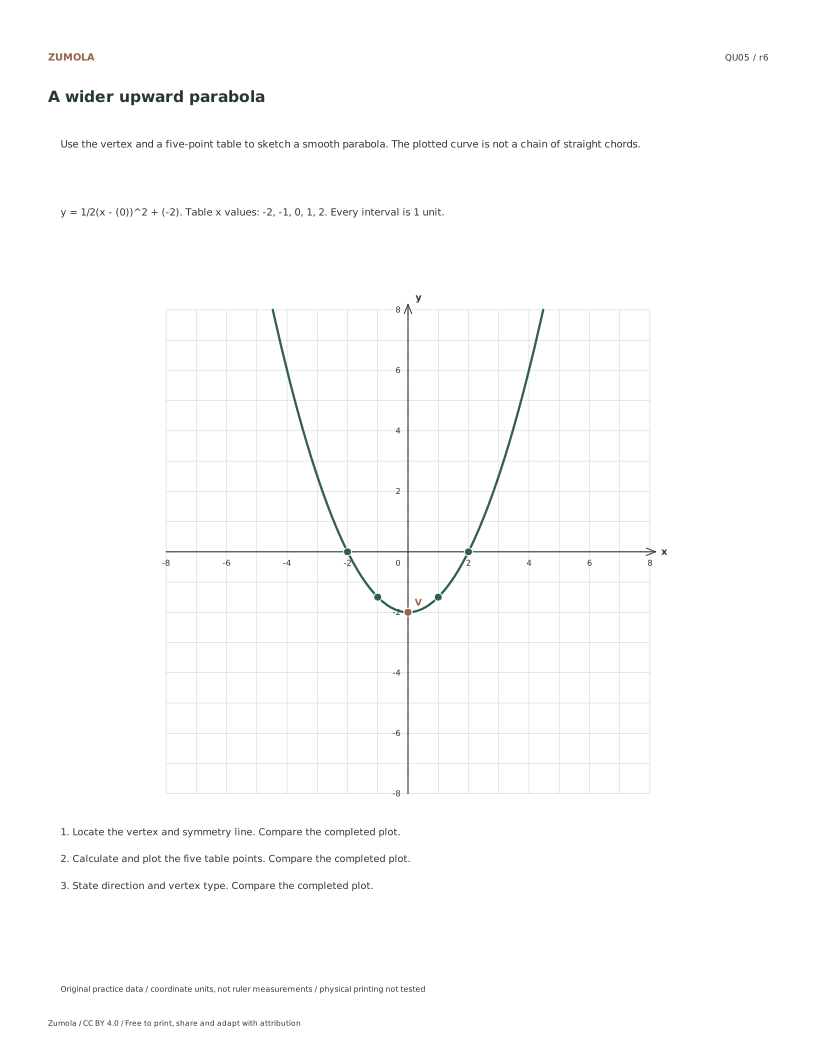
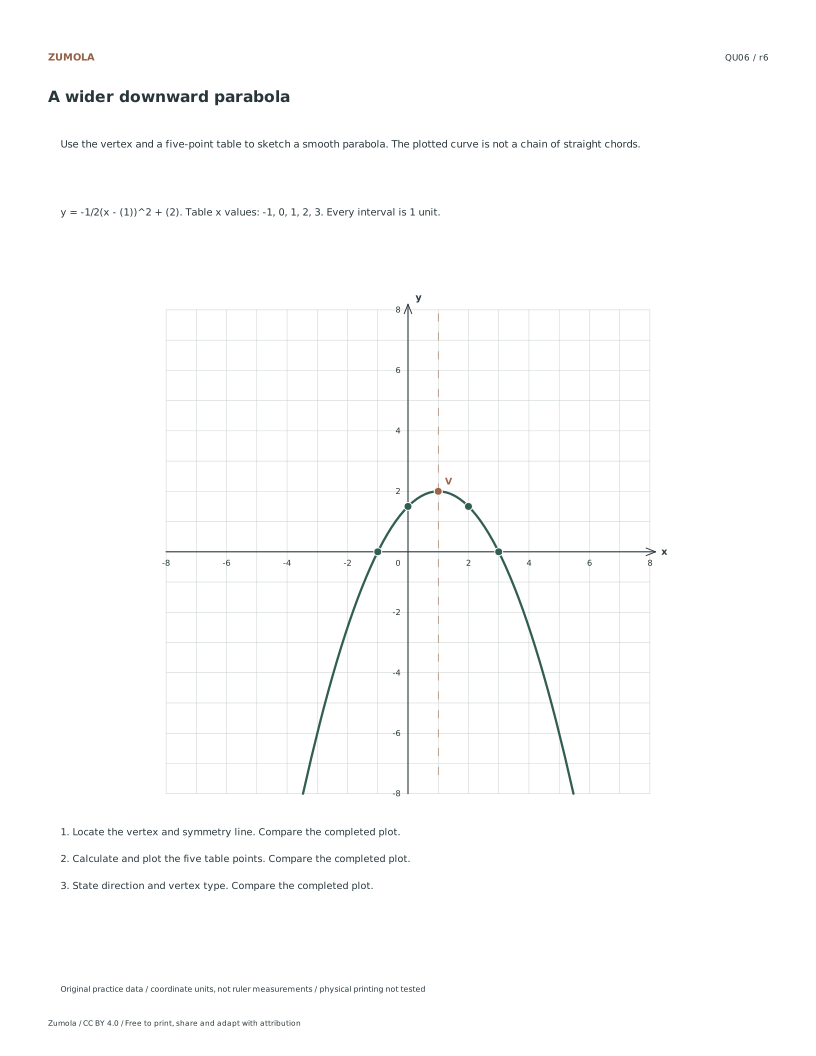
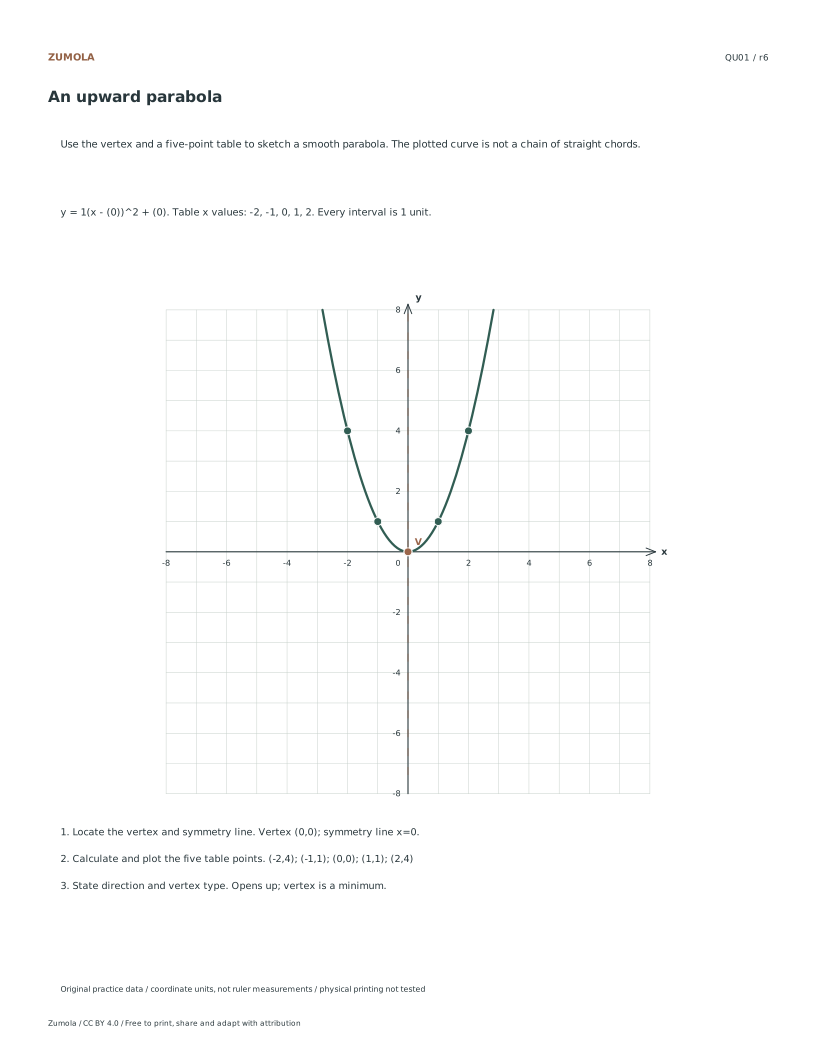
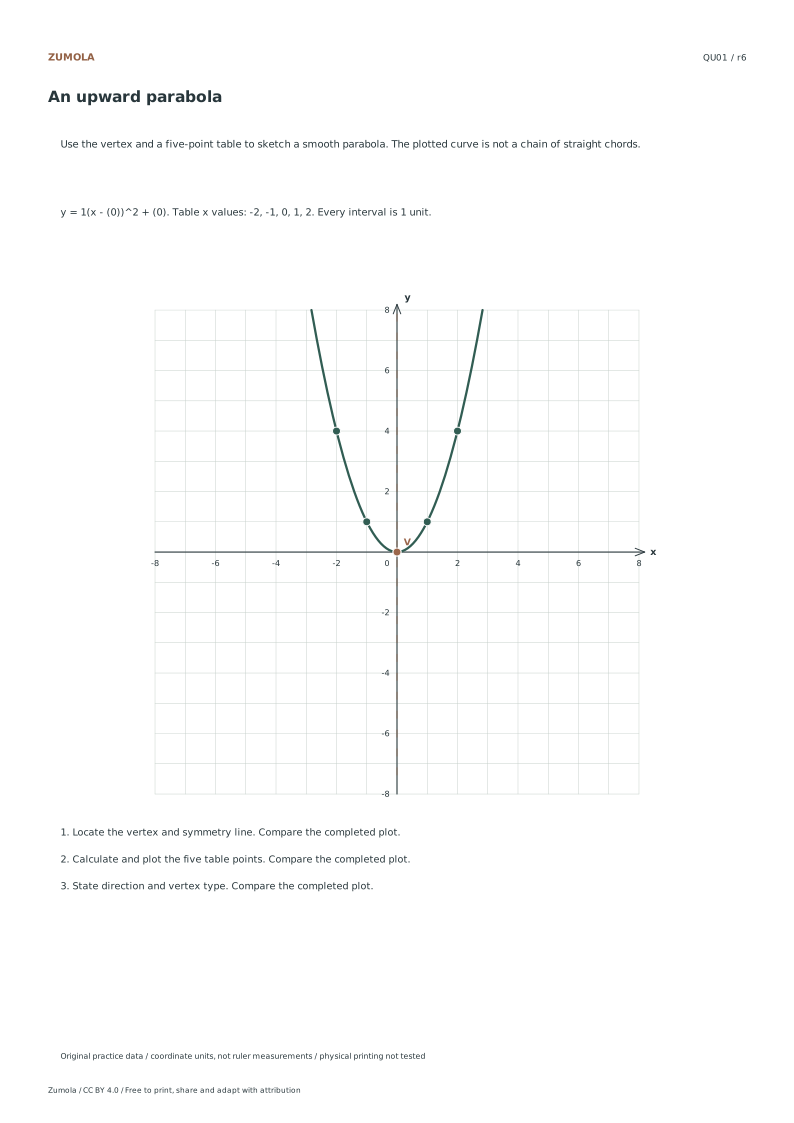
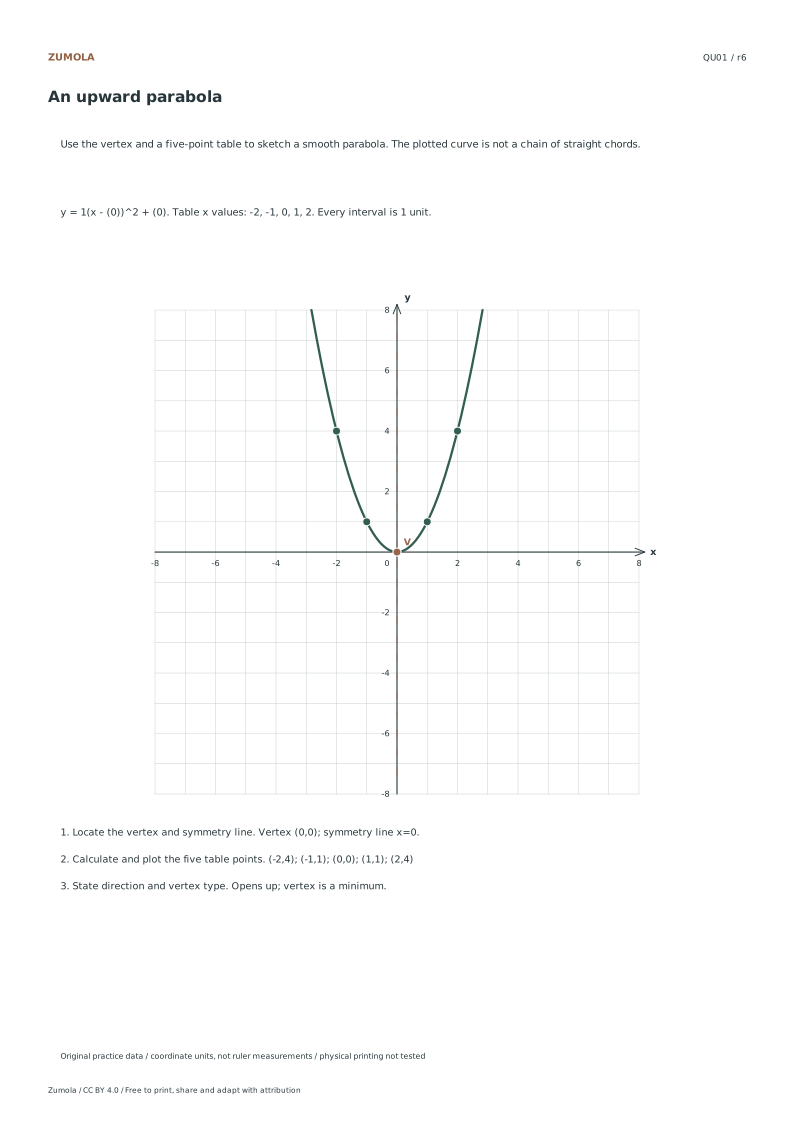
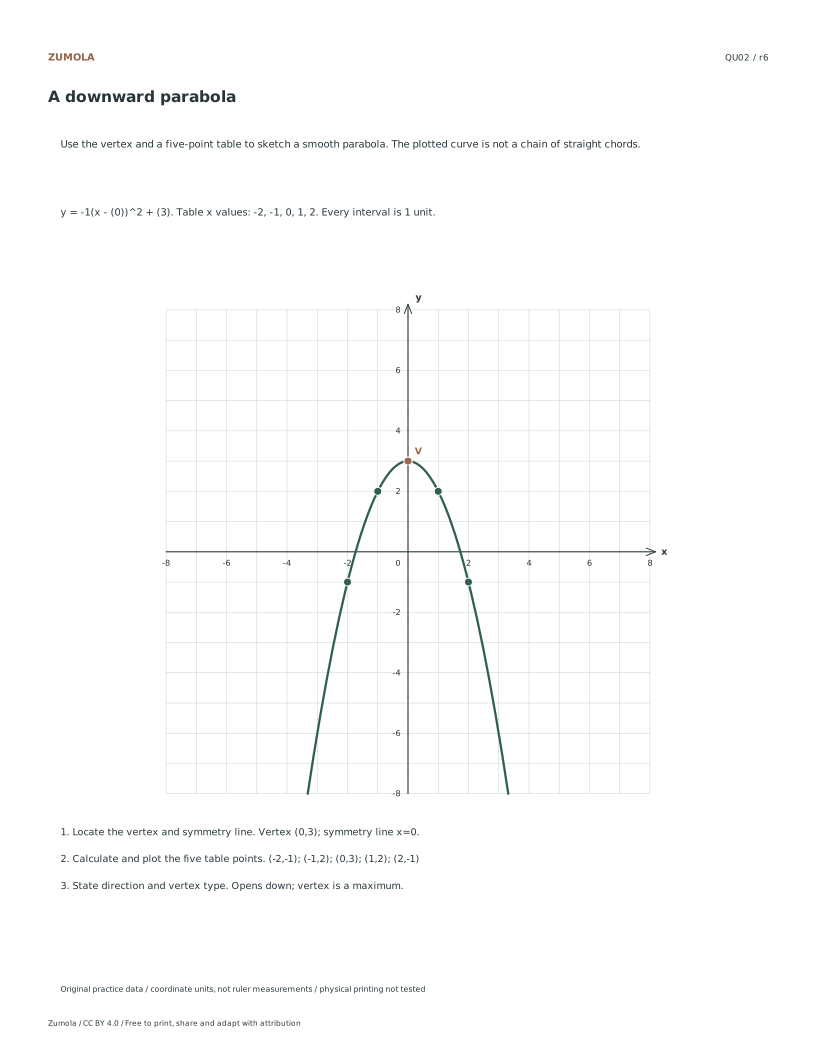
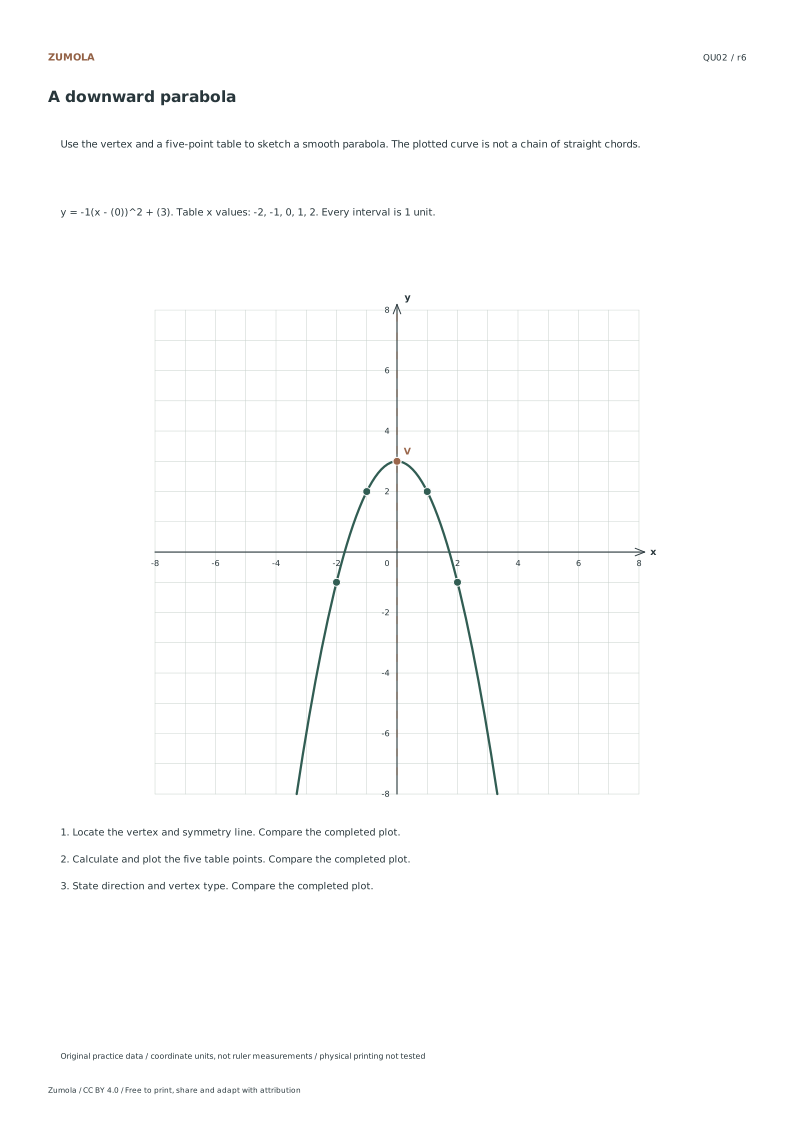
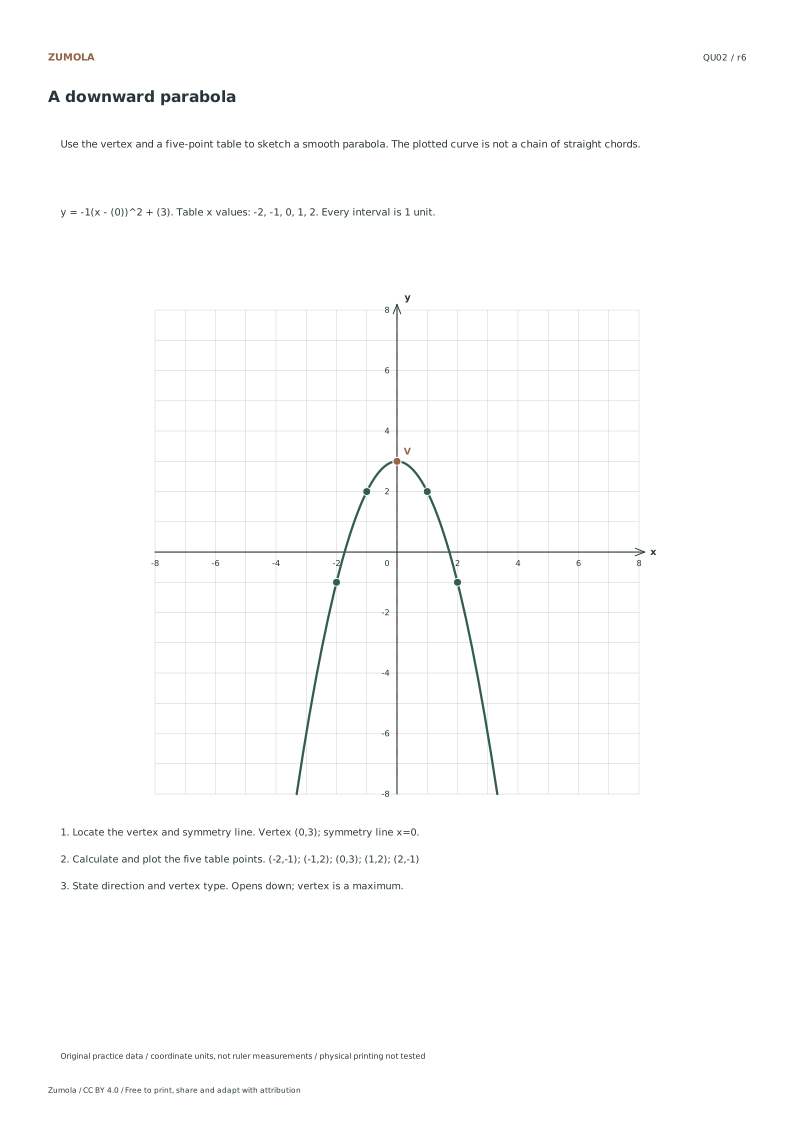
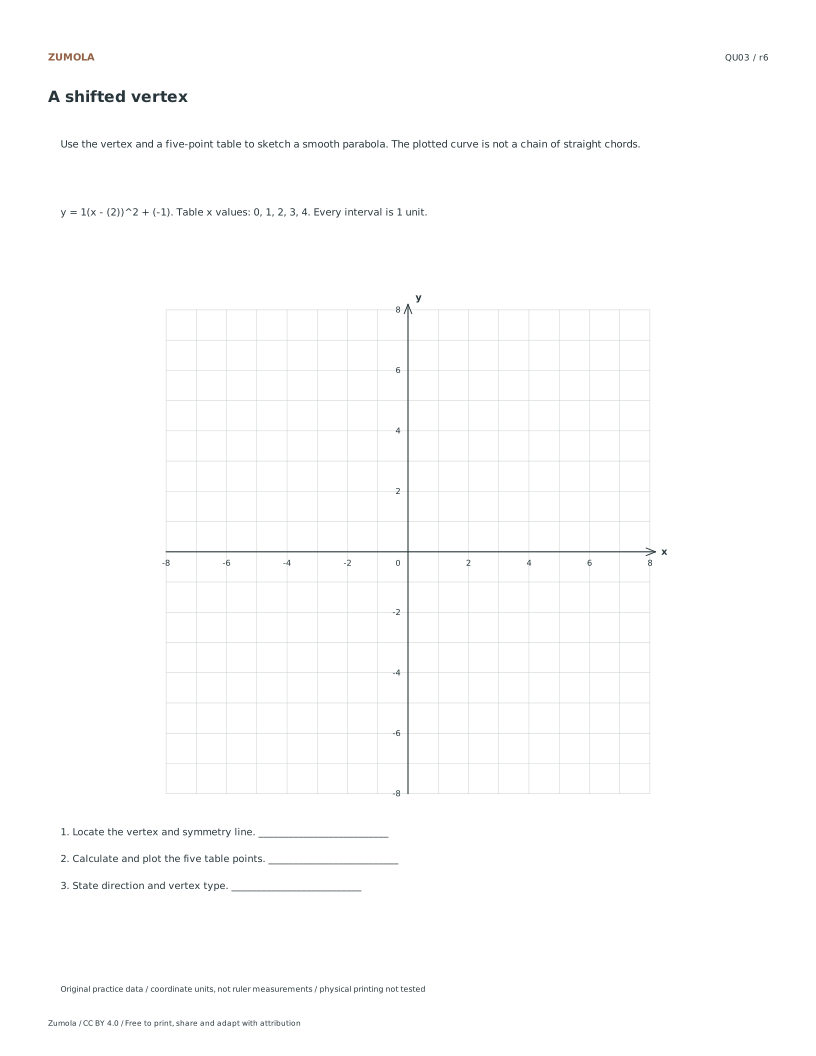
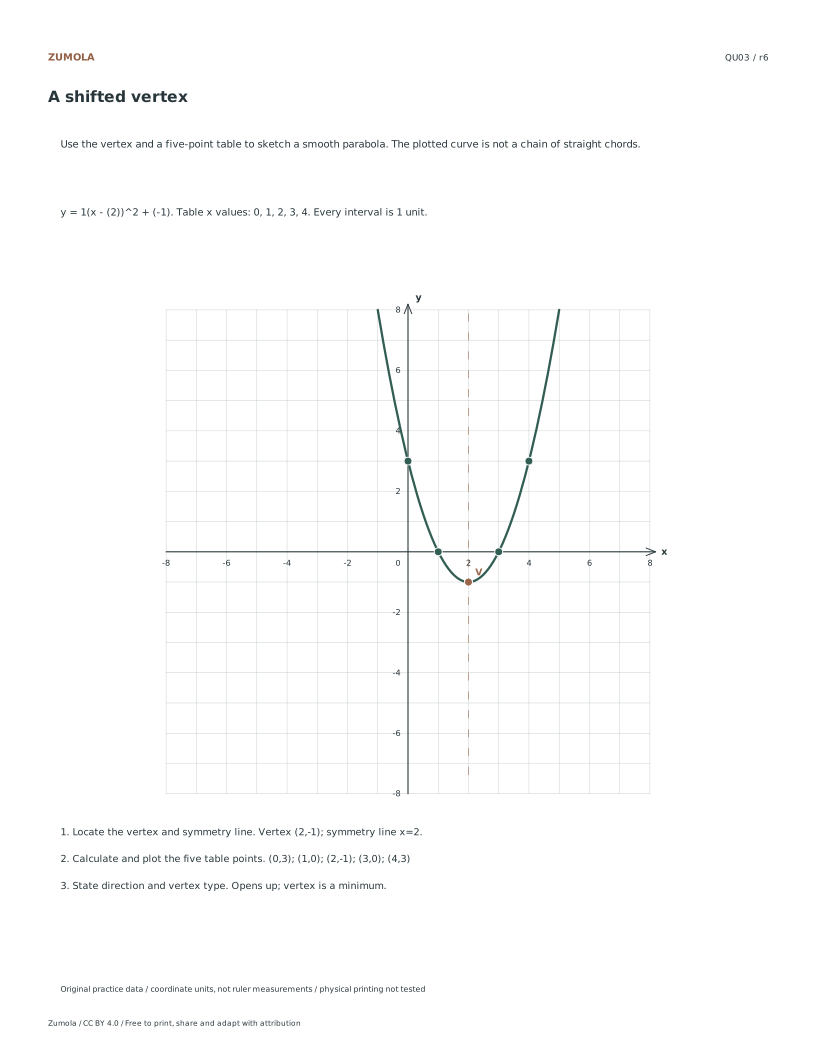
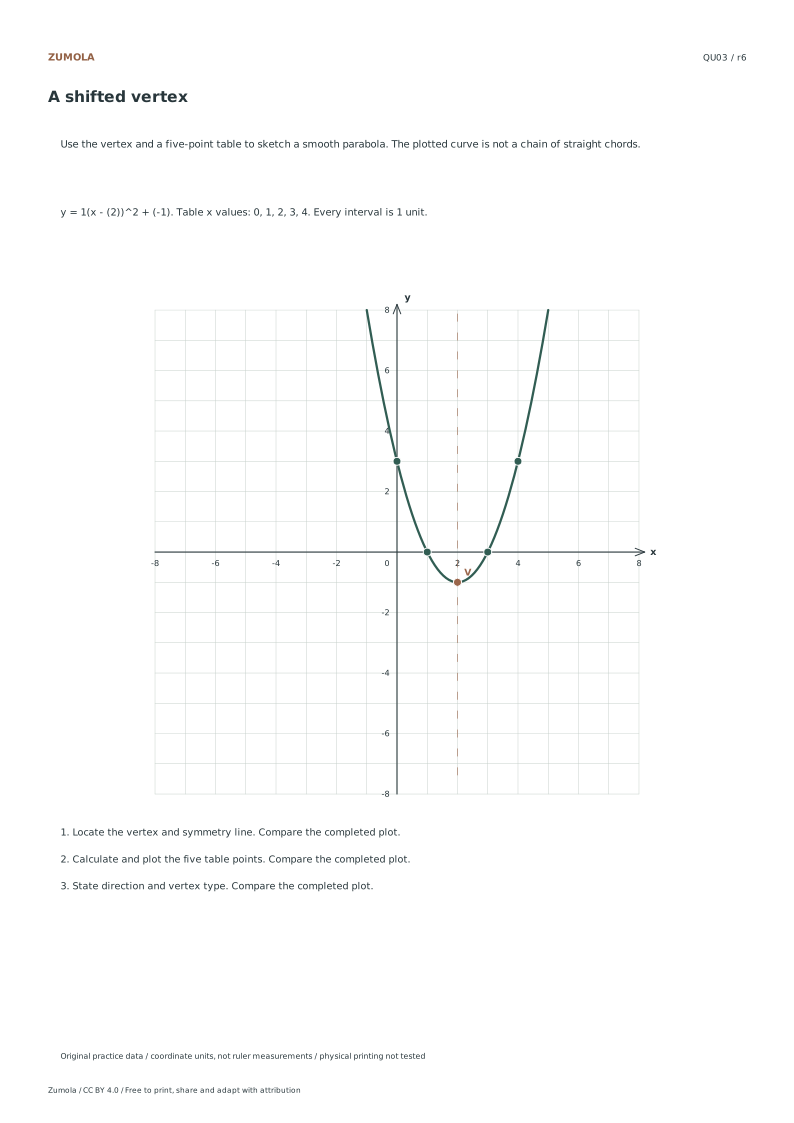
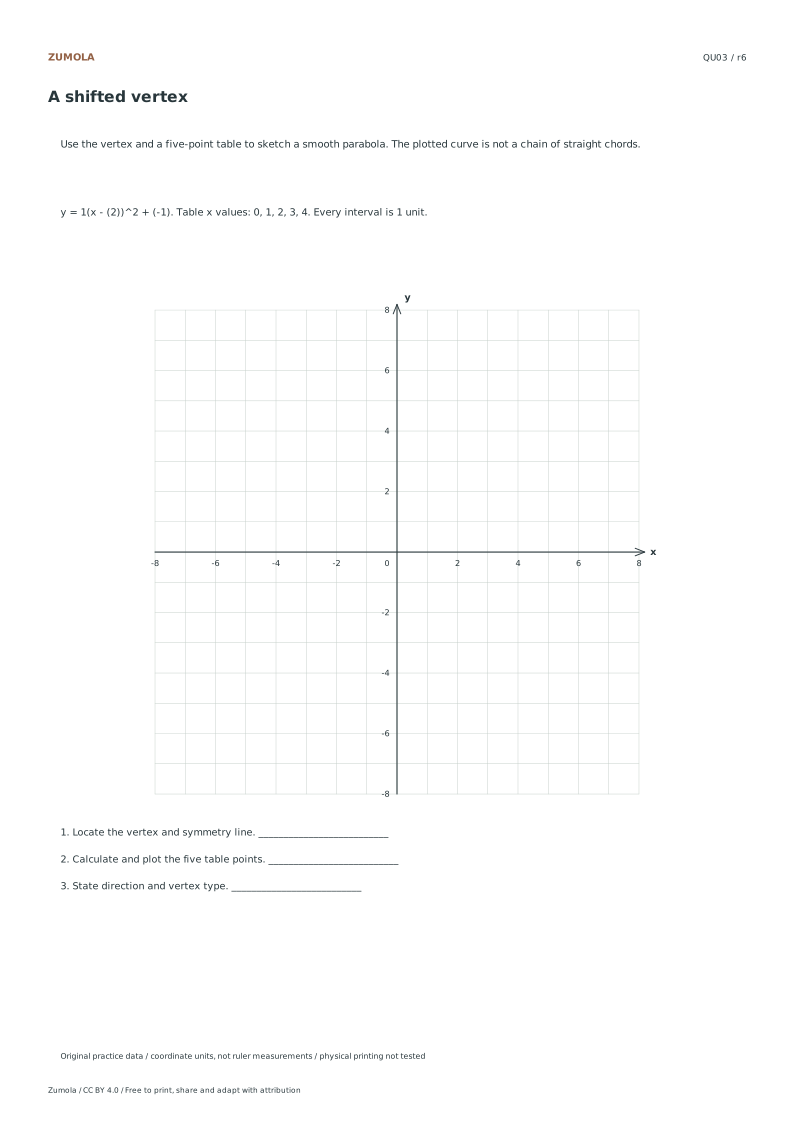
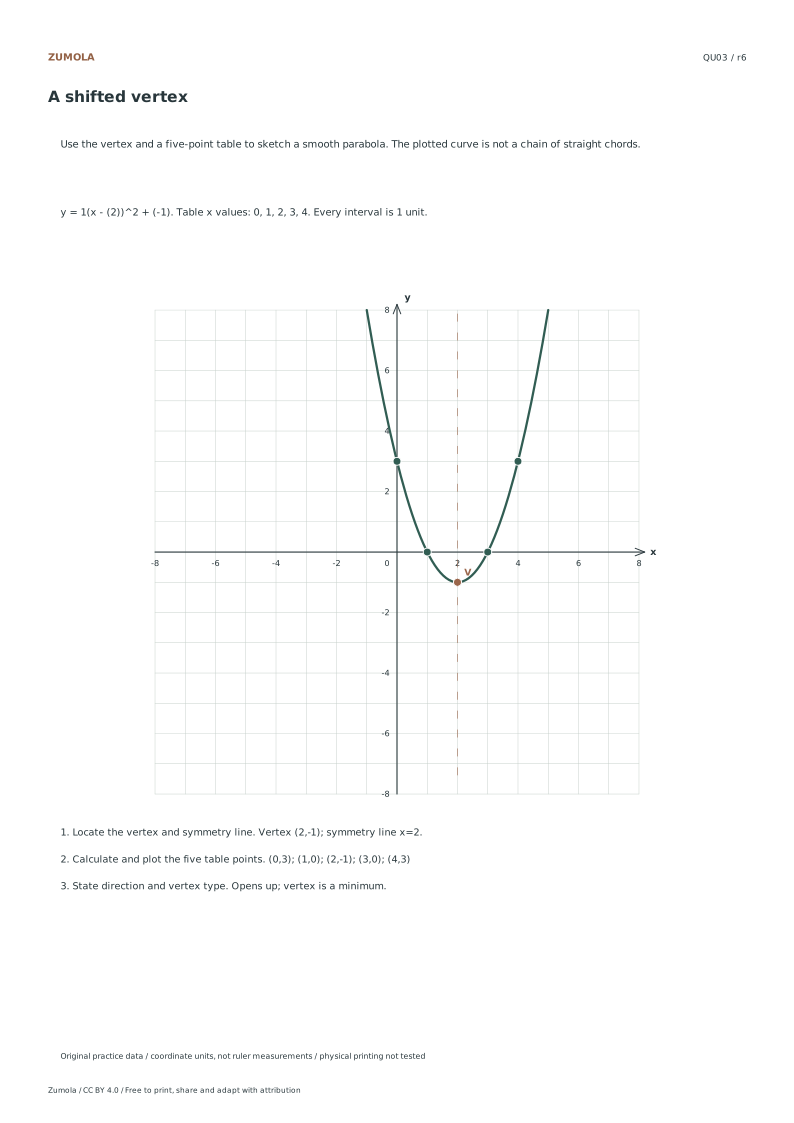
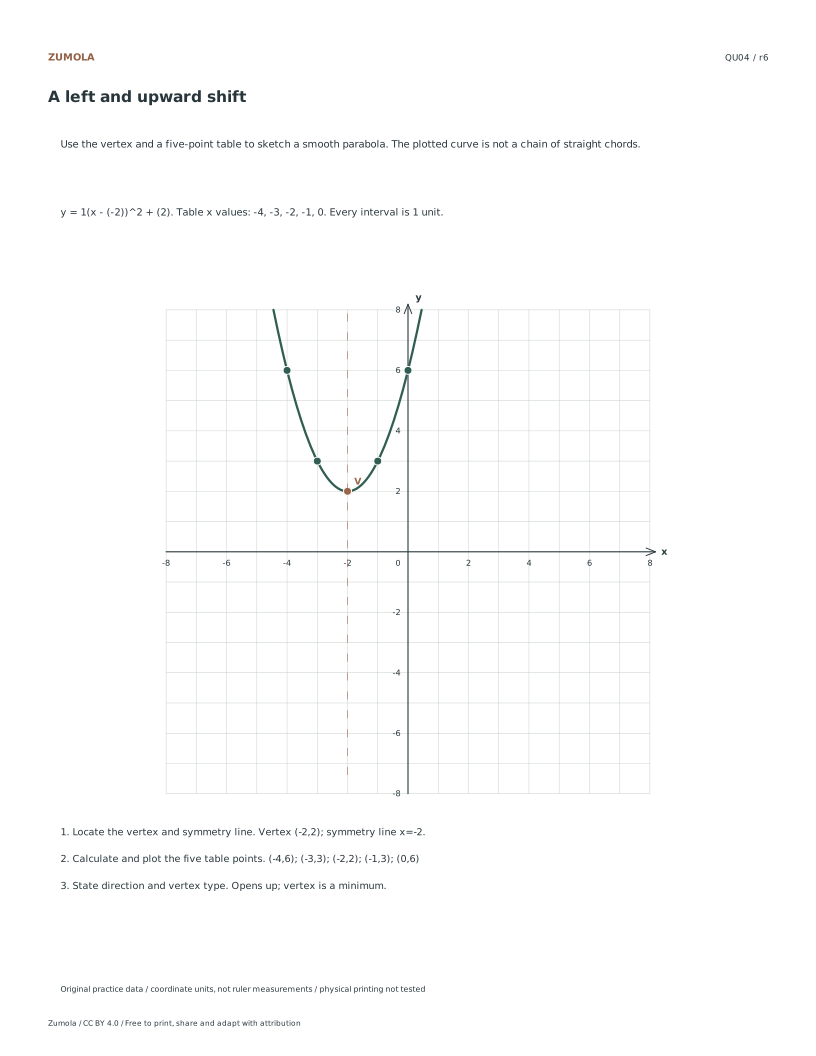
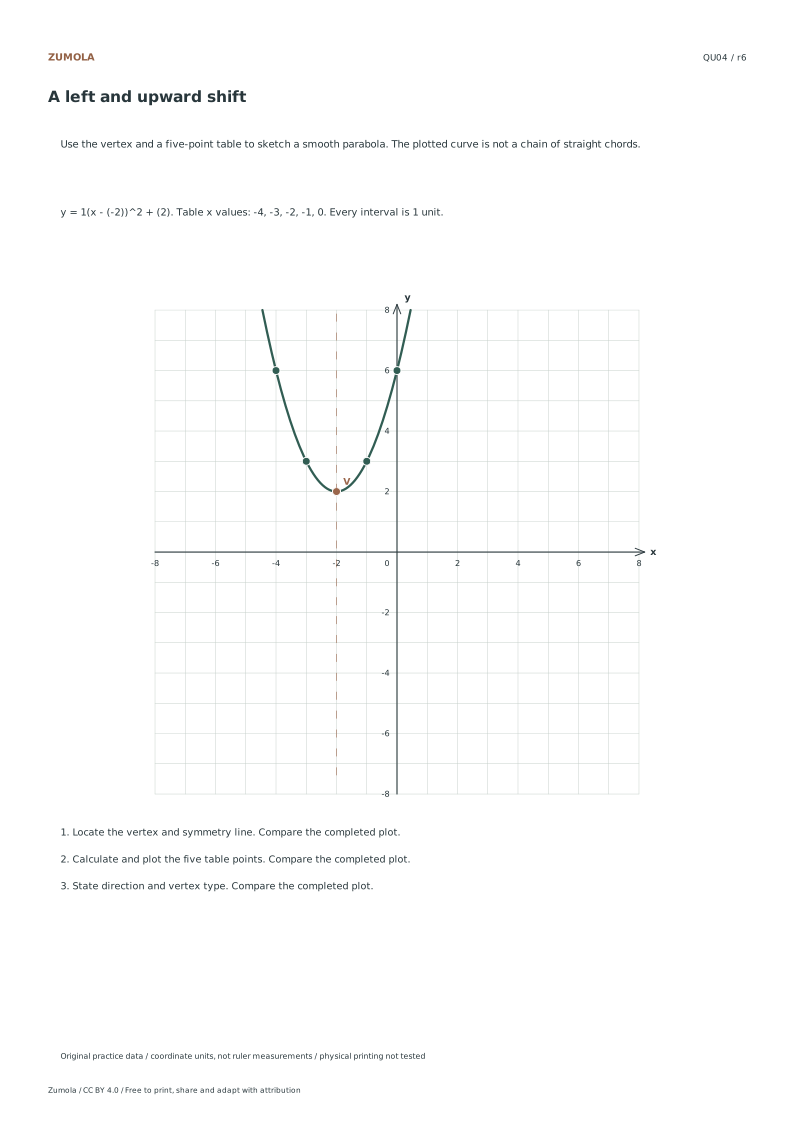
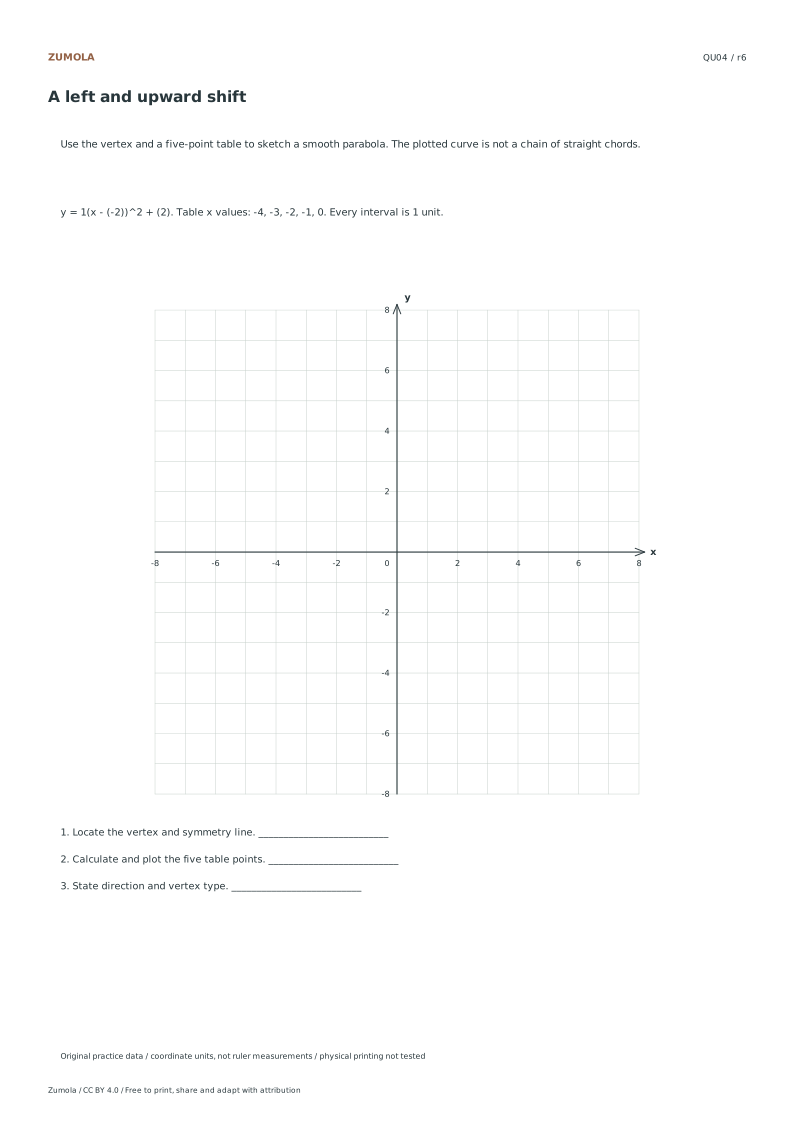
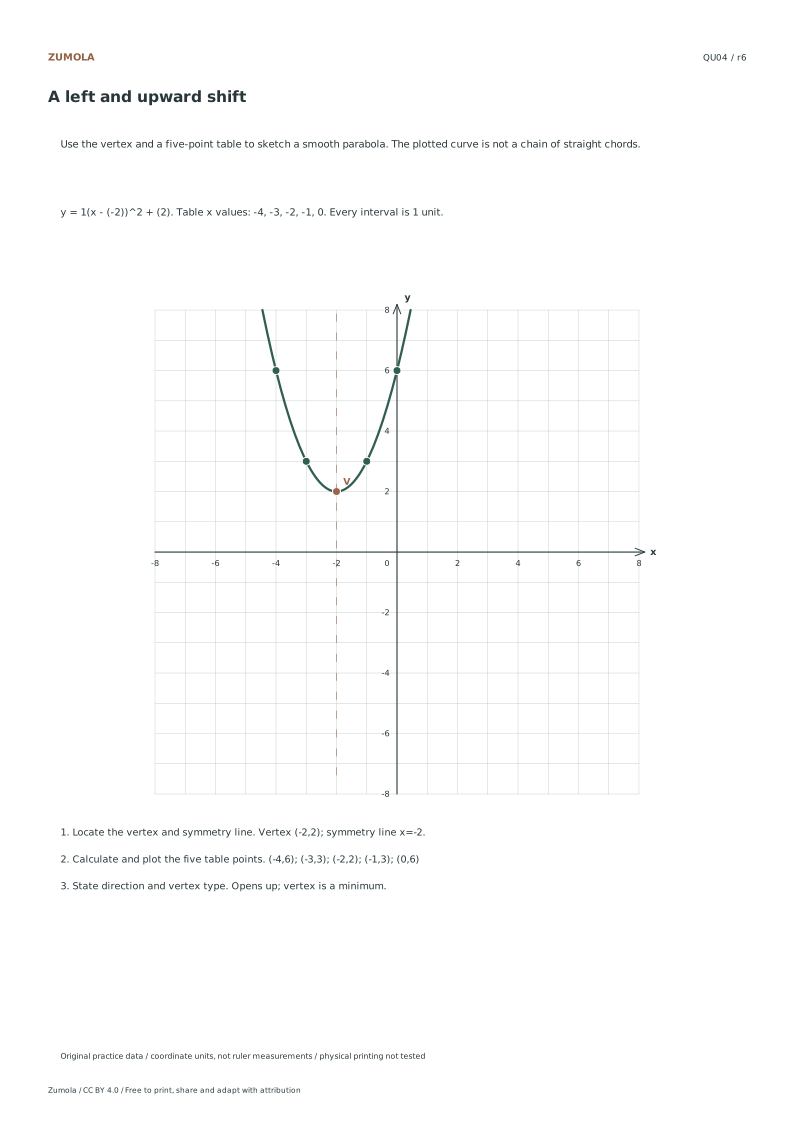
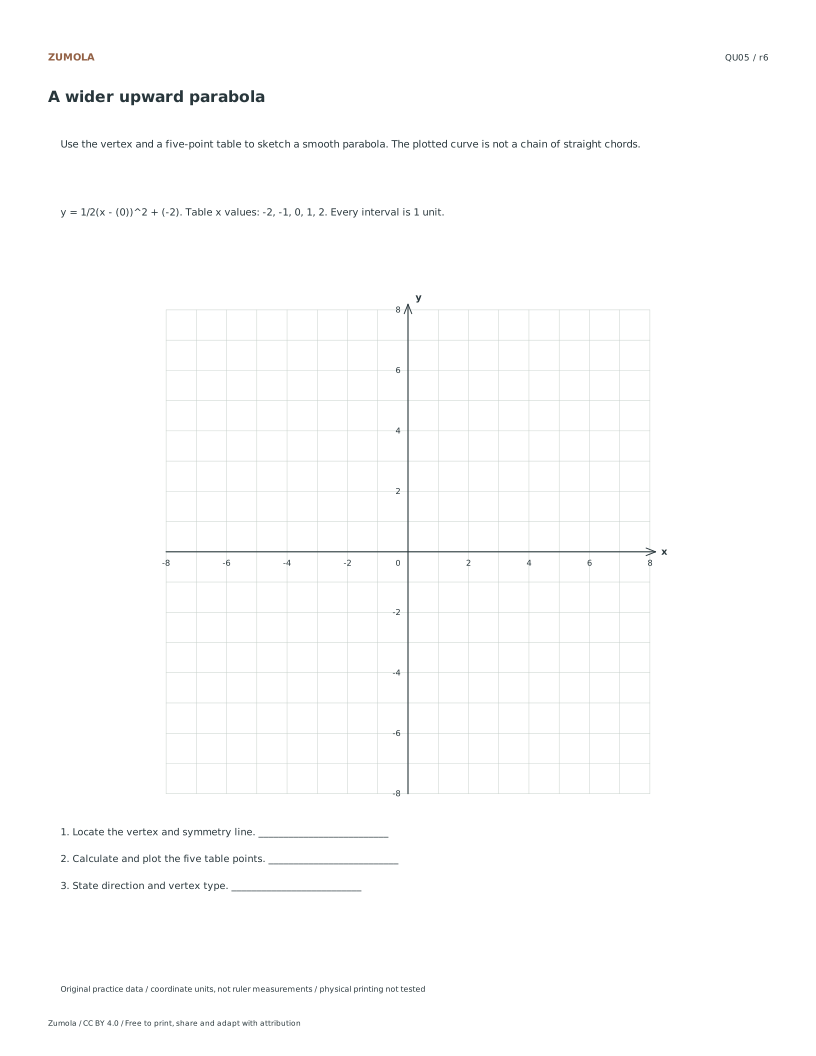
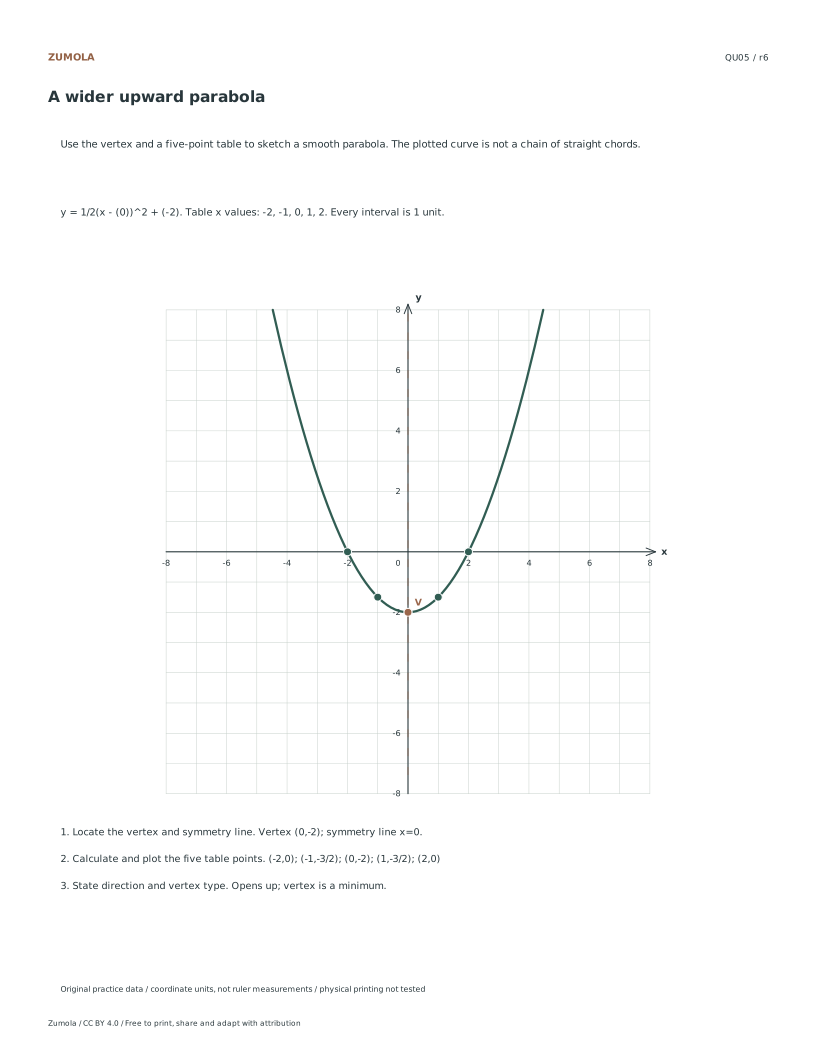
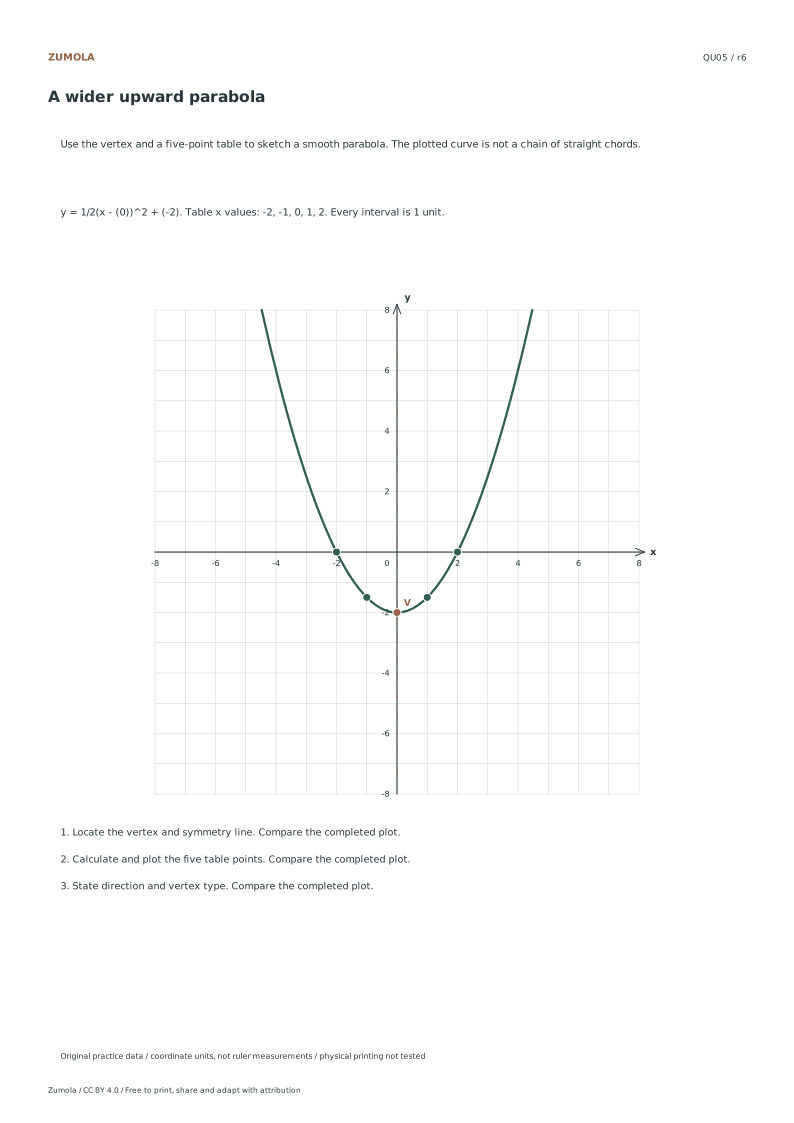
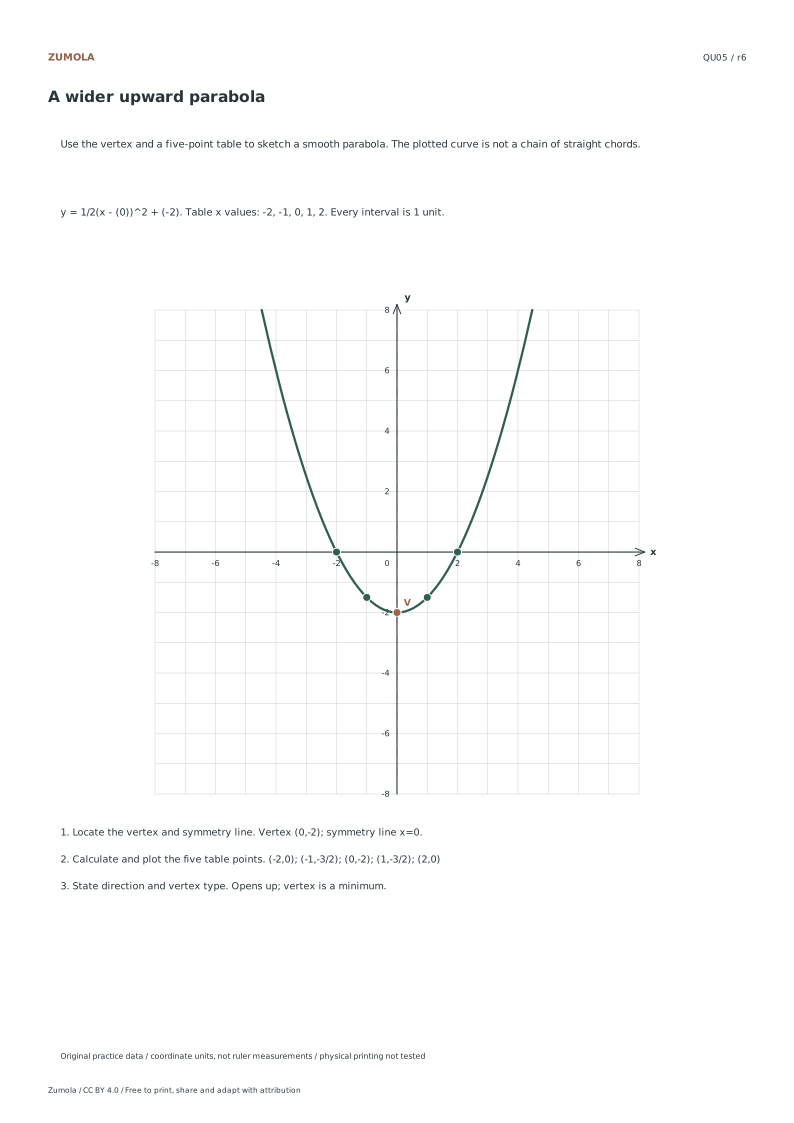
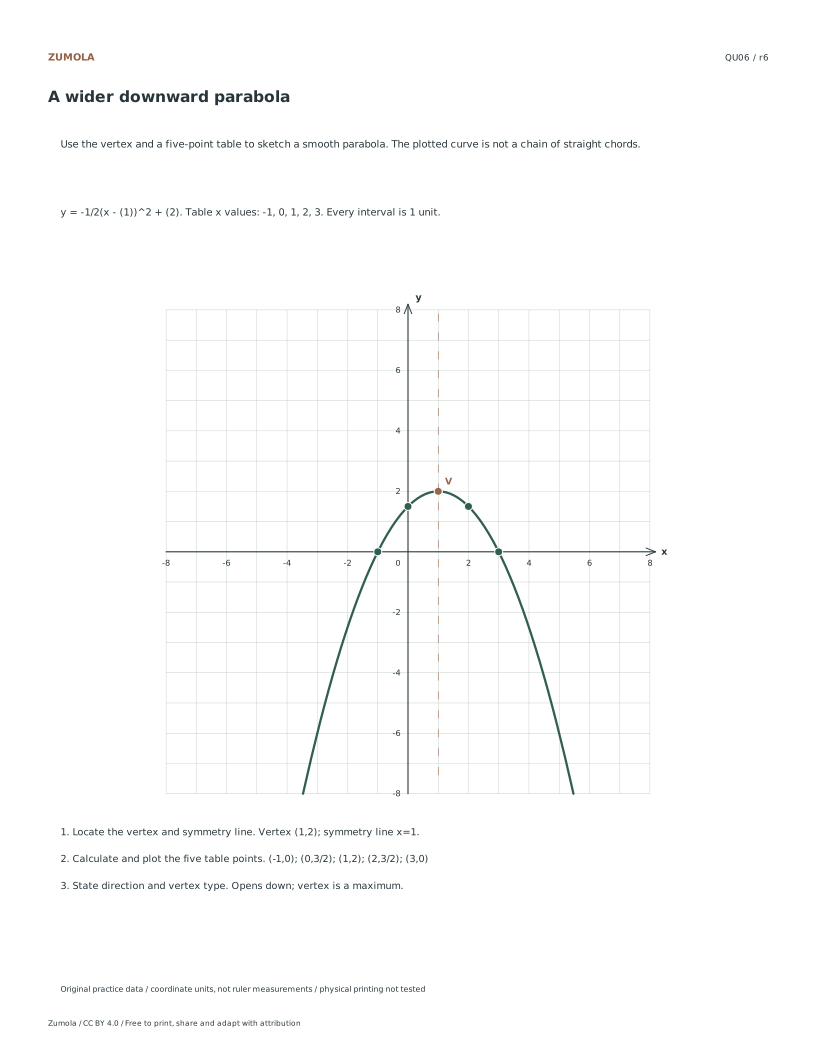
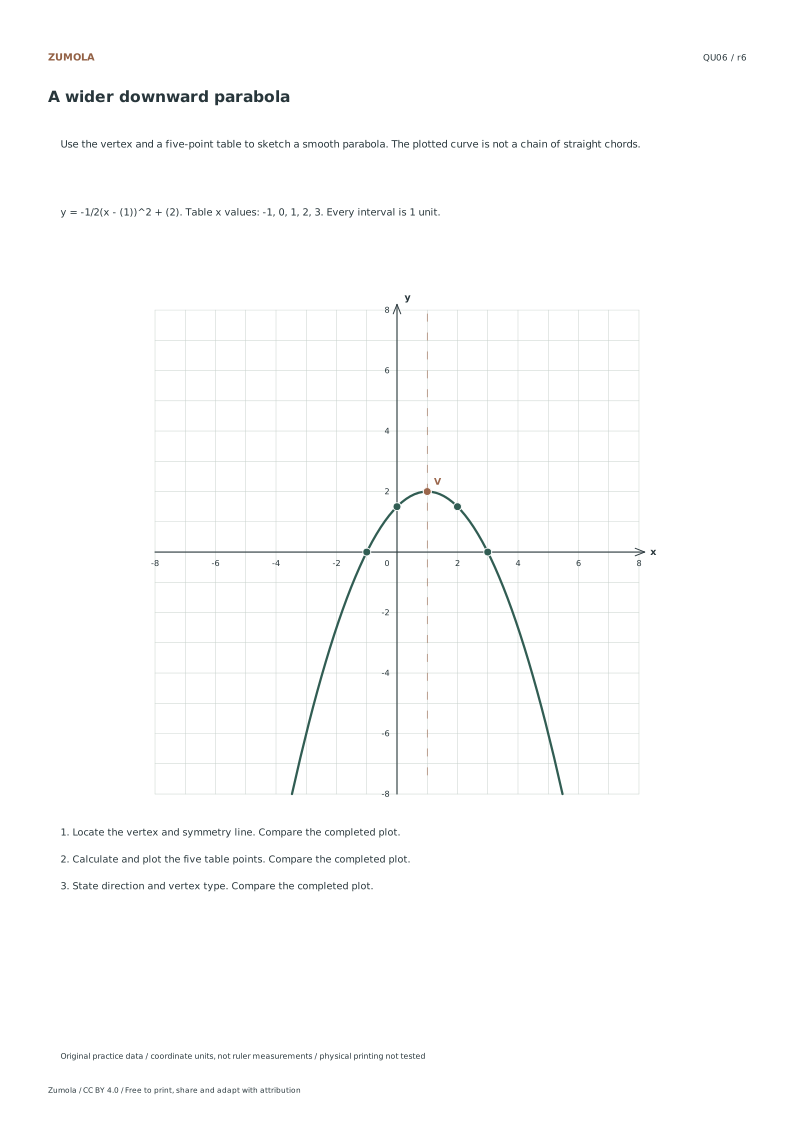
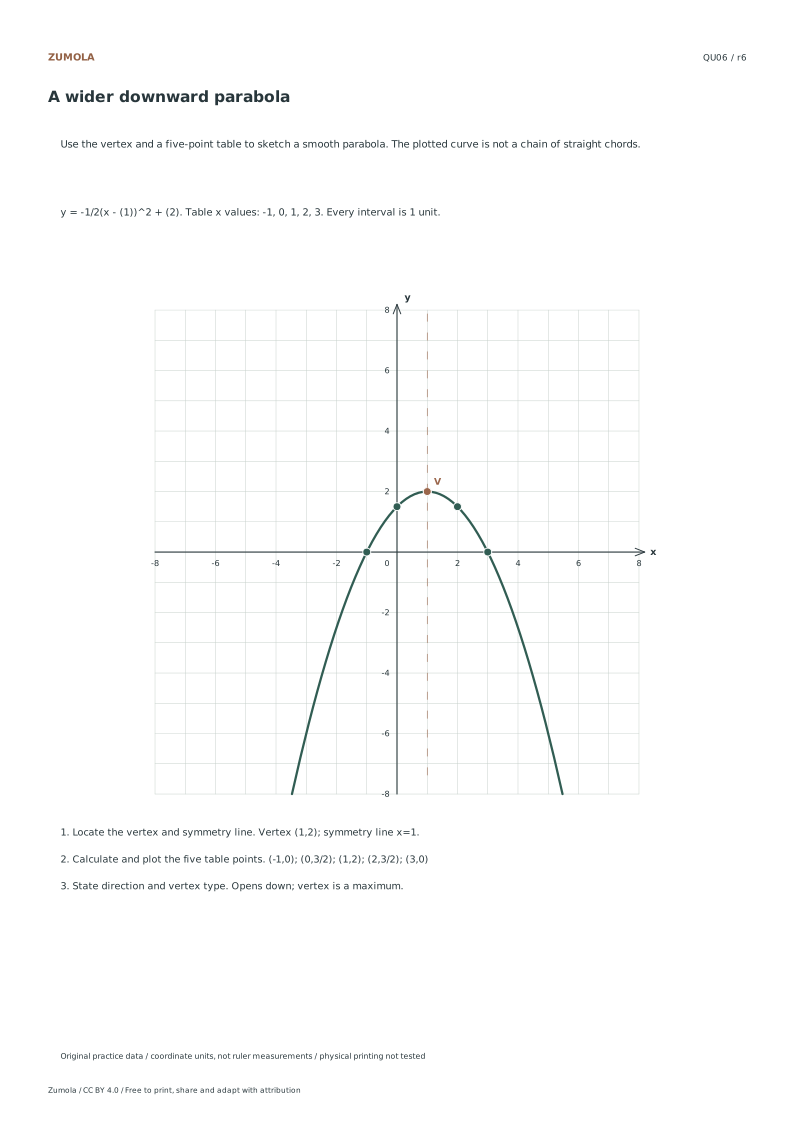
Plot six parabolas from vertex-form equations. Use the vertex, paired table points and a symmetry line to distinguish shifts, opening direction and relative width.
6 quadratic cases.
Vertex + five points + symmetry.
More ways to practice
From intercepts to a complete parabola
A quadratic written as y = a(x - r)(x - s) crosses the x-axis at x = r and x = s when a is not zero. The axis of symmetry sits halfway between the intercepts, at x = (r + s) / 2, and the vertex lies on that line. Substituting the midpoint x-value into the equation gives the vertex y-value. The sign of a decides opening direction: positive opens upward, negative opens downward. The size of a controls relative width compared with y = x squared.
Plot the two intercepts first, then the vertex, then one or two paired points on either side of the axis of symmetry. Label the axis of symmetry as a dashed line and mark the vertex with its coordinates. A graph is complete when the intercepts, vertex, symmetry line and opening direction all agree with the equation.
- Write the equation in factored form and read the two x-intercepts.
- Compute the midpoint of the intercepts to get the axis of symmetry.
- Substitute that x-value to find the vertex y-coordinate.
- Plot intercepts, vertex and at least one mirrored pair of points.
- Label the vertex, intercepts and symmetry line, then check the opening direction against the sign of a.
Diagnostic checks after plotting
Check each feature independently rather than trusting the overall shape. Substitute an intercept into the equation and confirm the result is zero. Substitute the vertex x-value and confirm the y-value matches your plotted point. Confirm that points equidistant from the axis of symmetry have the same y-value. If any check fails, the error is usually a sign slip in the factored form or a misread scale on the grid.
Domain is all real numbers for every quadratic, so the curve should extend beyond the plotted points at both ends. The range depends on the vertex and opening direction: upward parabolas have a minimum y-value at the vertex, downward parabolas have a maximum. State these endpoint conditions explicitly when a task asks for domain and range.
- Substitute each intercept and confirm y equals zero.
- Substitute the vertex x-value and compare with the plotted vertex.
- Test one mirrored pair of points for equal y-values.
- State domain as all real numbers and give the range from the vertex.
Keeping practice and reference answers distinct
A blank coordinate grid is not an answer. The plotted curve, the labelled features and the written reasoning together form the response. Keep the attempt sheet separate from the reference so that checking is a comparison of features, not a copy of a finished drawing. When a task asks for several parabolas, judge each one on its own intercepts, vertex and opening direction.
Because drawings can vary in neatness, use a rubric rather than expecting one exact image. A correct graph may be drawn with slightly different point choices as long as the key features are accurate and labelled.
- Complete the attempt without looking at reference notes.
- Compare feature by feature: intercepts, vertex, symmetry line, opening direction.
- Record which feature failed rather than redrawing the whole curve.
- Re-plot only the corrected feature and recheck it by substitution.
Scale and labelling discipline
Choose a scale that lets both intercepts and the vertex fit on the grid with room to spare. Mark equal spacing on each axis and write the scale near the axis. If intercepts are far apart, a compressed scale may hide the vertex shape; if they are close, an expanded scale may push the curve off the page.
Label the vertex with coordinates, mark intercepts clearly, and draw the symmetry line as a dashed guide. Keep labels away from the curve so they remain readable.
- Decide the x-range needed to include both intercepts and the vertex.
- Mark equal grid spacing and note the scale.
- Label vertex, intercepts and symmetry line without overlapping the curve.
A factored-form worked example
Consider y = (x - 1)(x - 5). The intercepts are x = 1 and x = 5. The axis of symmetry is x = 3, the midpoint. Substituting x = 3 gives y = (2)(-2) = -4, so the vertex is (3, -4). Because the leading coefficient is positive, the parabola opens upward. A mirrored pair such as x = 2 and x = 4 both give y = -3, confirming symmetry.
The domain is all real numbers; the range is y greater than or equal to -4. A plotted graph is correct when it passes through (1, 0), (5, 0), (3, -4) and the mirrored pair (2, -3) and (4, -3), with the symmetry line at x = 3.
- Read intercepts 1 and 5 from the factored form.
- Compute midpoint x = 3 for the axis of symmetry.
- Substitute x = 3 to get vertex y = -4.
- Verify mirrored points at x = 2 and x = 4 both give y = -3.
- State domain all reals and range y greater than or equal to -4.
Try this example
Graph y = (x - 1)(x - 5) and state its intercepts, vertex, axis of symmetry, domain and range.
Show the worked explanation
Intercepts at x = 1 and x = 5. Axis of symmetry x = 3. Vertex (3, -4) because (3 - 1)(3 - 5) = 2 times -2 = -4. Opens upward since the leading coefficient is positive. Mirrored points x = 2 and x = 4 both give y = -3. Domain is all real numbers; range is y greater than or equal to -4.
Common mistakes
- Reading intercepts as (0, r) and (0, s) instead of (r, 0) and (s, 0). Remember factored form gives x-intercepts where y equals zero; plot them on the horizontal axis.
- Placing the vertex at one of the intercepts. Compute the midpoint of the intercepts and substitute that x-value to find the vertex.
- Assuming a negative leading coefficient makes the parabola narrower. The sign of a sets opening direction; the absolute value of a controls relative width.
Check your work
- Both x-intercepts are plotted at the correct coordinates.
- The axis of symmetry is drawn at the midpoint of the intercepts and labelled.
- The vertex coordinates match substitution into the equation.
- Opening direction agrees with the sign of the leading coefficient.
- At least one mirrored pair of points has equal y-values.
- Domain and range are stated with correct endpoint conditions.
- Labels and scale remain readable and do not overlap the curve.
Questions before you start
How do I find the vertex from factored form?
Average the two x-intercepts to get the axis of symmetry, then substitute that x-value into the equation to find the vertex y-coordinate.
What domain and range should I state for a quadratic?
Domain is all real numbers. Range starts at the vertex y-value and extends upward for an upward parabola, or downward for a downward parabola.
Why do mirrored points help check a parabola?
Points equidistant from the axis of symmetry must share the same y-value; a mismatch signals a plotting or substitution error.