Reference diagrams
LETTER · Download PDF
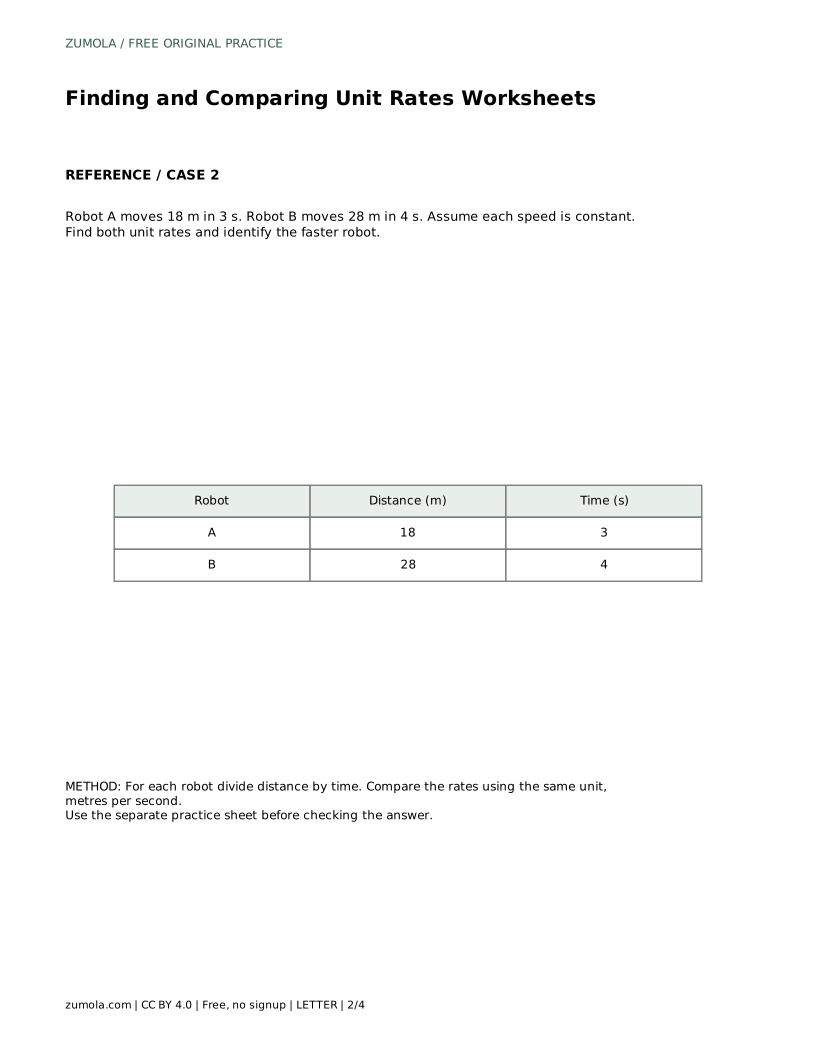
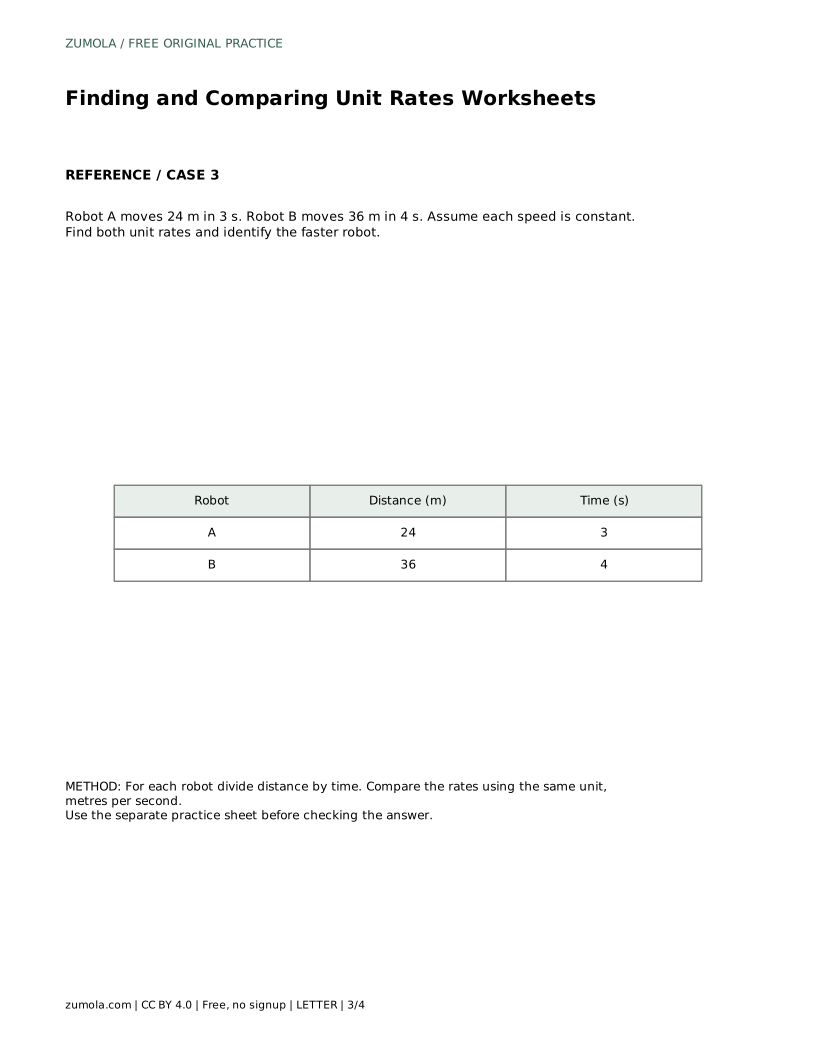
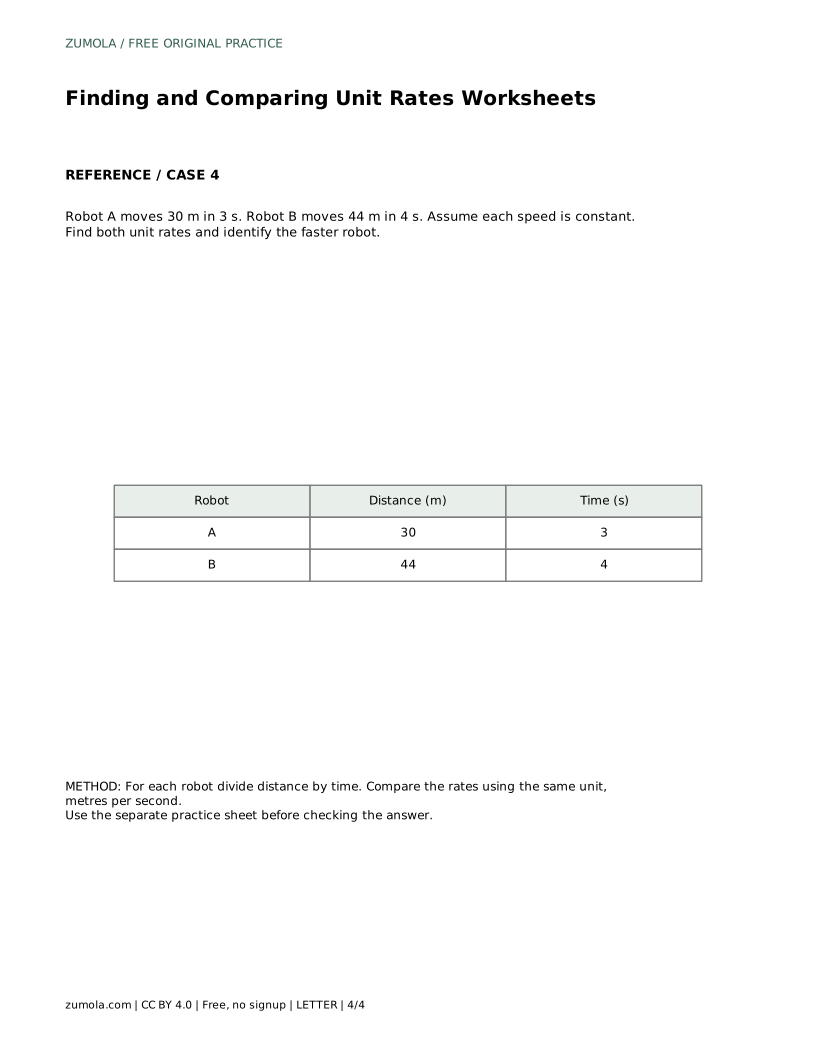
A4 · Download PDF
Free original resources
Practice finding unit rates from distance and time, comparing speeds in the same unit, and plotting constant-rate points on a graph with a clear rubric.
Four original cases, with reference diagrams, practice sheets and worked answers. Everything is free; no signup required.
LETTER · Download PDF
A4 · Download PDF
LETTER · Download PDF
A4 · Download PDF
LETTER · Download PDF
A4 · Download PDF
Use A4 or US Letter to match your printer. Use the stated values and conditions to solve each exercise; diagrams are not physical measuring rulers.
A unit rate tells you how much happens in one unit of time or per one item. In this worksheet skill, you divide distance by time to get metres per second, then compare two constant speeds. You will also plot each robot's distance-time points so the steeper line shows the faster rate. The key idea is that a unit rate makes different totals comparable because both are reduced to the same single-unit basis.
A rate compares two quantities with different units, such as metres and seconds. A unit rate rewrites that comparison so the second quantity is exactly 1. For constant speed, divide distance by time: metres divided by seconds gives metres per second. If a robot travels 12 m in 3 s, the unit rate is 12 ÷ 3 = 4 m/s. That means 4 metres for every 1 second, assuming the speed stays constant.
A distance-time graph plots time on the horizontal axis and distance on the vertical axis. For a constant rate, the points lie on a straight line starting at (0, 0). The slope, or steepness, equals the unit rate. Two robots with different speeds produce lines with different slopes, so the faster robot has the steeper line. Always label axes with units before plotting.
Comparing totals directly can mislead you. A robot that travels farther may simply have run longer. Converting both to unit rates removes that advantage because each rate describes one second. Only compare rates that share the same units; 4 m/s and 5 m/s are comparable, but 4 m/s and 5 km/h are not without conversion.
Keep the assumption of constant speed explicit. Real motion can speed up or slow down, and then a single unit rate would not describe the whole trip. On a graph, changing speed appears as a curved or bent line rather than one straight line. For these worksheets, treat each robot's speed as steady unless a problem states otherwise.
Plot the origin (0, 0) because zero time means zero distance at a constant rate. Then plot each robot's given point. A second point helps confirm the line: at 1 second, distance equals the unit rate. For Robot A at 4 m/s, the point (1, 4) lies on the same line as (3, 12).
Check division by multiplying back: 4 m/s × 3 s = 12 m. This catches swapped numbers and unit errors. Label each line with the robot name so the comparison stays clear.
Graphing has several valid presentations, so judge the work by criteria rather than one exact picture. A correct graph can use different scales as long as the axes are labeled and the points are placed accurately. Focus on whether the unit rates are correct, units are stated, and the steeper line matches the faster robot.
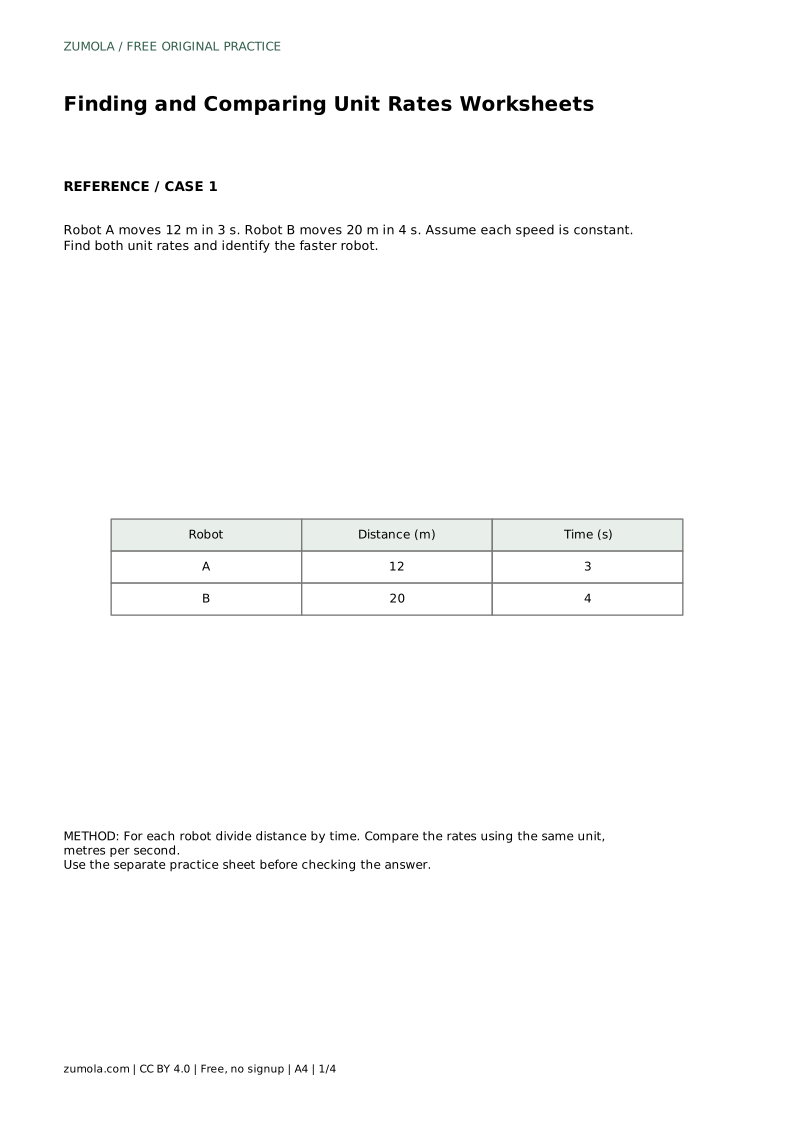
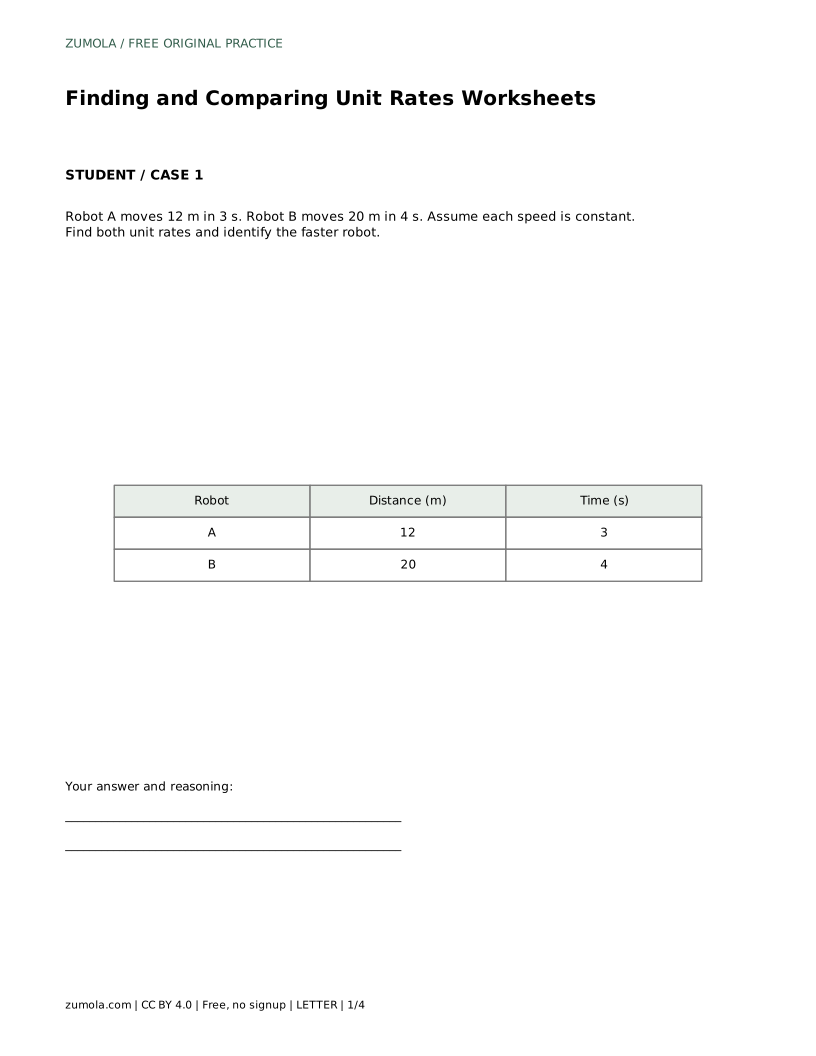
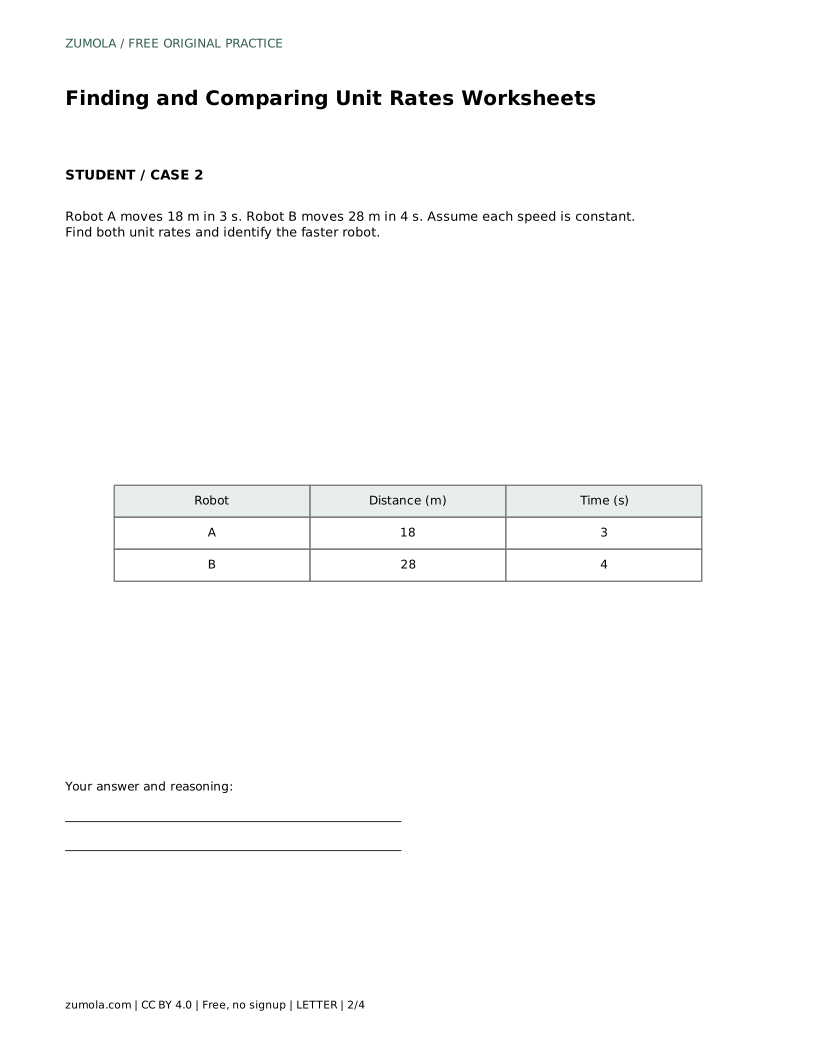
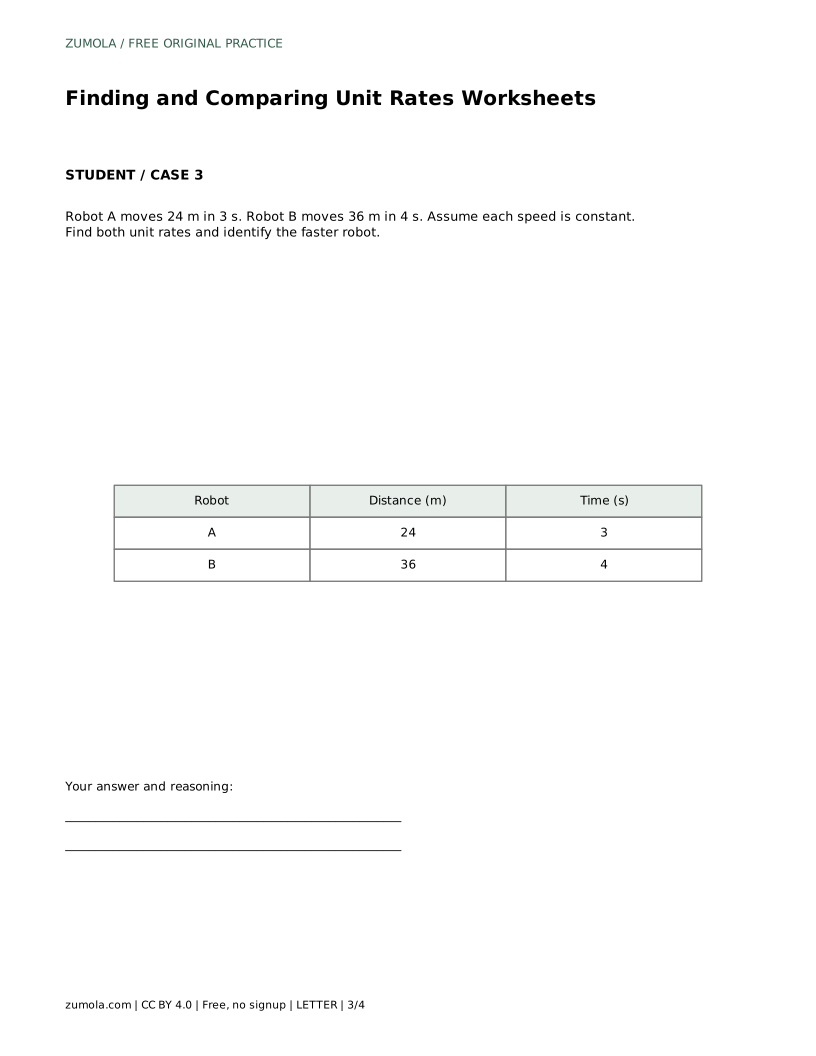
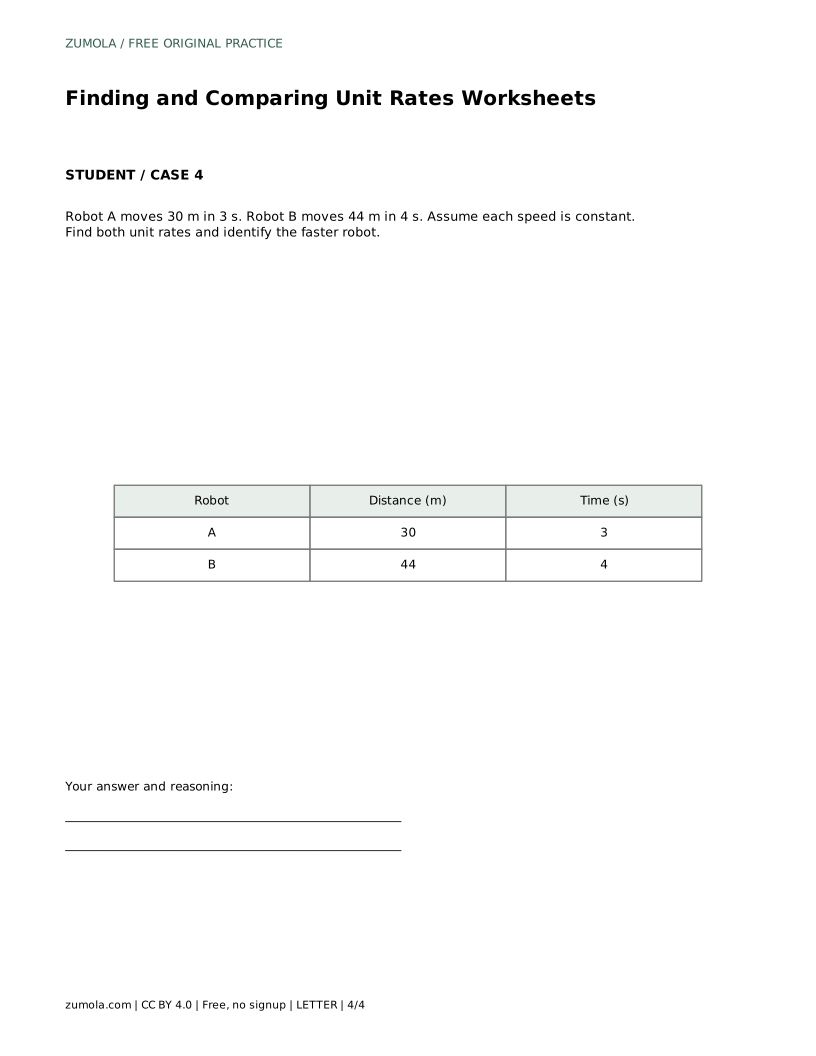
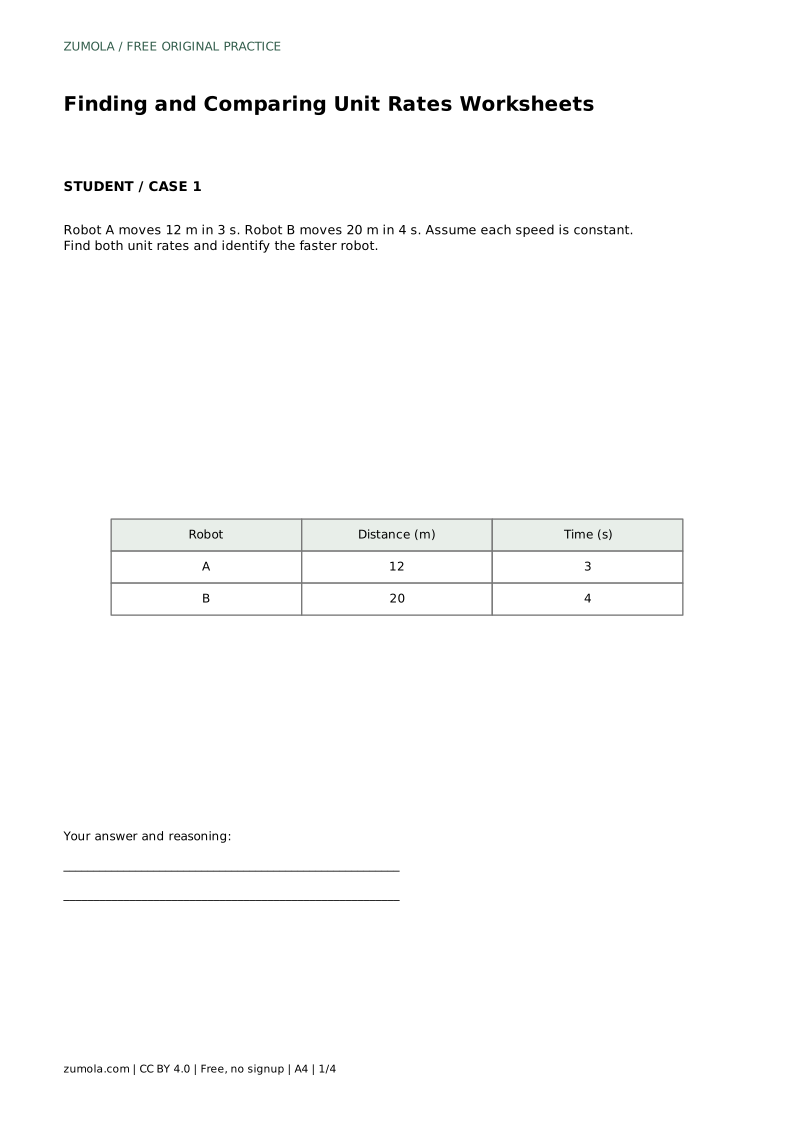
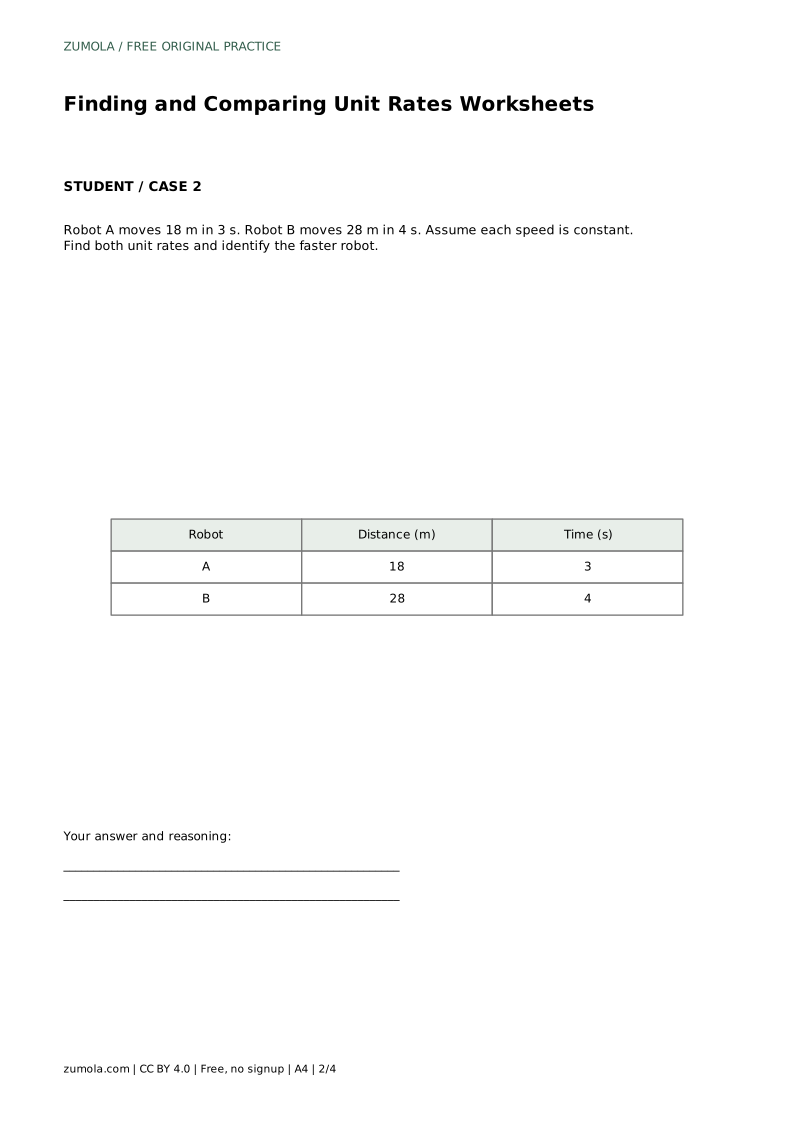
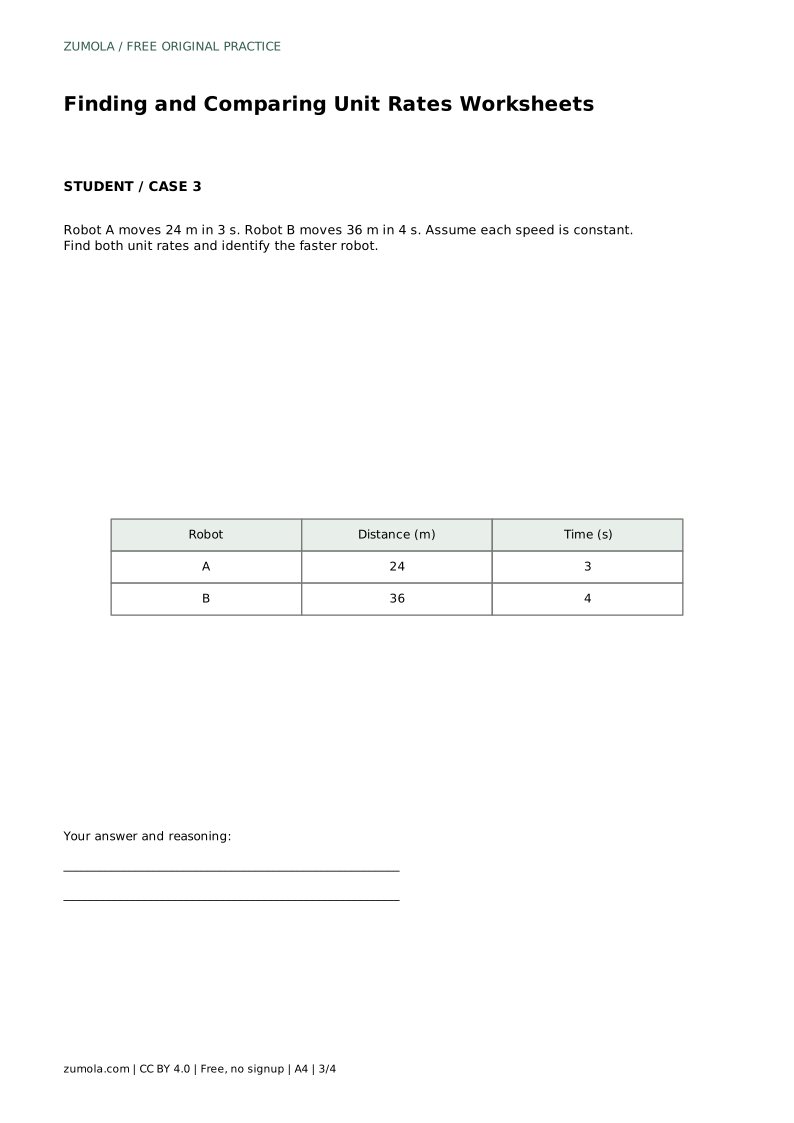
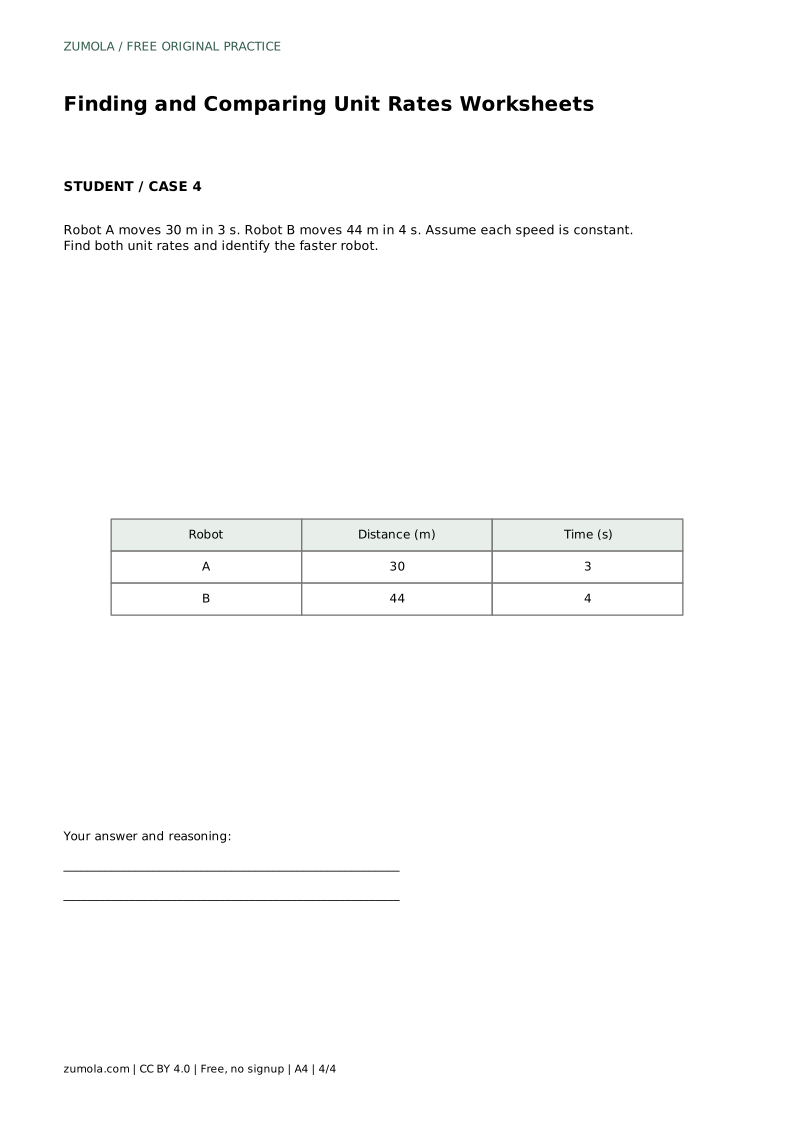
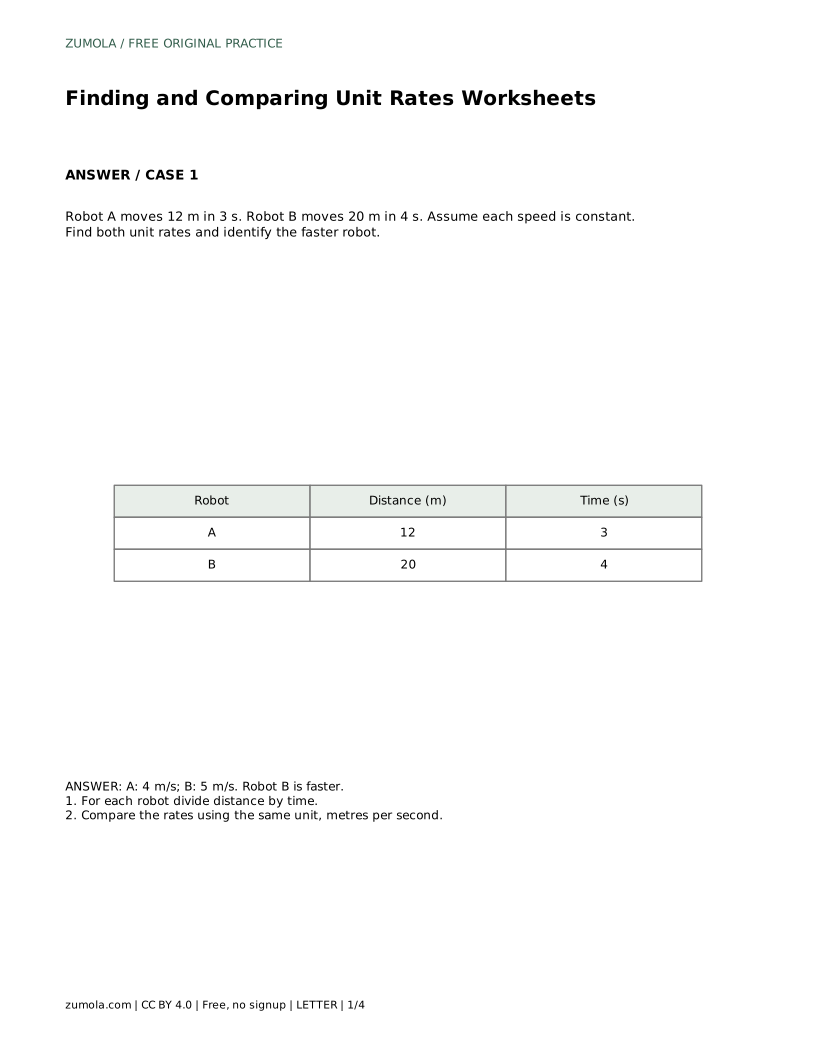
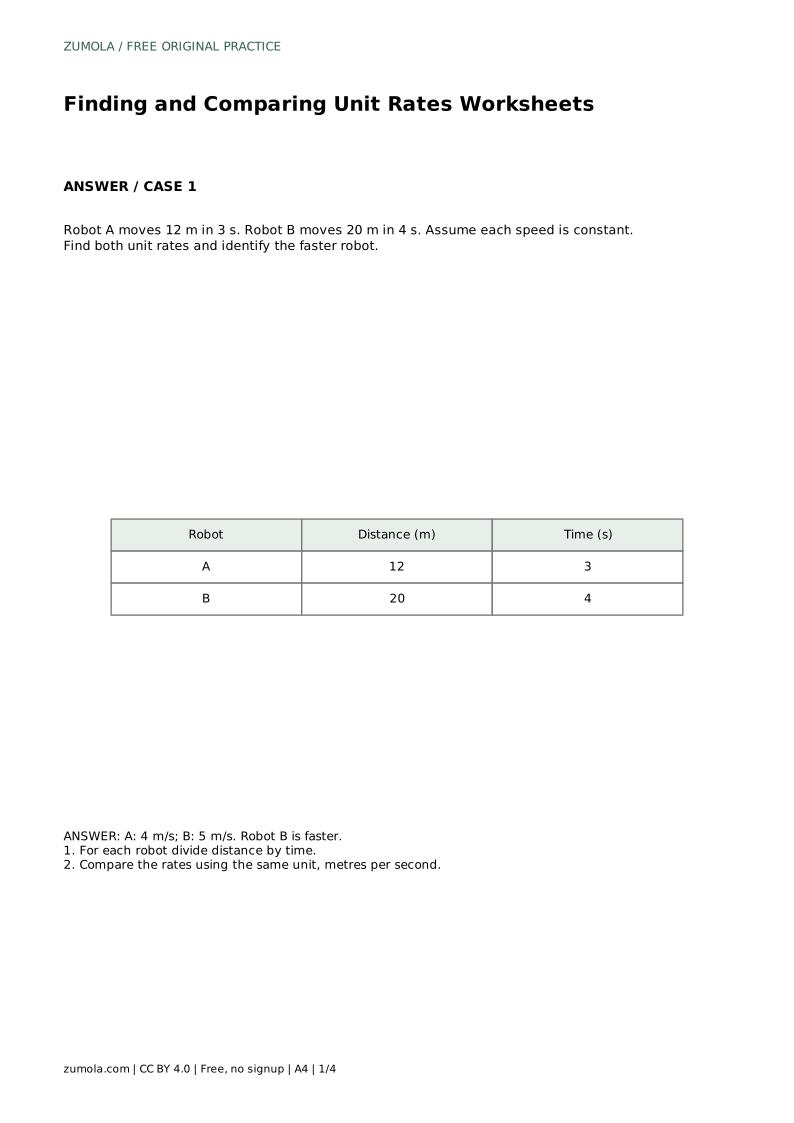
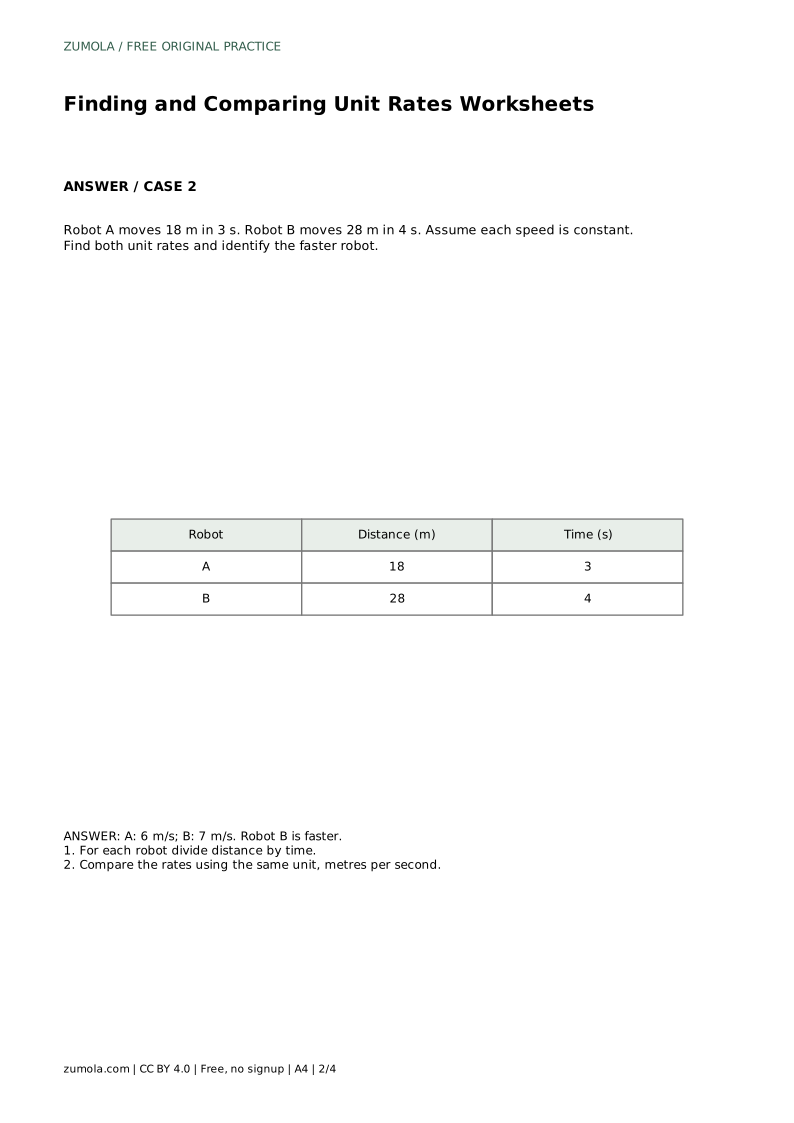
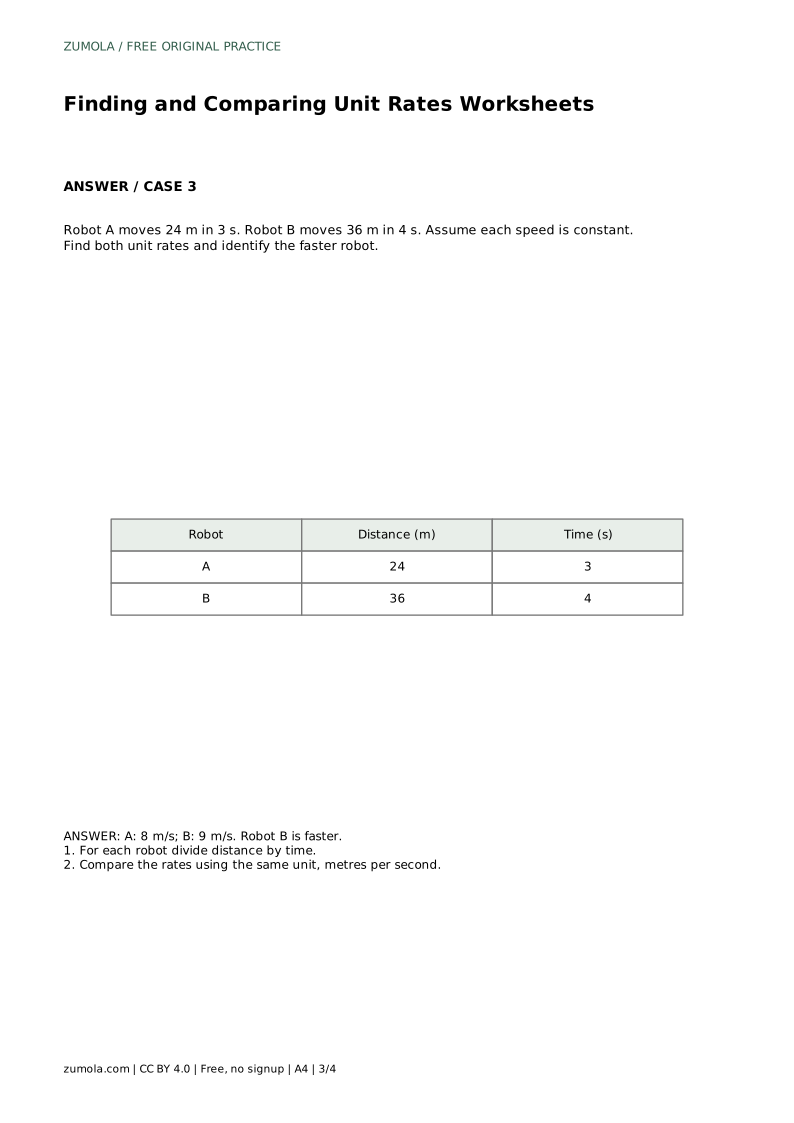
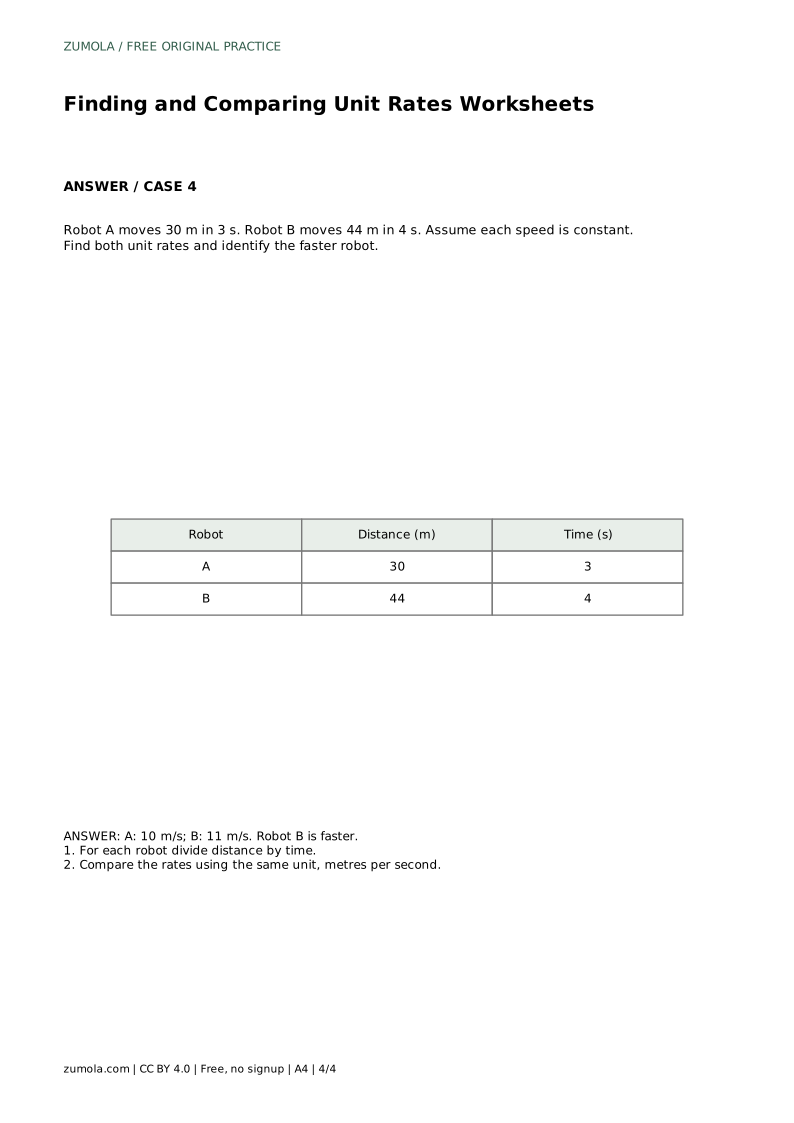
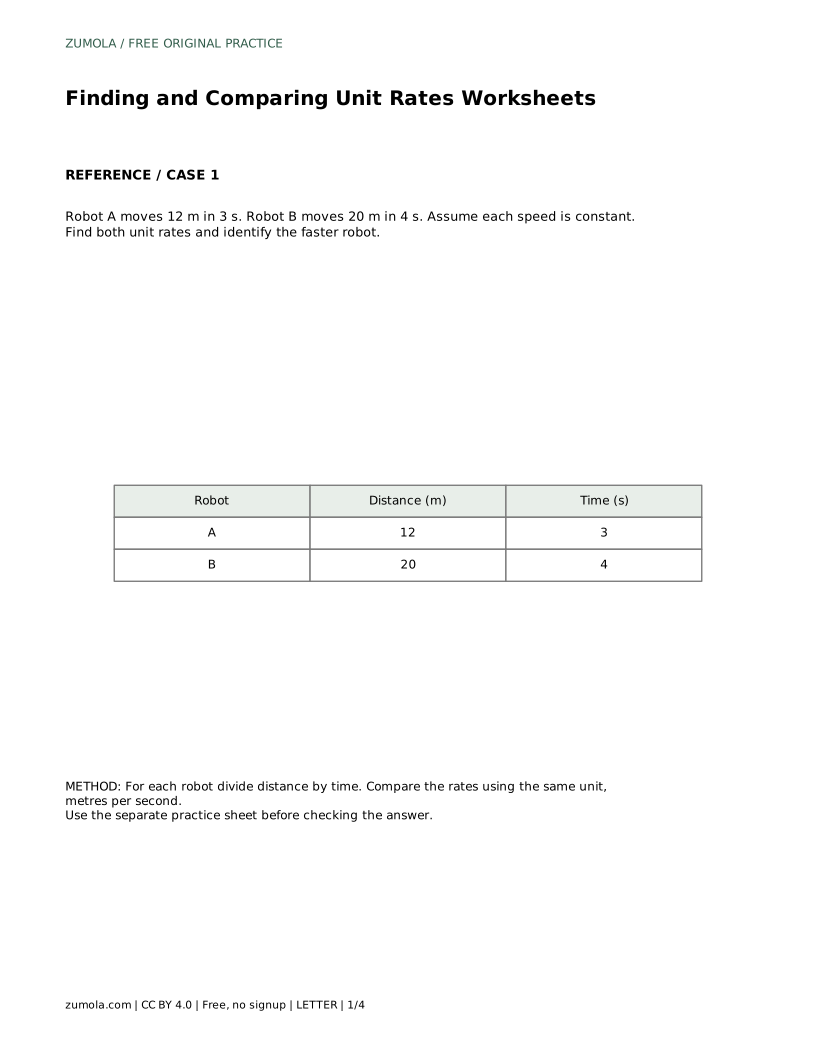
Robot A moves 12 m in 3 s. Robot B moves 20 m in 4 s. Assume each speed is constant. Find both unit rates and identify the faster robot.
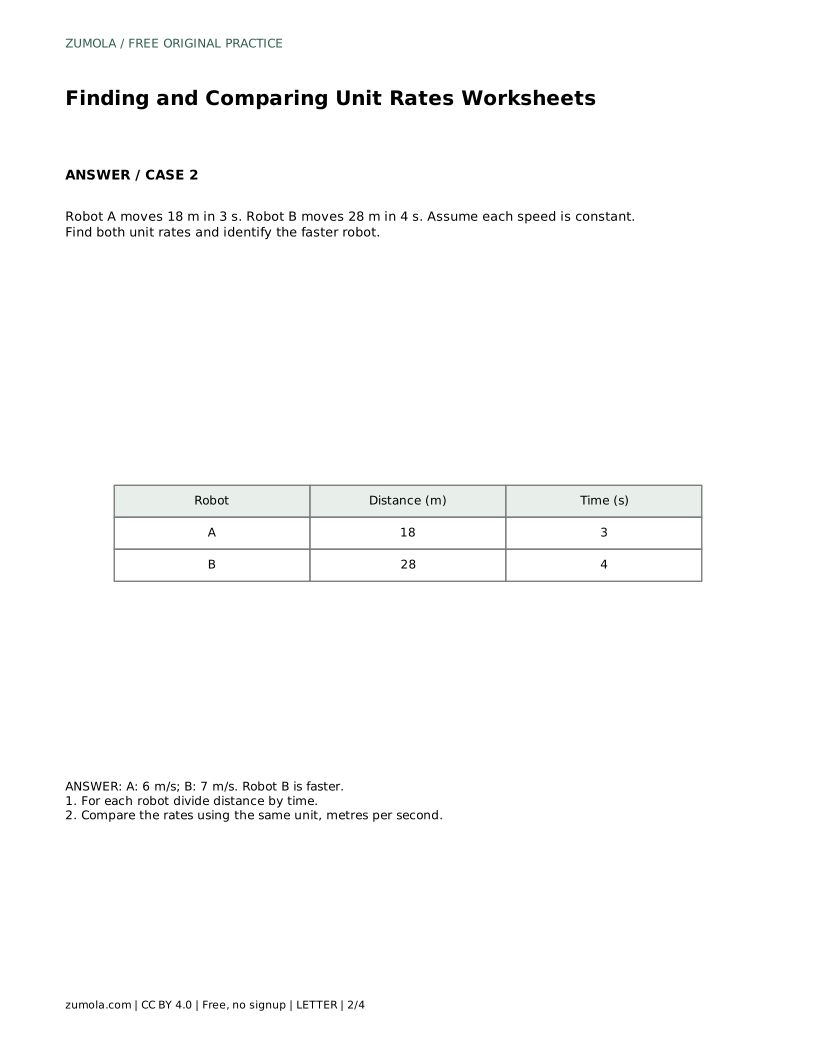
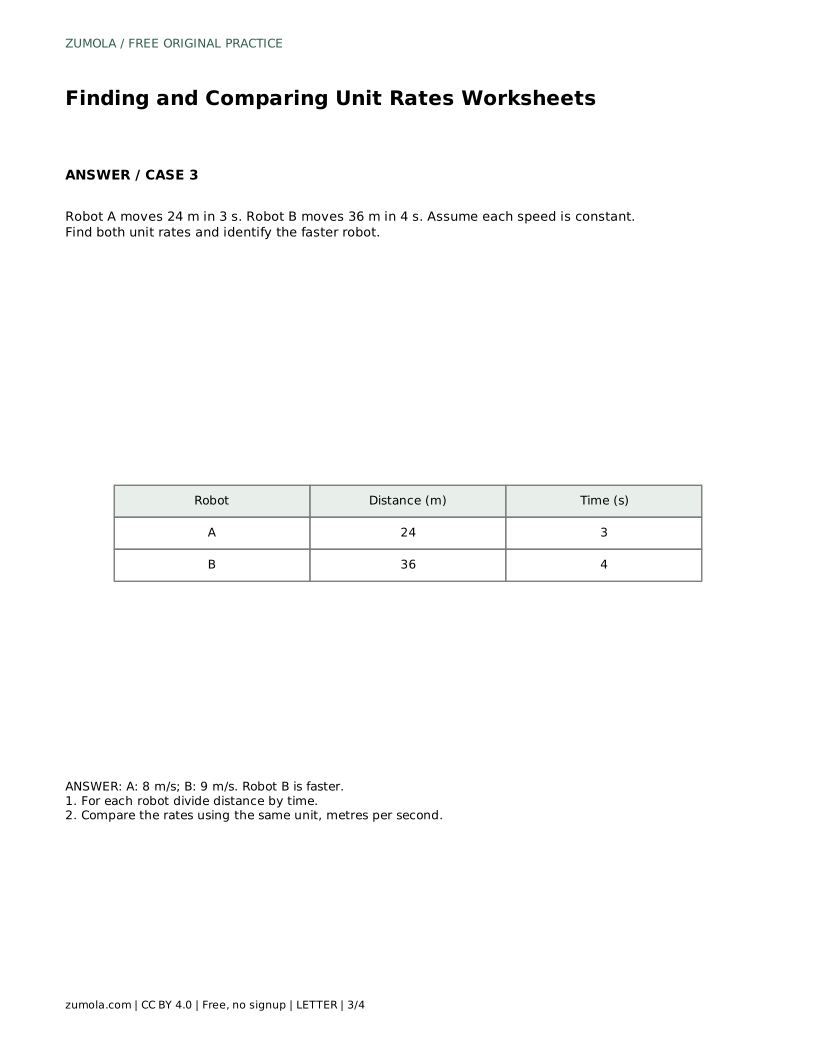
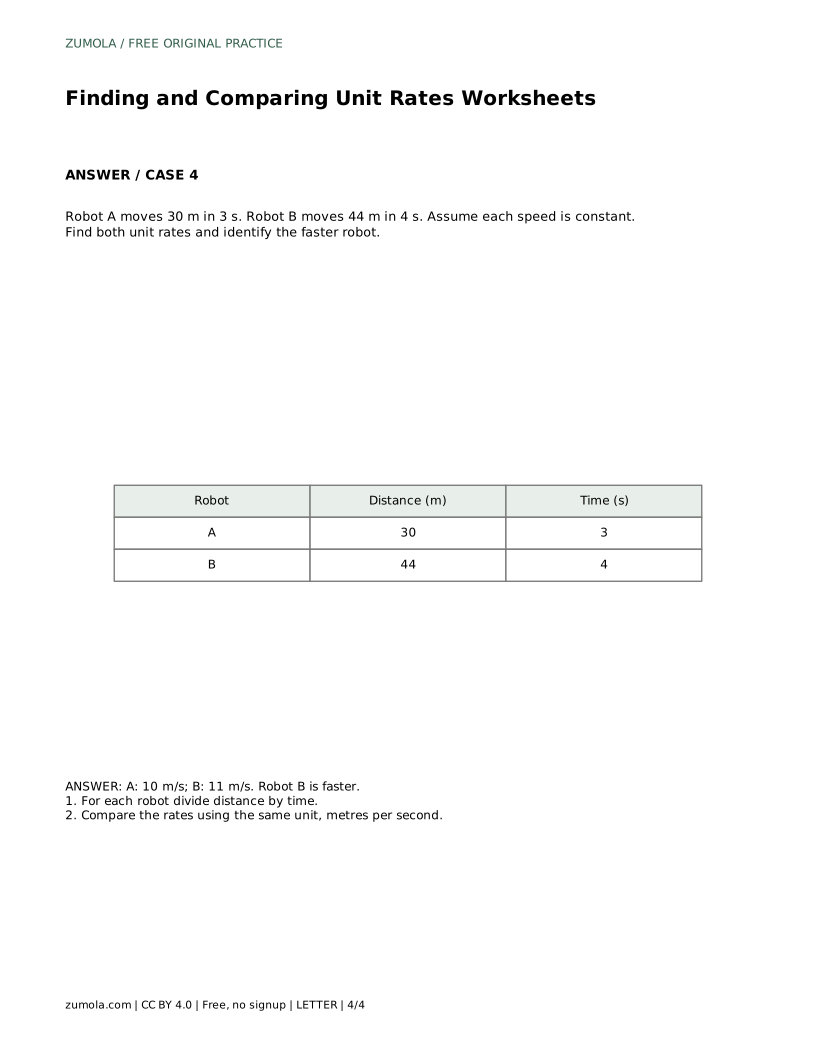
A: 4 m/s; B: 5 m/s. Robot B is faster. For each robot divide distance by time. Compare the rates using the same unit, metres per second.
Dividing distance by time gives metres per second, a rate describing one second. Time divided by distance gives seconds per metre, a different rate.
Yes, when both axes use the same units and scale. Slope equals distance divided by time, so a steeper line means more metres per second.
Their lines have the same slope and overlap if plotted on the same axes. Neither is faster under the constant-speed assumption.
All math worksheets · Free coordinate paper
Original resources · CC BY 4.0 · Free for personal and classroom use with attribution.