Free original resources
Graphing Polynomial Functions Worksheet: Zeros, Multiplicity, End Behavior
Learn to sketch polynomial graphs from factored zeros, multiplicity, and end behavior. Includes a worked example, common mistakes, and a drawing rubric.
Free resources
Letter & A4
PDF & SVG
Letter & A4
PDF & SVG
Make it yours.
Free · no signup · calculated in your browser
Your free printable kit.
Original reference, student practice and separate worked answers. No account or payment.
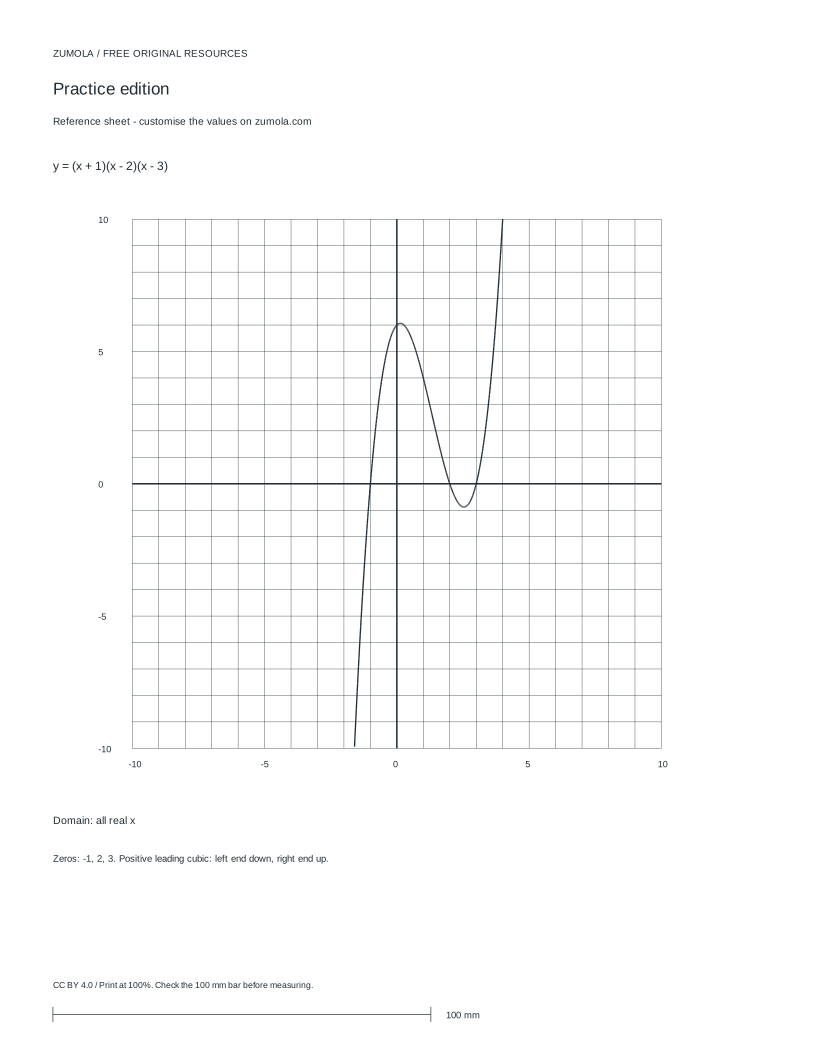
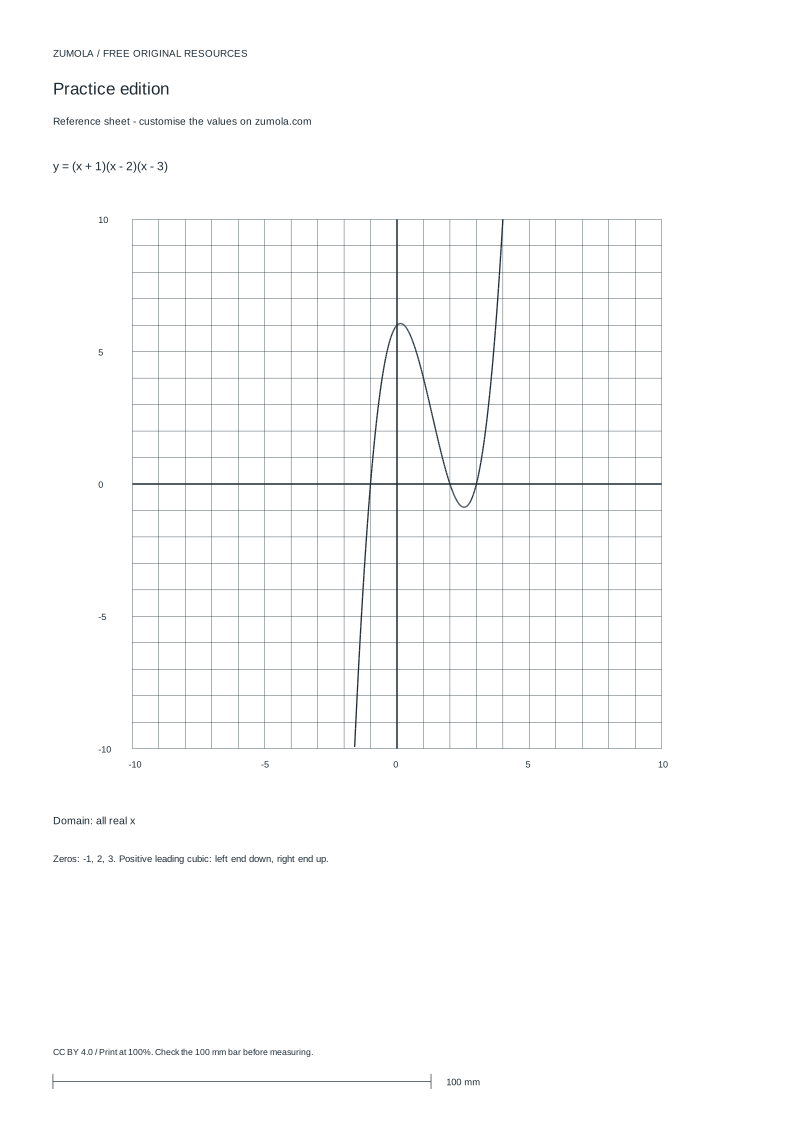
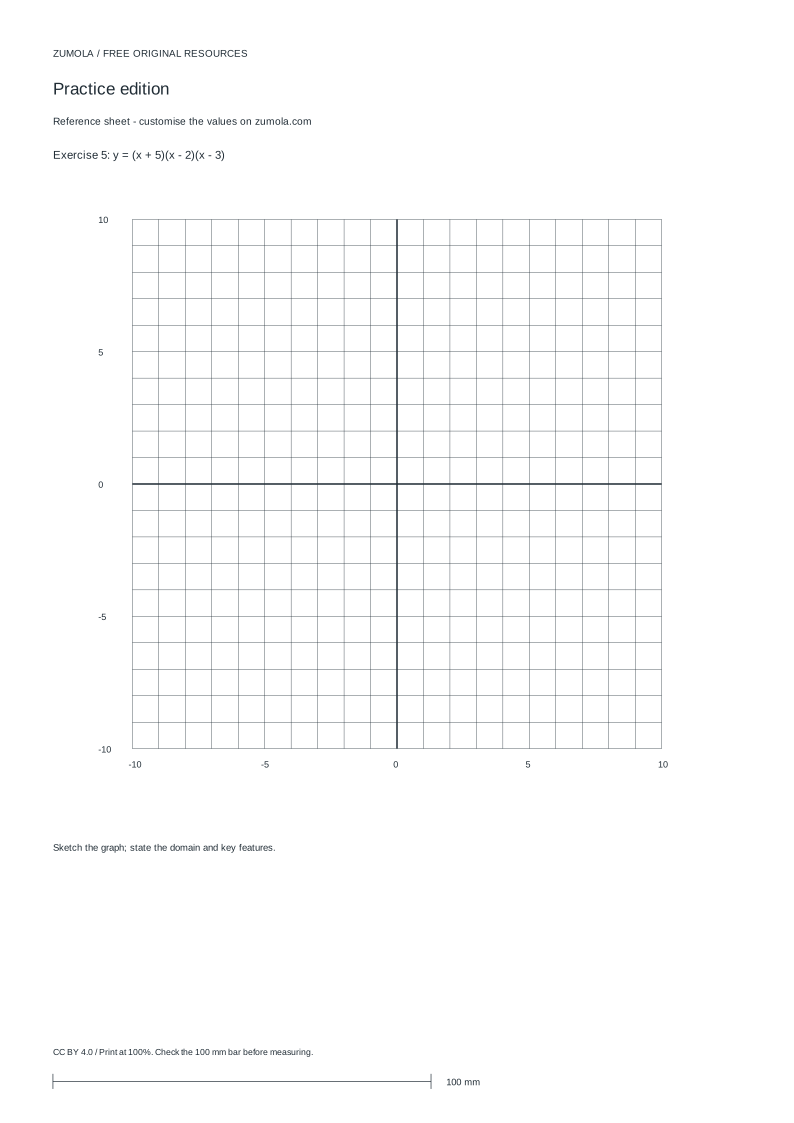
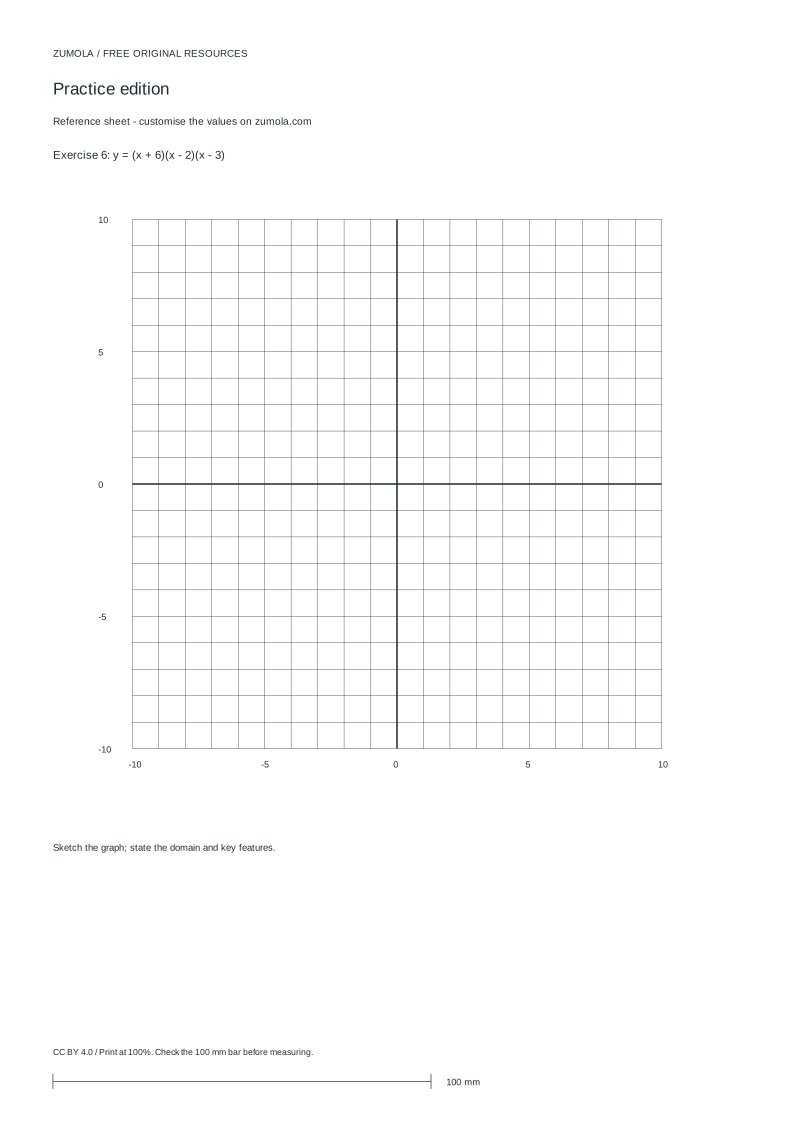
Practice worksheet
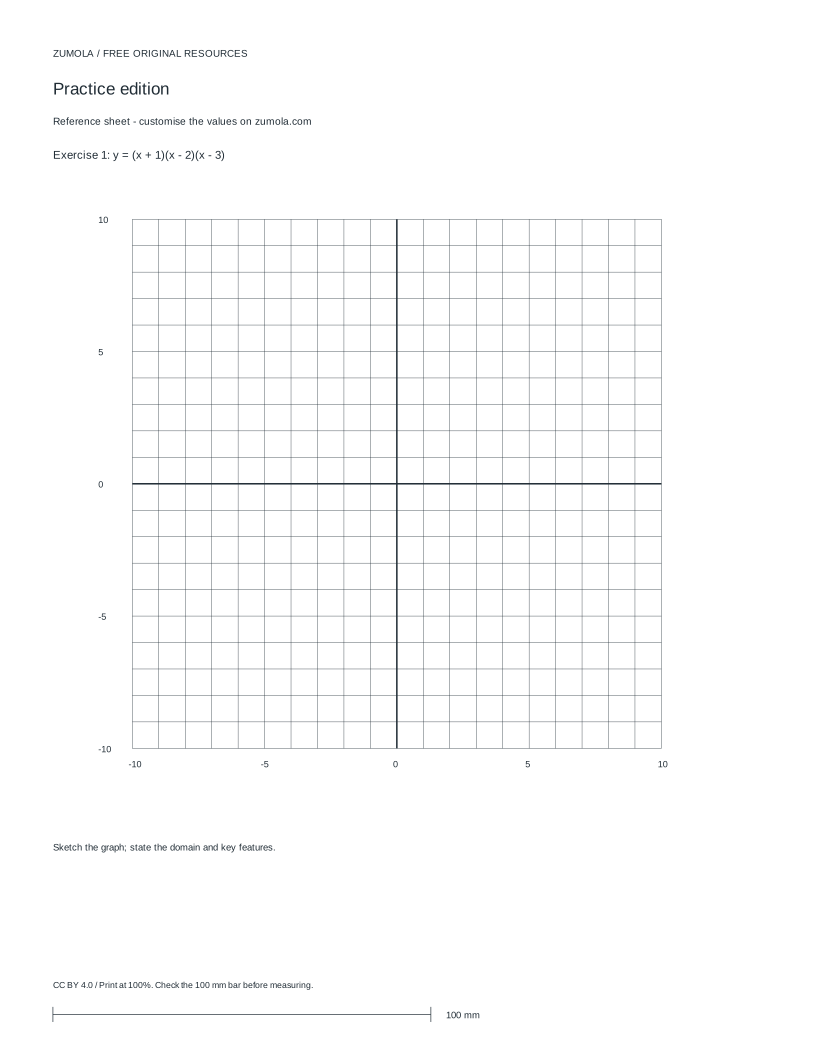
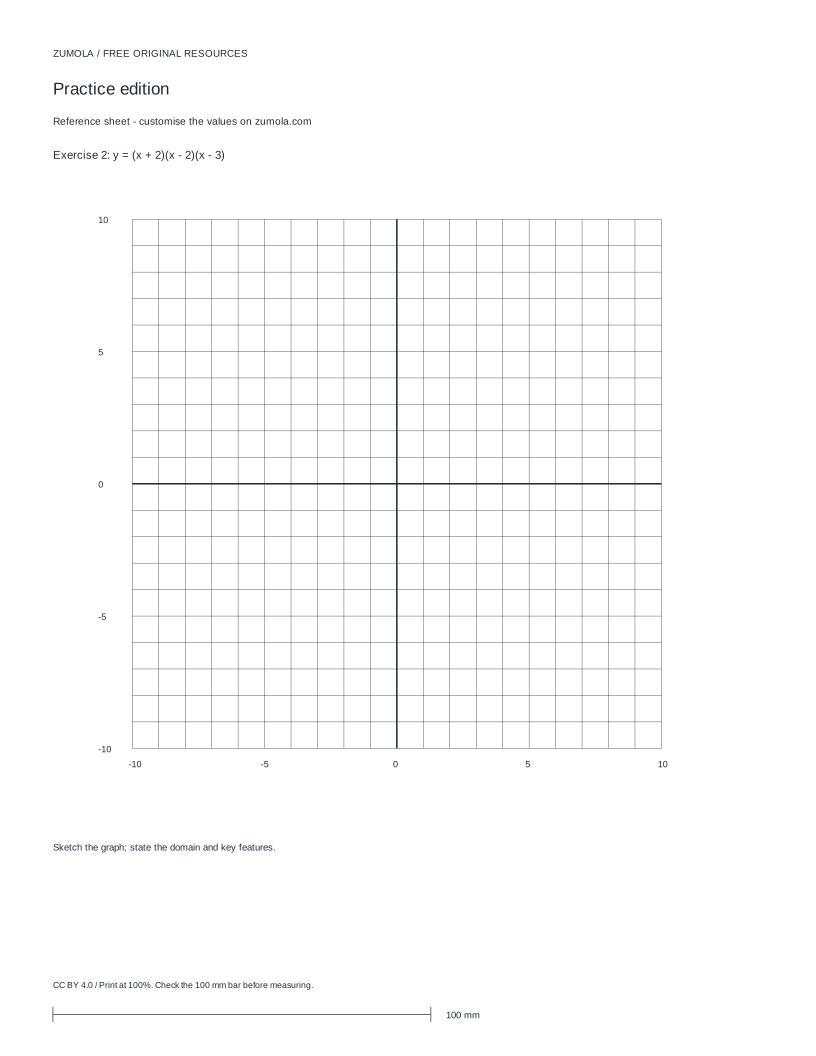
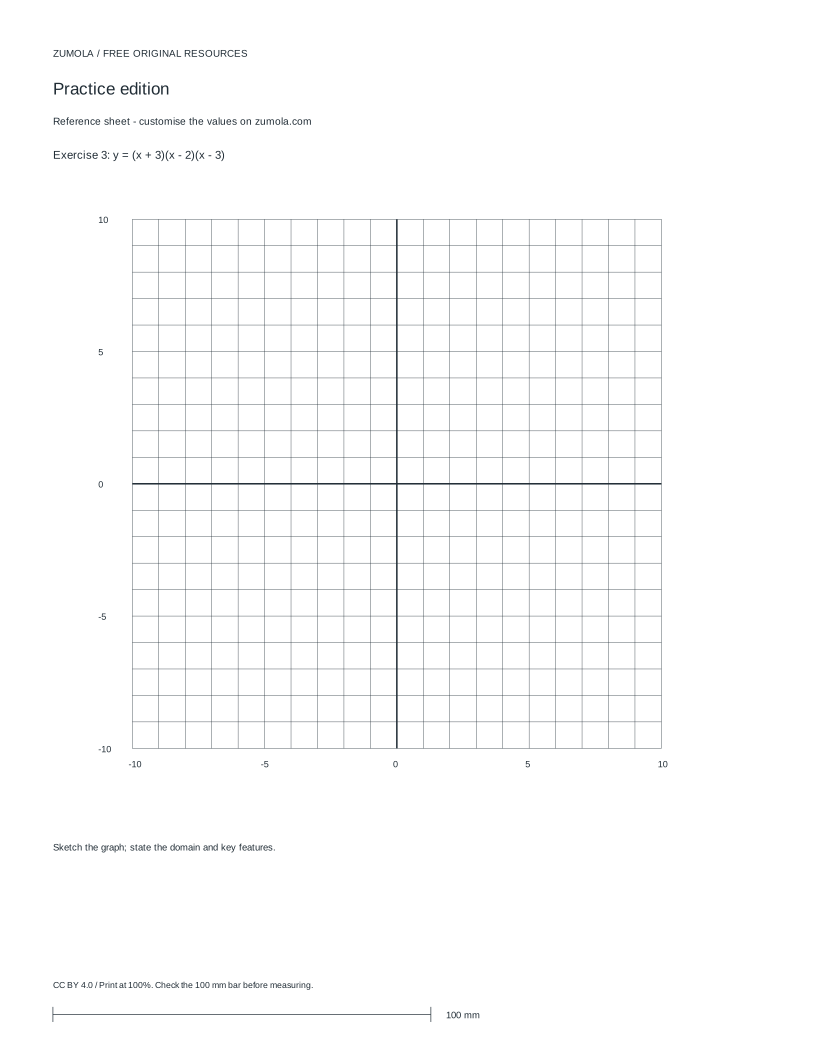
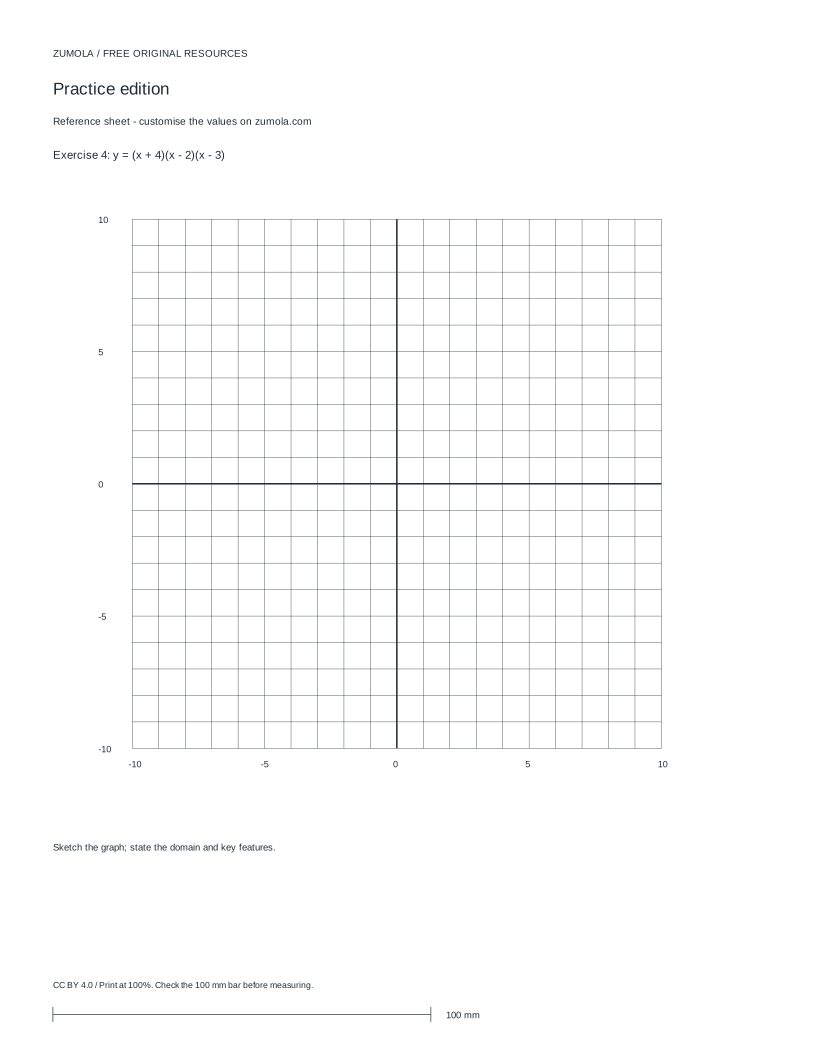
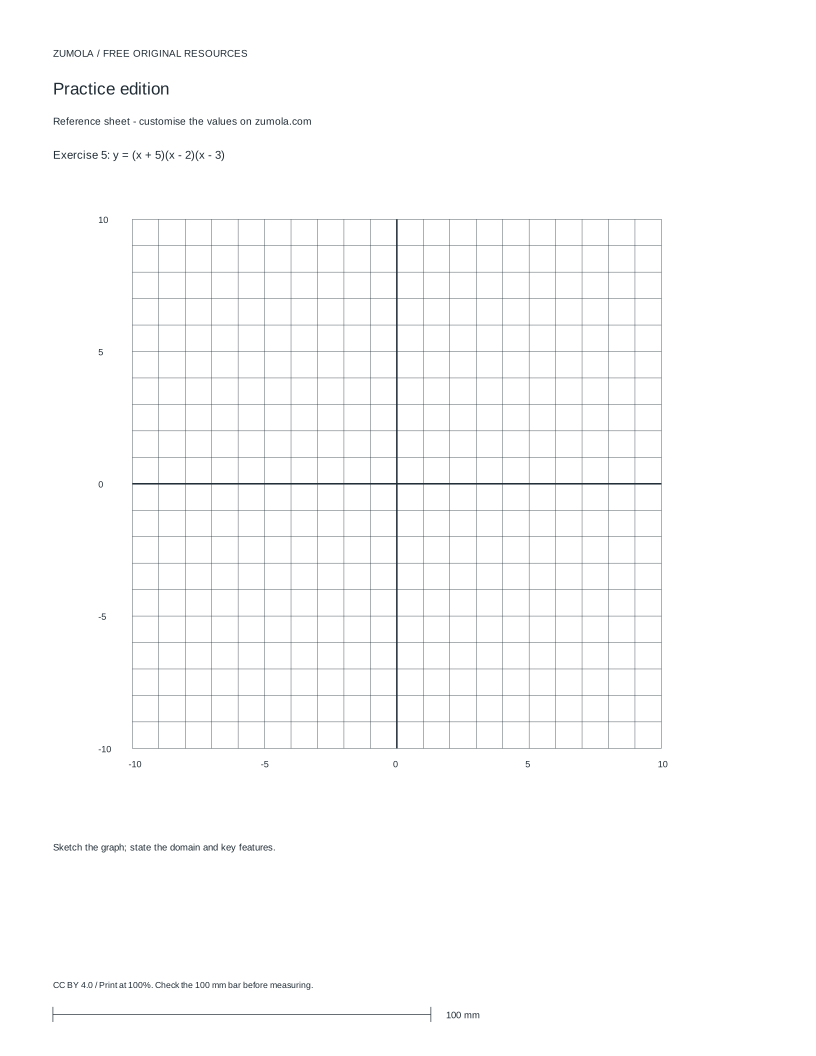
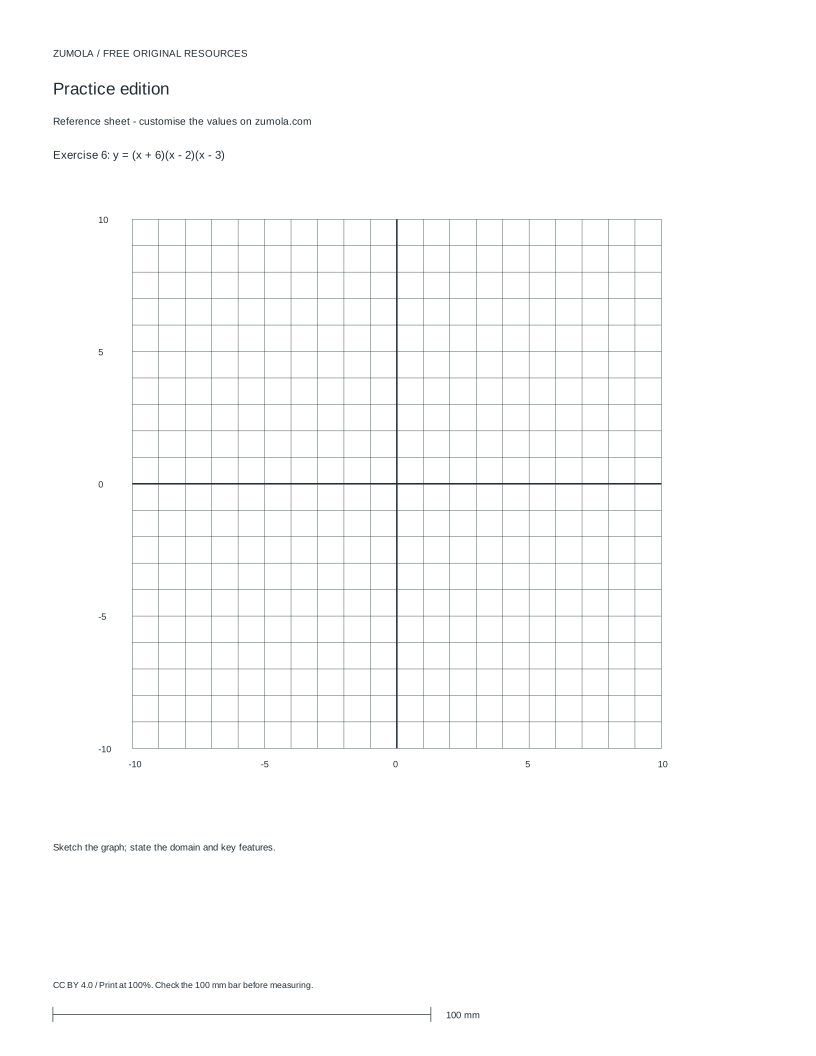
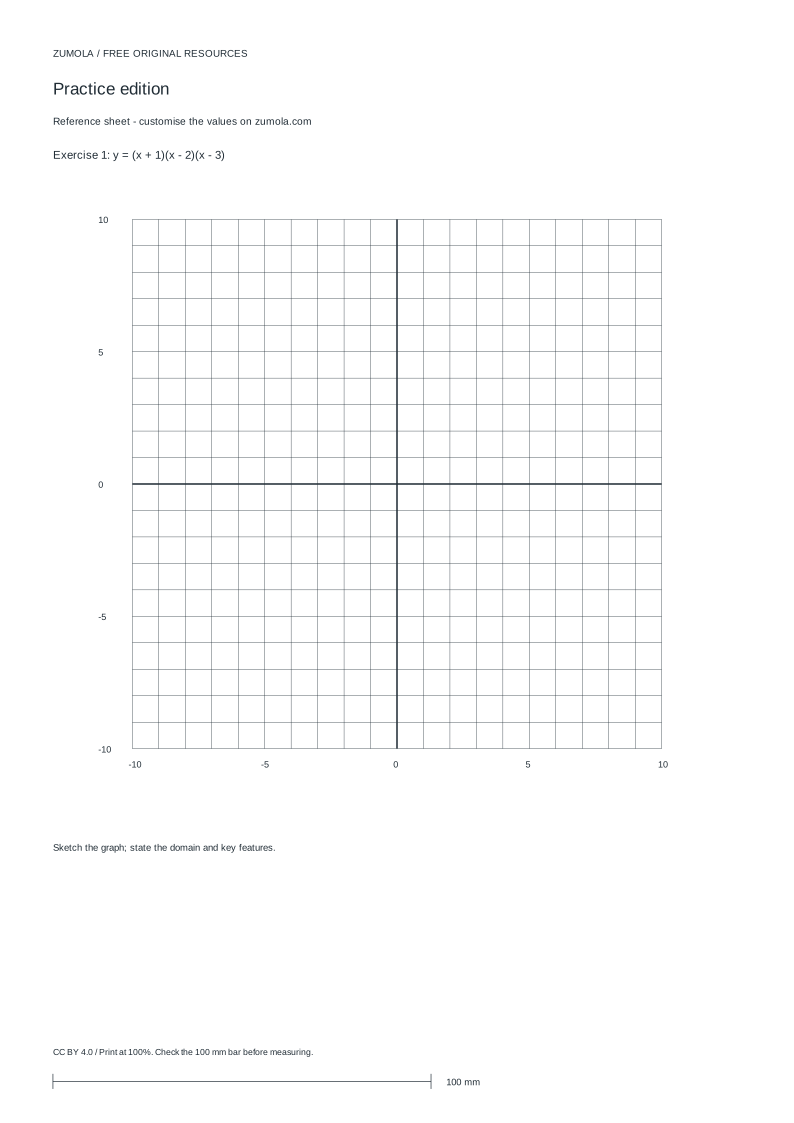
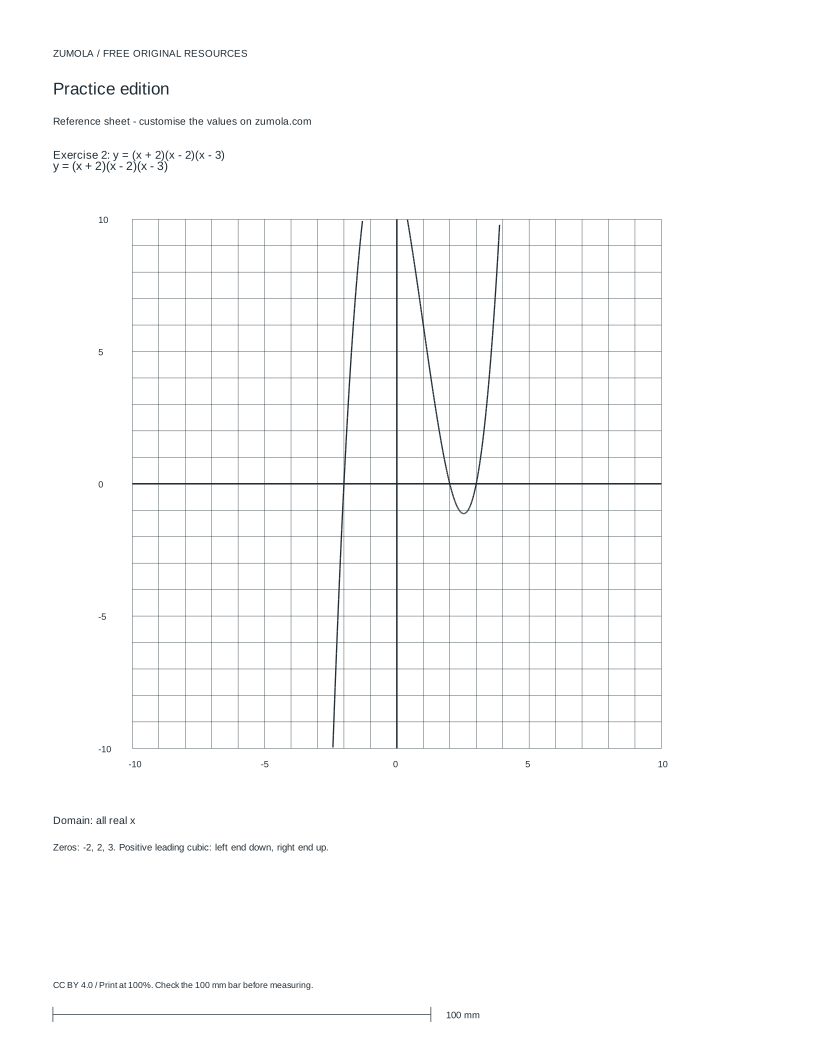
Worked answers / rubric
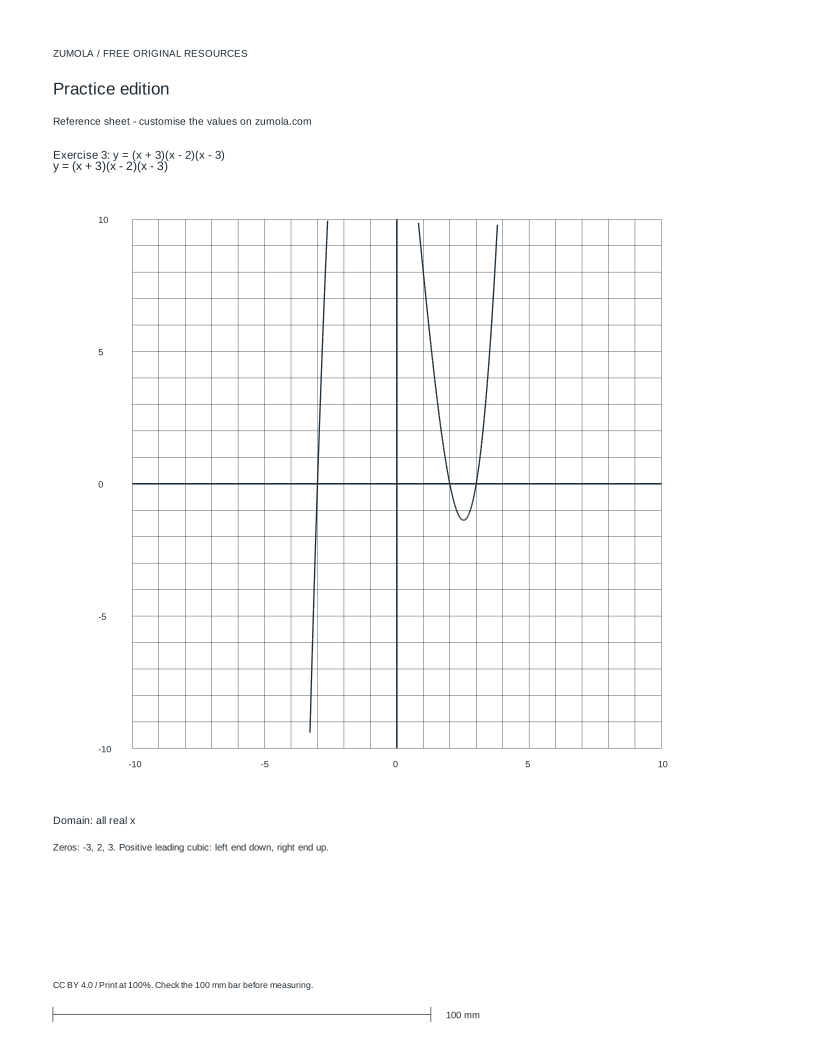
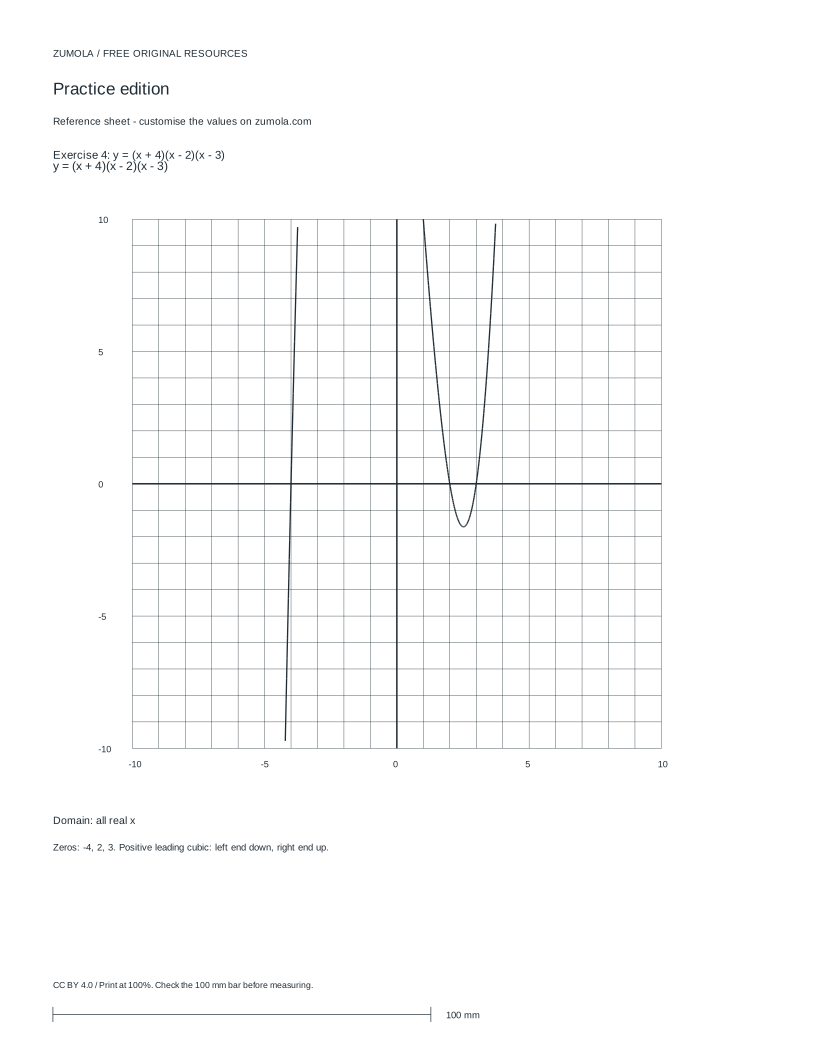
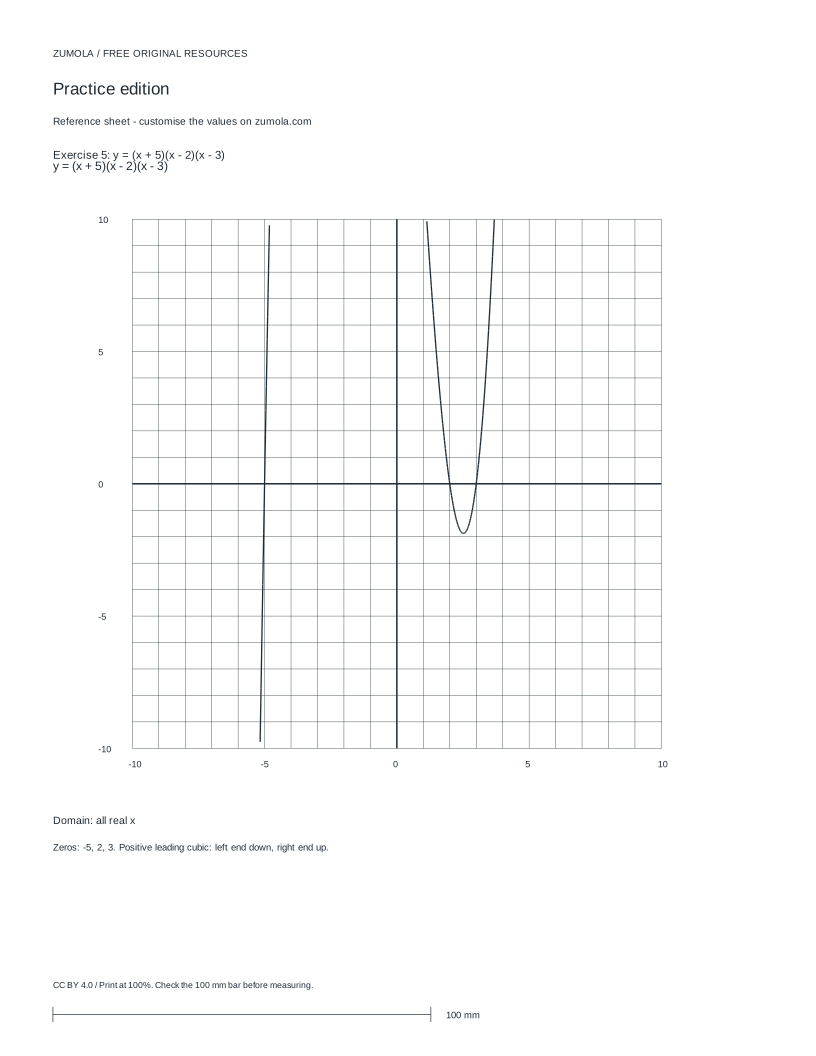
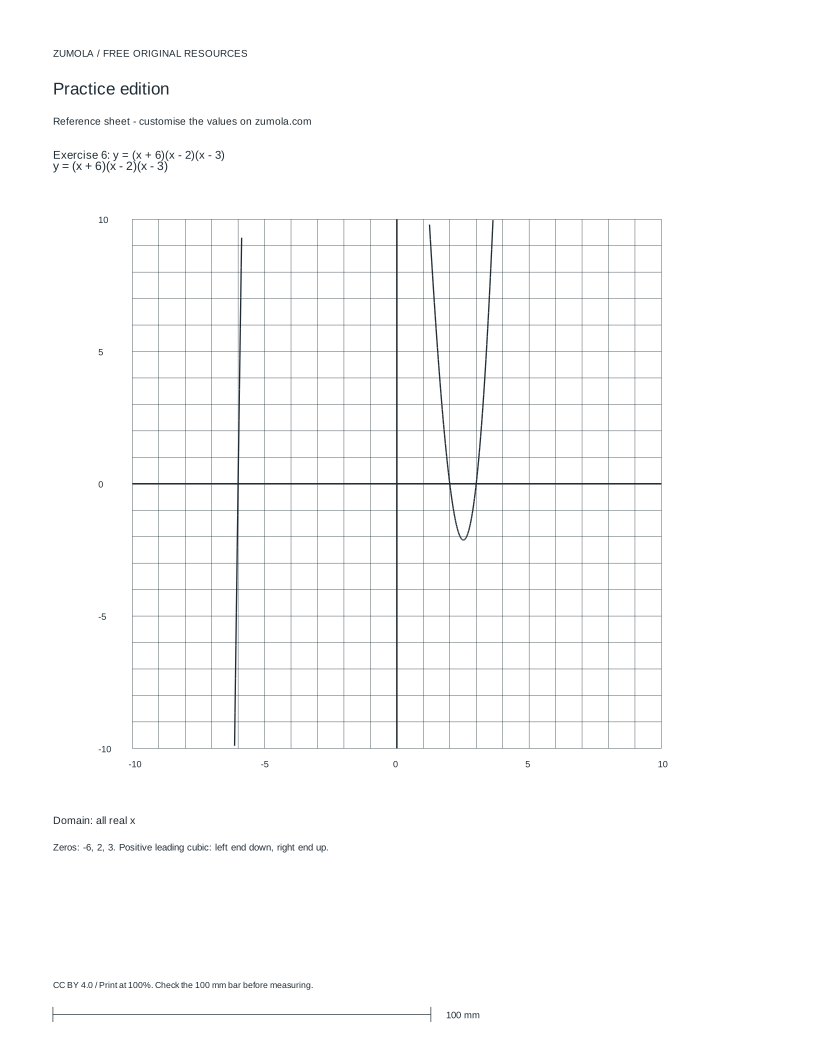
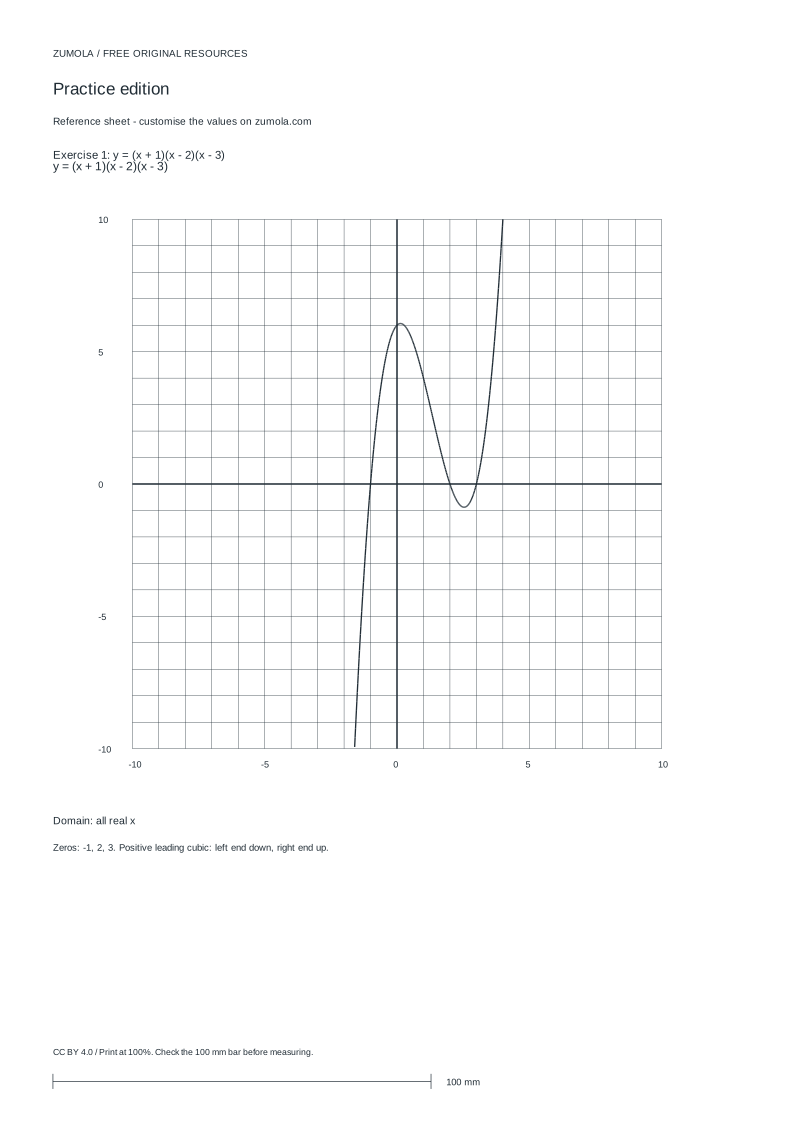
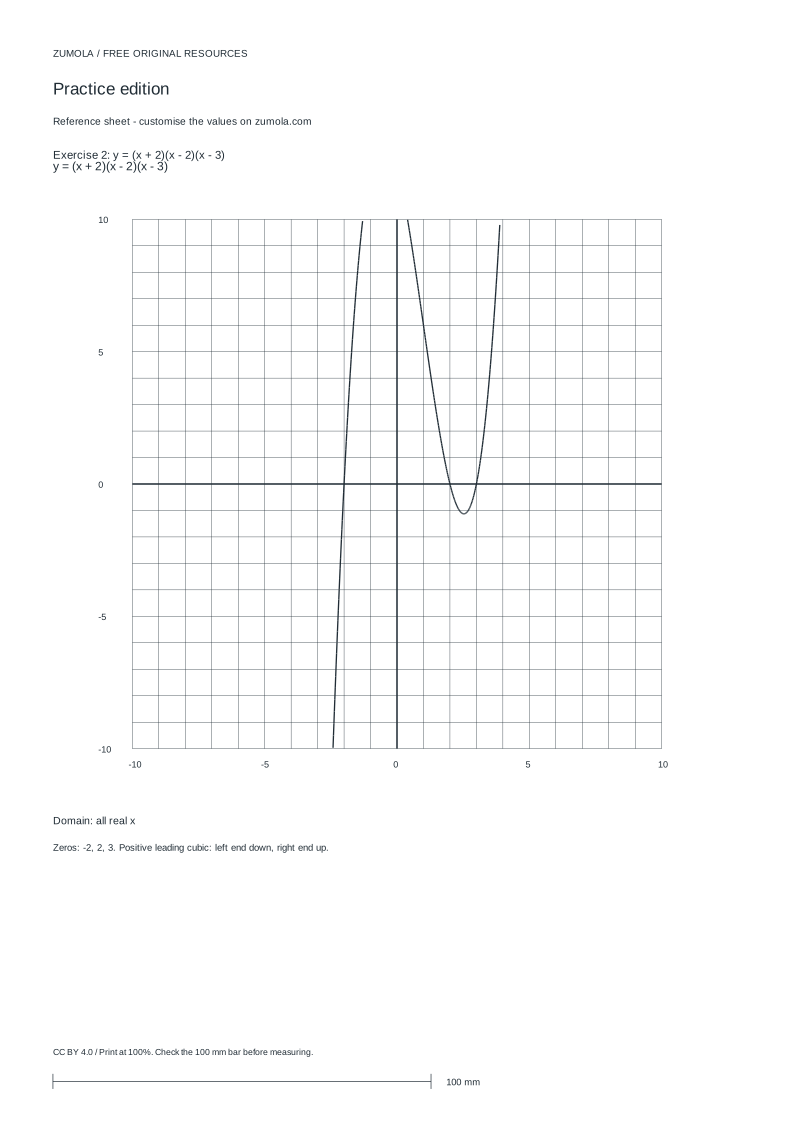
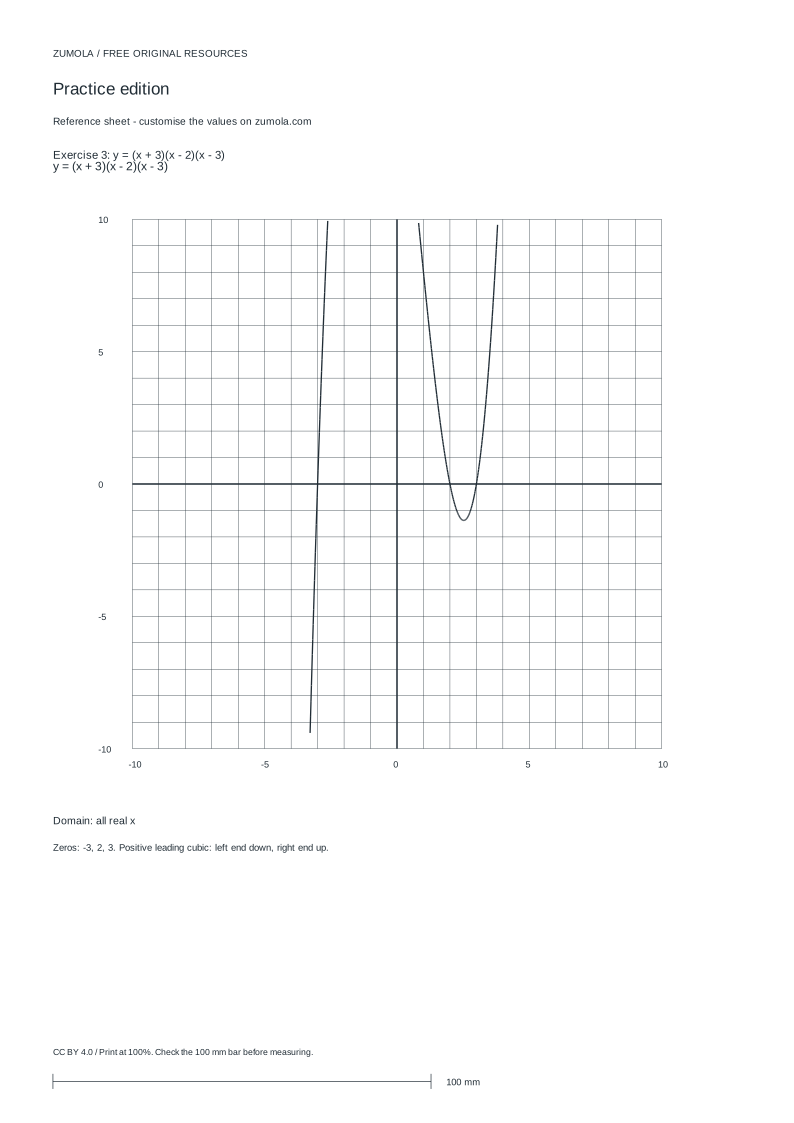
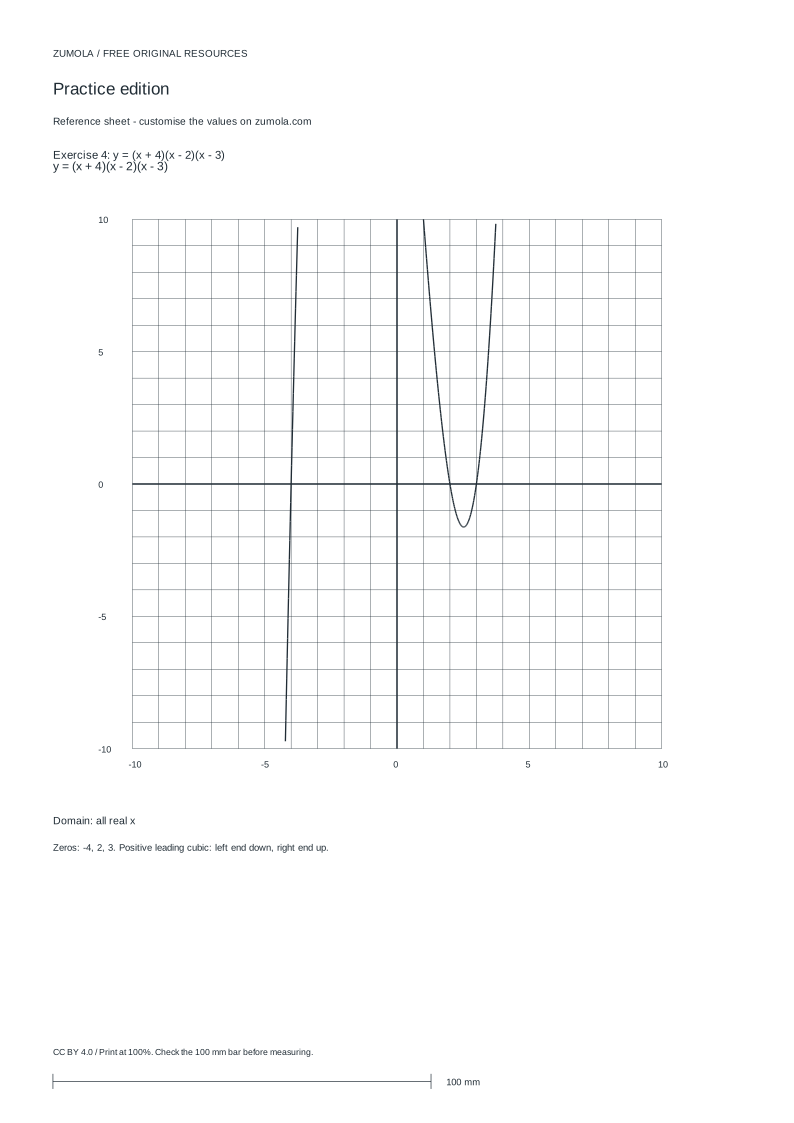
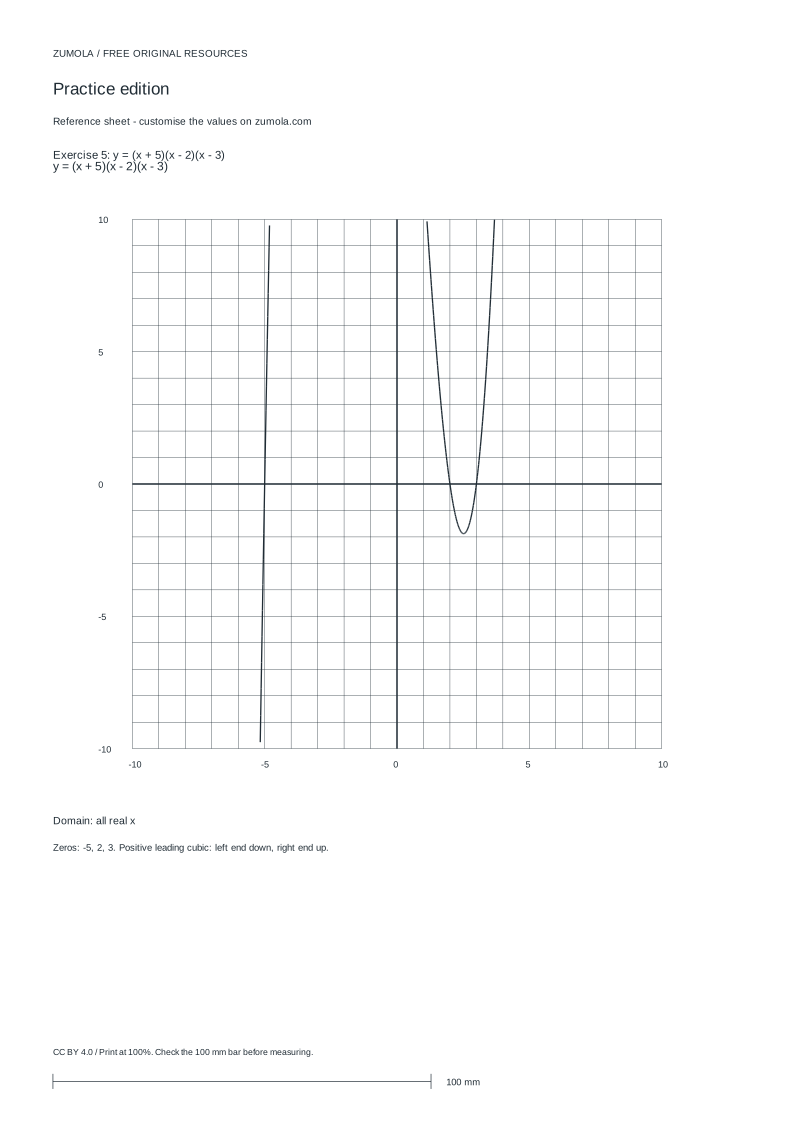
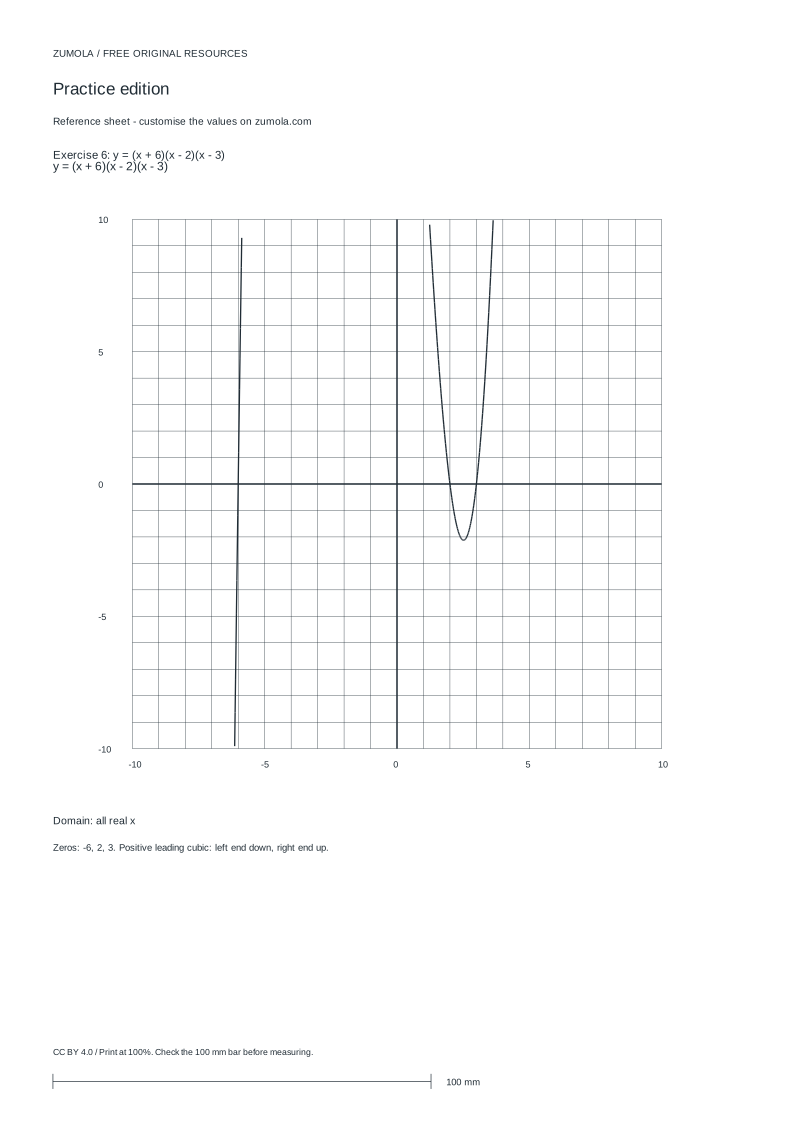
Print at Actual size / 100%. Check the calibration bar before using physical dimensions.
A polynomial graph is built from a few reliable clues. Factored zeros tell you where the curve meets the x-axis. Multiplicity tells you whether it crosses or turns there. The leading term tells you how the ends behave. This page explains how to combine those clues into a coherent sketch, then check it with a test point. The method works for any factored polynomial you can read, and it keeps the drawing honest rather than decorative.
Read the factors before you draw
Start by writing the polynomial in factored form and identifying each real zero. For y = (x + 1)(x - 2)(x - 3), the zeros are x = -1, x = 2, and x = 3, because each factor equals zero at one of those values. Mark these on the x-axis first; they anchor the whole sketch.
Next, note the multiplicity of each zero, meaning how many times its factor appears. A factor appearing once gives multiplicity 1, so the graph crosses the axis at that zero. A factor appearing twice gives multiplicity 2, so the graph touches the axis and turns back. A factor appearing three times gives multiplicity 3, so the graph crosses but flattens as it passes through.
Finally, find the leading term by multiplying the highest power of x from each factor. Its degree and sign determine end behavior. Even degree with a positive coefficient sends both ends up; even degree with a negative coefficient sends both ends down. Odd degree with a positive coefficient sends the left end down and the right end up; odd degree with a negative coefficient reverses that.
- Factor the polynomial completely and list every real zero.
- Record the multiplicity of each zero from its exponent.
- Multiply leading terms to get degree and sign, then state end behavior.
- Plot the zeros on the x-axis and mark crossing or turning behavior.
- Choose one test x-value between zeros, substitute, and plot the resulting point.
- Connect the points smoothly, respecting turns and end behavior.
Connect the clues into one curve
The zeros and end behavior give the skeleton, but the curve between them needs shape. Pick a test point in each interval between consecutive zeros and evaluate the polynomial there. The sign of the result tells you whether the curve is above or below the x-axis in that interval. This prevents a sketch that technically hits the right zeros but wanders on the wrong side.
Keep the curve smooth. Polynomials have no sharp corners, breaks, or vertical asymptotes. If your sketch shows a corner at a zero, the multiplicity note was probably misapplied. A turning point at a double zero should look like a gentle bounce, not a spike.
The y-intercept is another useful check. Substitute x = 0 and plot that point. It should sit on the same side of the axis as your interval test suggests. If it does not, recheck the factored form or the sign of the leading term.
- Evaluate the polynomial at x = 0 to place the y-intercept.
- Test one x-value in each interval between zeros.
- Mark whether each test result is positive or negative.
- Draw a smooth curve through zeros, test points, and intercept.
- Confirm the ends match the leading-term rule.
Check the sketch independently
A finished sketch should be checked by substitution, not by appearance alone. Re-evaluate the polynomial at one zero, one test point, and the y-intercept. Each result should match the plotted location. This catches sign errors that a tidy drawing can hide.
State the domain explicitly. For every polynomial, the domain is all real numbers, so the graph extends without vertical asymptotes or holes. If your sketch includes either, something has been confused with a rational function.
Remember that a sketch is a representation, not a proof. The rubric below judges whether the drawing reflects the algebraic clues, not whether it matches a single exact curve.
- Substitute each zero back into the factored form and confirm it gives zero.
- Recompute one test point and compare with the plotted height.
- Check the y-intercept against x = 0.
- Confirm no asymptotes or holes appear in the sketch.
- Verify end directions against degree and leading sign.
Worked example
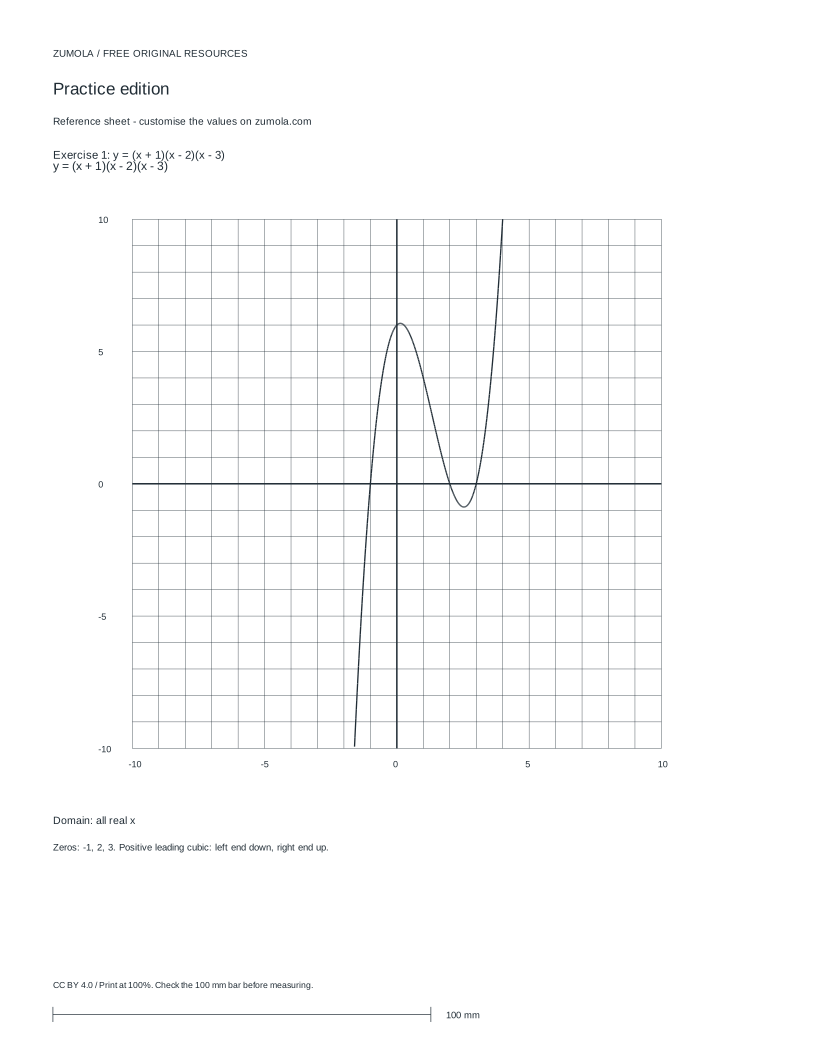
Use y = (x + 1)(x - 2)(x - 3) to practise the full method. Each factor appears once, so all three zeros have multiplicity 1 and the graph crosses at each. The leading term is x cubed, an odd degree with a positive coefficient, so the left end goes down and the right end goes up.
The y-intercept comes from x = 0: (1)(-2)(-3) = 6, so the point (0, 6) lies on the graph. A test point between -1 and 2, say x = 0, already gives 6, which is positive. A test point between 2 and 3, say x = 2.5, gives (3.5)(0.5)(-0.5) = -0.875, which is negative, so the curve dips below the axis there.
Sketching: start low on the left, rise through x = -1, peak above the axis, cross downward at x = 2, dip below, then cross upward at x = 3 and continue rising. The y-intercept at (0, 6) fits the positive interval between -1 and 2.
- List zeros: -1, 2, 3, each multiplicity 1.
- State end behavior: left down, right up.
- Compute y-intercept: (0, 6).
- Test x = 2.5: result -0.875, below the axis.
- Draw a smooth curve matching all five checks.
Common mistakes and fixes
Most errors come from skipping a check rather than from drawing badly. The fixes below are quick substitutions you can do before finishing.
- If a zero looks like a corner, recheck its multiplicity.
- If the y-intercept disagrees with a test interval, recheck signs.
- If an asymptote appears, remember polynomials have domain all real numbers.
Frequently asked questions
These answers address the points students most often ask when sketching from factors.
- Use multiplicity to decide crossing or turning.
- Use the leading term for end behavior.
- Use substitution to verify any plotted point.
Try this example
Sketch y = (x + 1)(x - 2)(x - 3) using zeros, multiplicity, end behavior, and one test point.
Show the worked explanation
Zeros are -1, 2, and 3, each multiplicity 1, so the curve crosses at all three. The leading term is x cubed, odd and positive, so the left end goes down and the right end goes up. The y-intercept is (0, 6). Testing x = 2.5 gives (3.5)(0.5)(-0.5) = -0.875, so the curve is below the axis between 2 and 3. The sketch rises through -1, crosses down at 2, dips below, then crosses up at 3 and continues rising.
Common mistakes
- Drawing a sharp corner at a zero with multiplicity 2. Make the curve touch the axis and turn back smoothly; a double zero produces a bounce, not a spike.
- Guessing end behavior from the number of zeros instead of the leading term. Multiply the highest power of x in each factor, then use its degree and sign to set both ends.
- Placing the y-intercept without checking it against an interval test point. Substitute x = 0 and one interior x-value; both should agree on which side of the axis the curve lies.
Check your work
- All real zeros are plotted at correct x-values.
- Each zero is marked as crossing or turning according to its multiplicity.
- End behavior matches the degree and sign of the leading term.
- The y-intercept is computed and plotted correctly.
- At least one test point per interval confirms the curve's side of the axis.
- The curve is smooth with no corners, breaks, asymptotes, or holes.
Questions before you start
How do I know whether the graph crosses or touches at a zero?
Check the multiplicity. Odd multiplicity crosses the axis; even multiplicity touches and turns back. Multiplicity 1 is the simplest crossing case.
What is the domain of a polynomial graph?
All real numbers. Polynomials have no vertical asymptotes, holes, or restricted inputs, so the curve extends across the whole x-axis.
Do I need exact heights between zeros?
No. Plot the zeros, the y-intercept, and one test point per interval, then draw a smooth curve. The rubric judges whether the sketch reflects the algebraic clues.