Free graphing resources · Original practice
Graphing slope-intercept form.
Build a line from its rule.
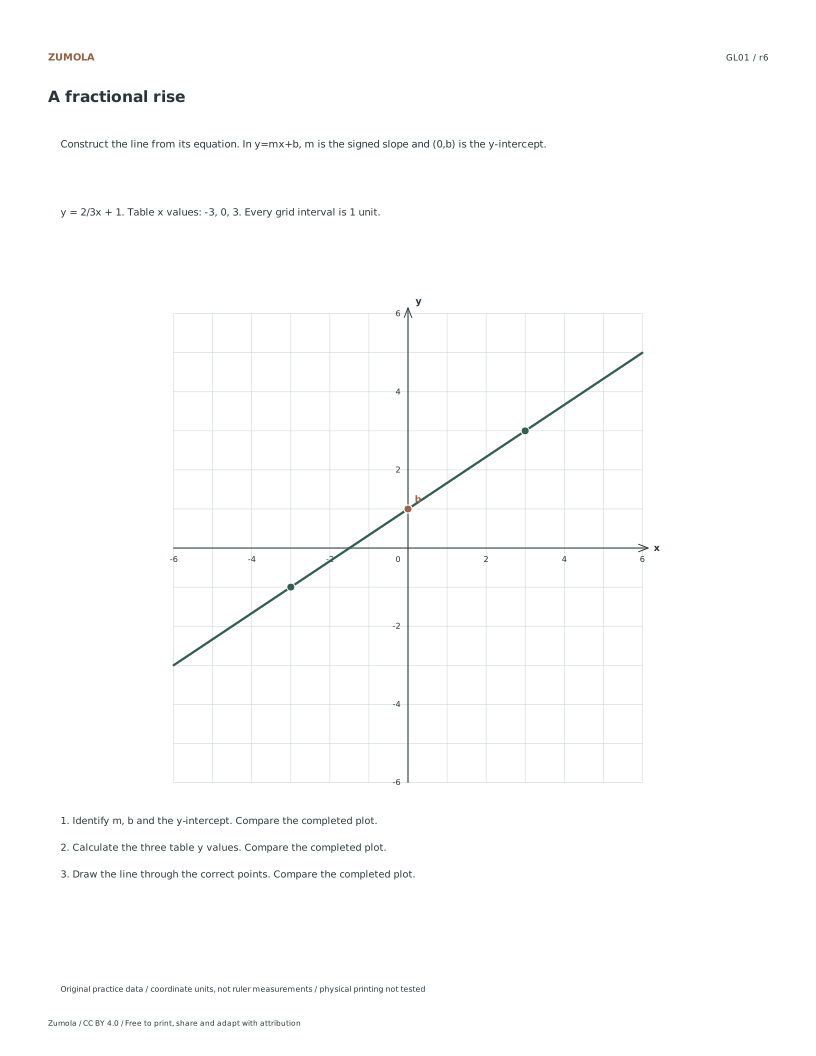
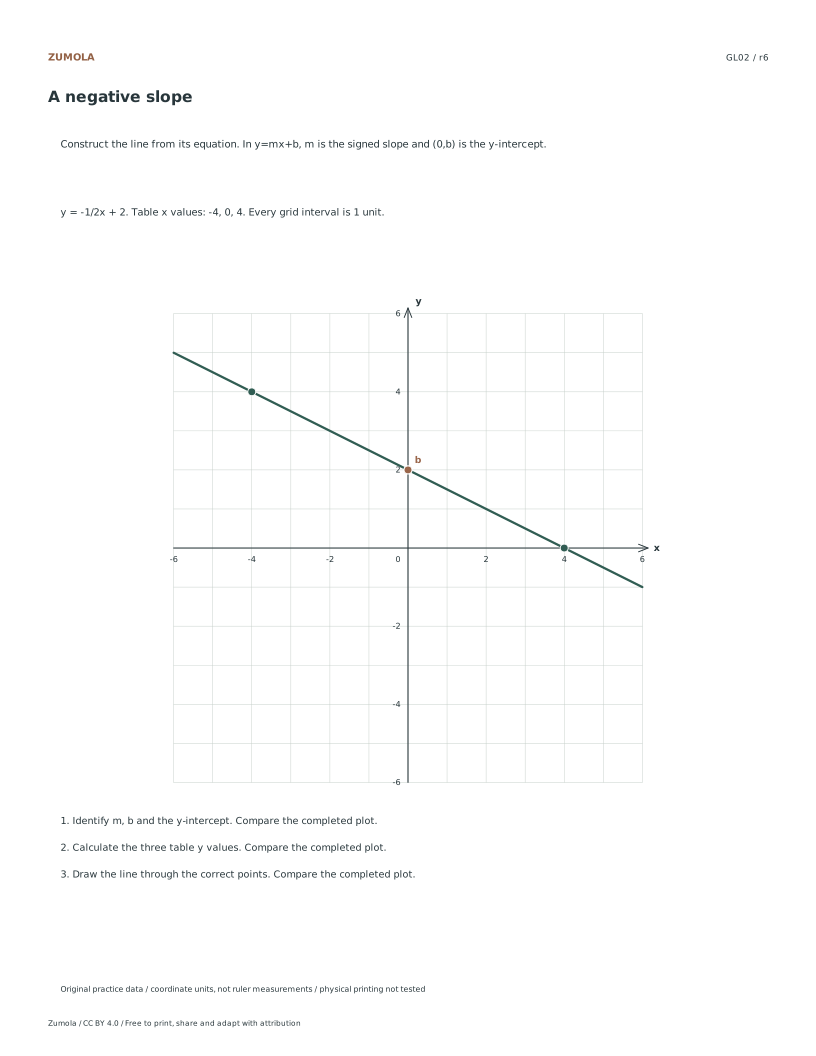
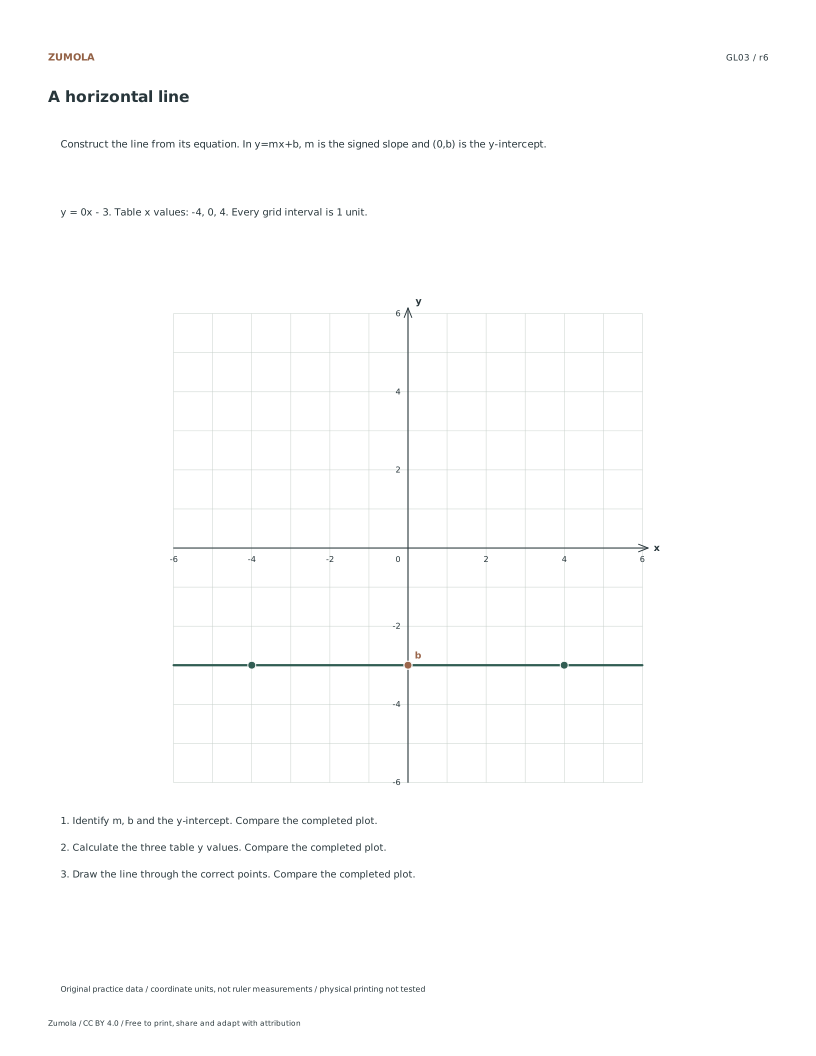
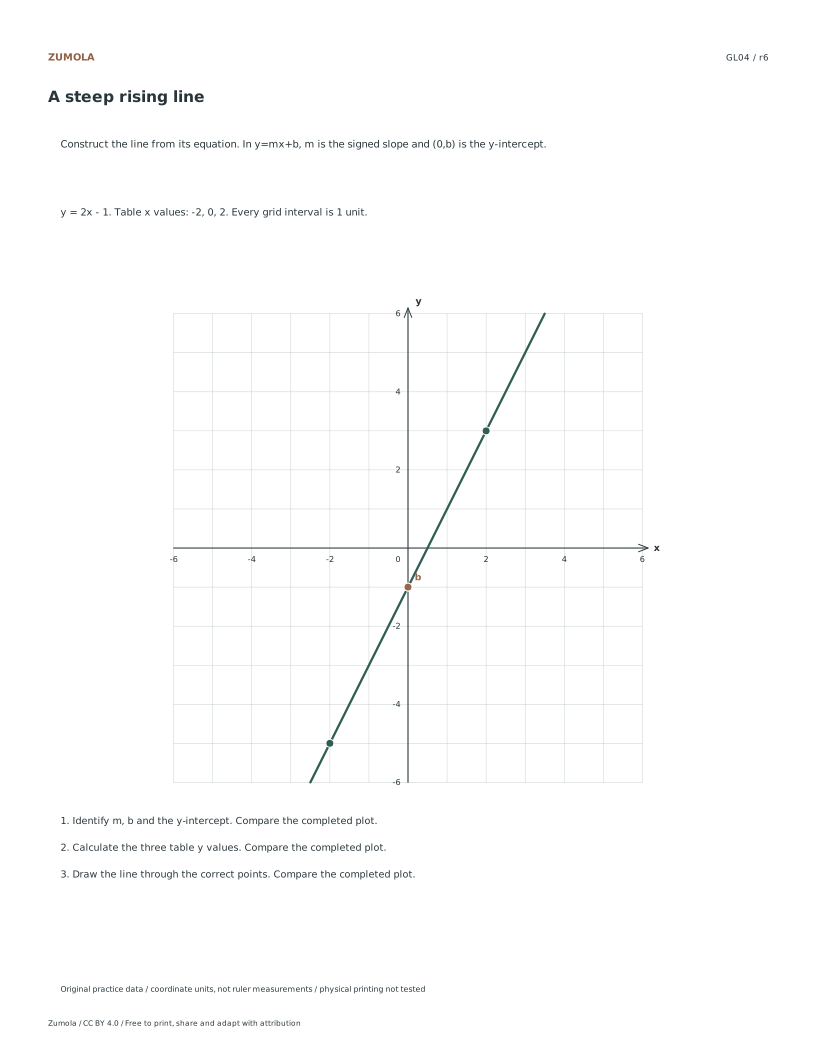
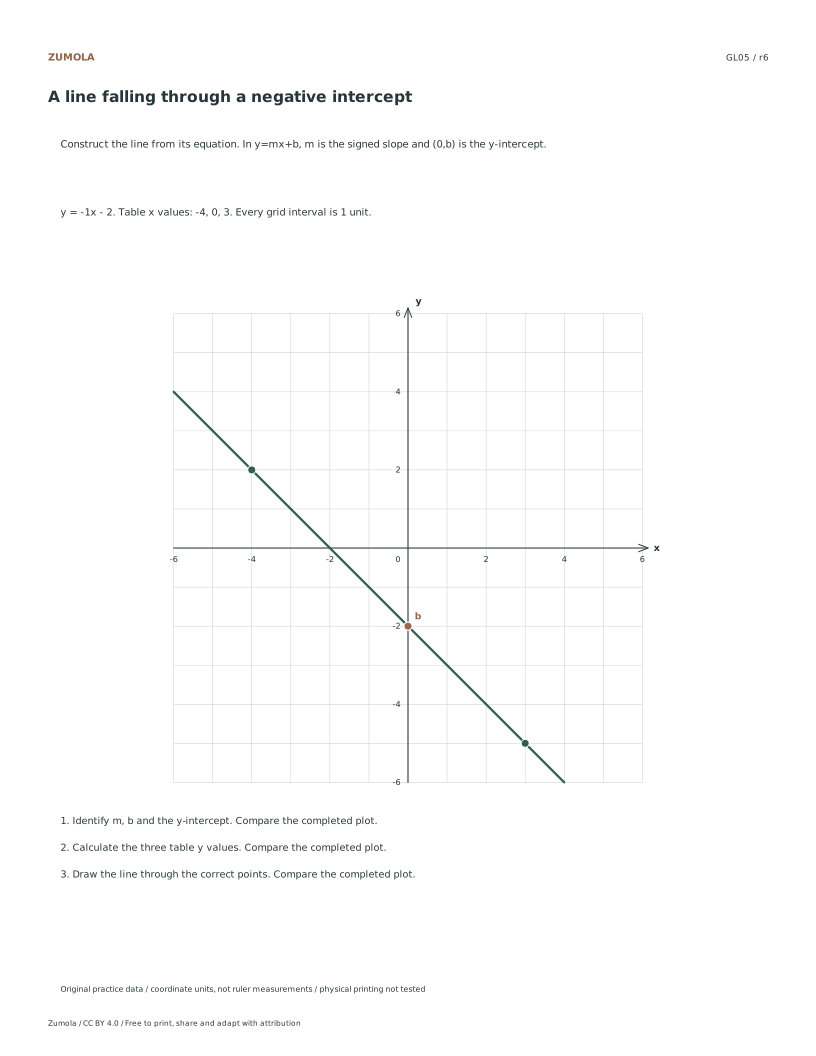
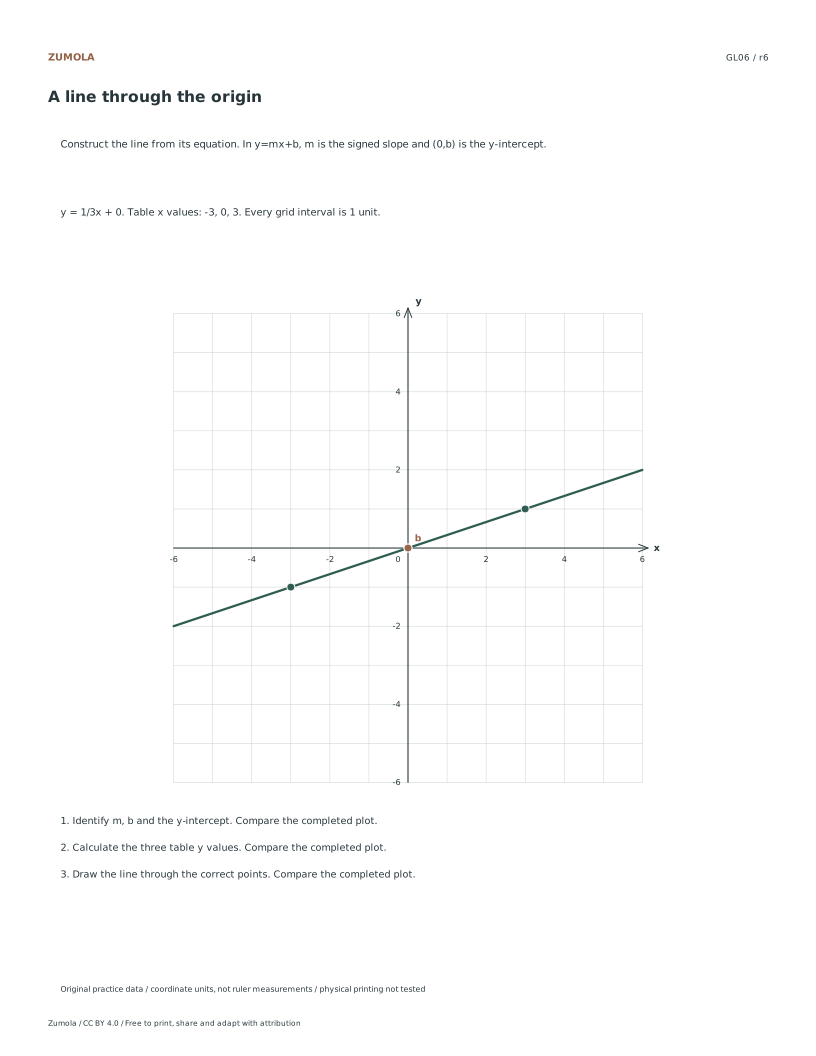
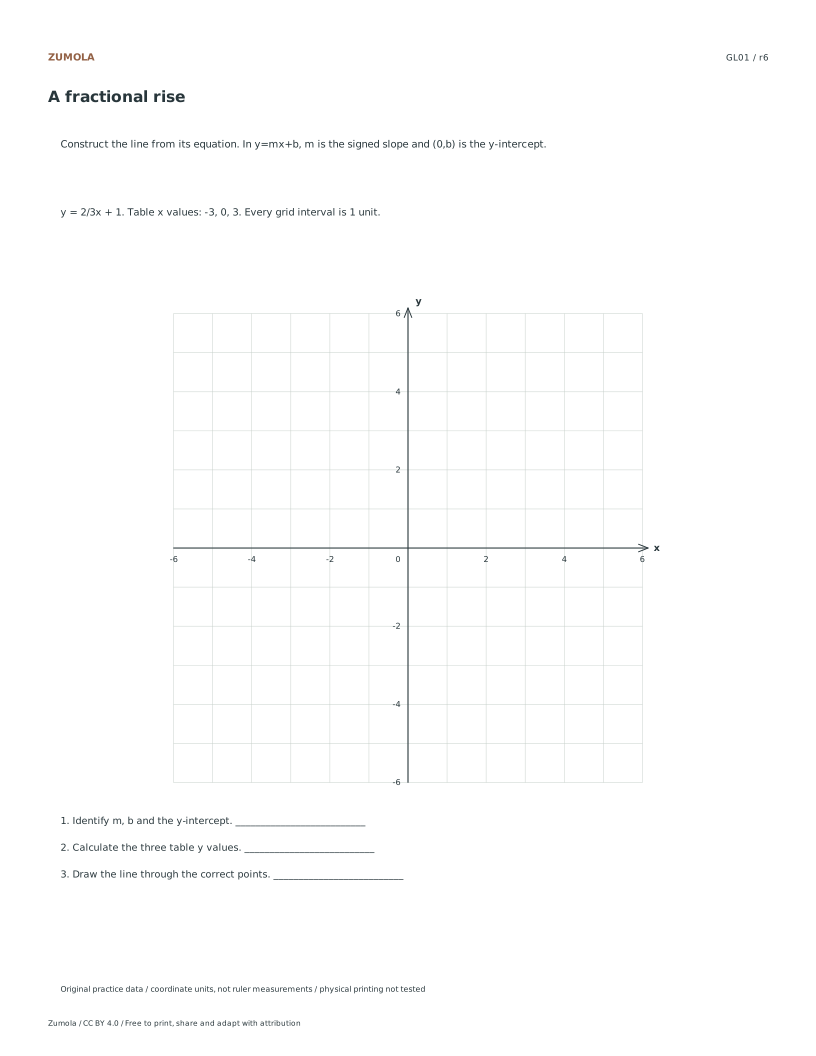
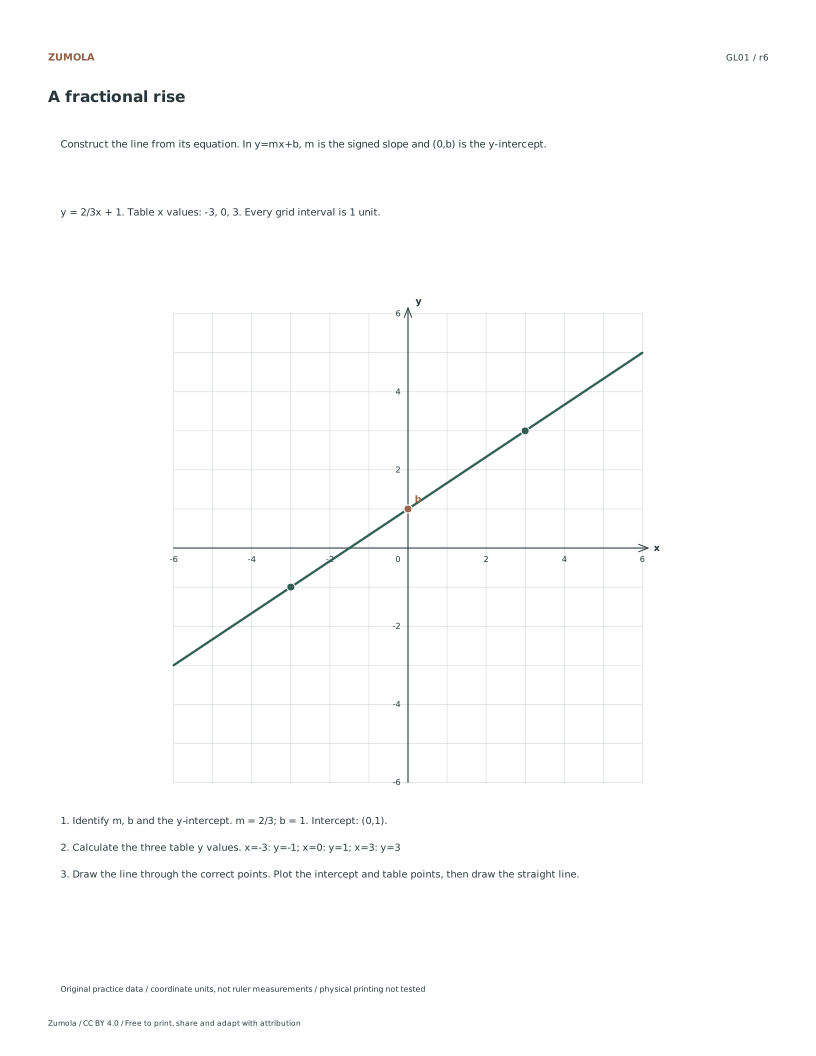
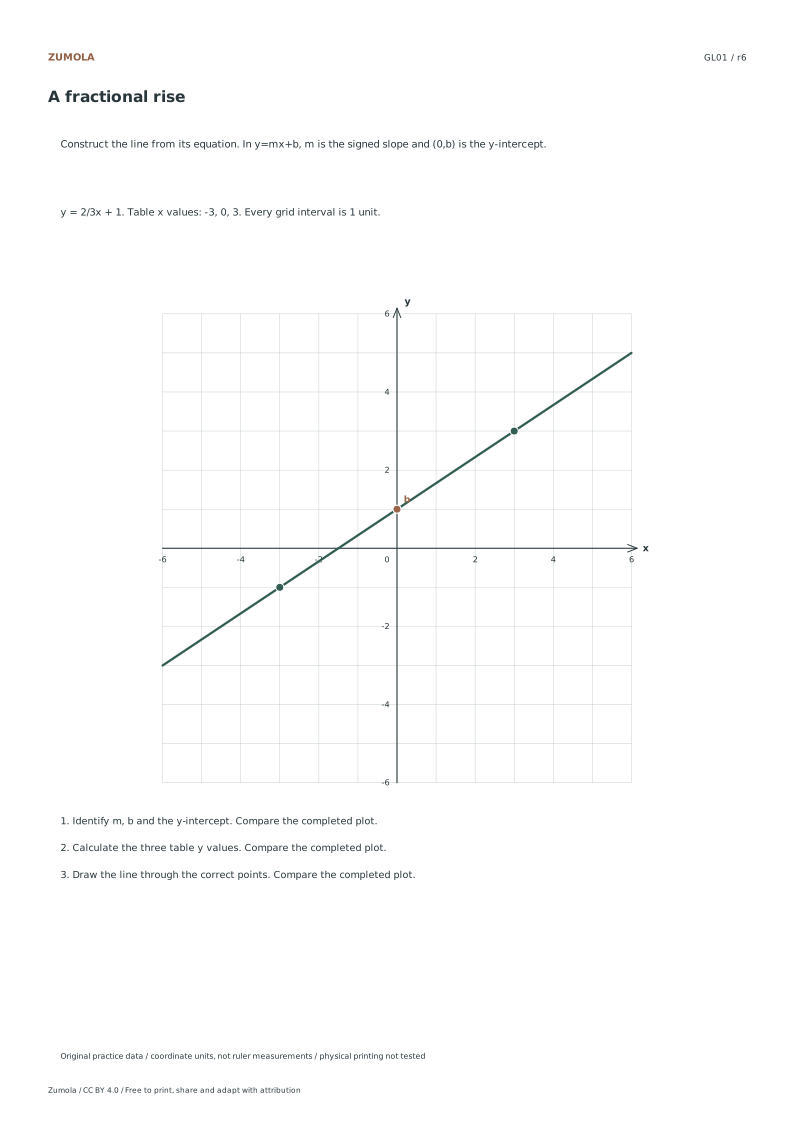
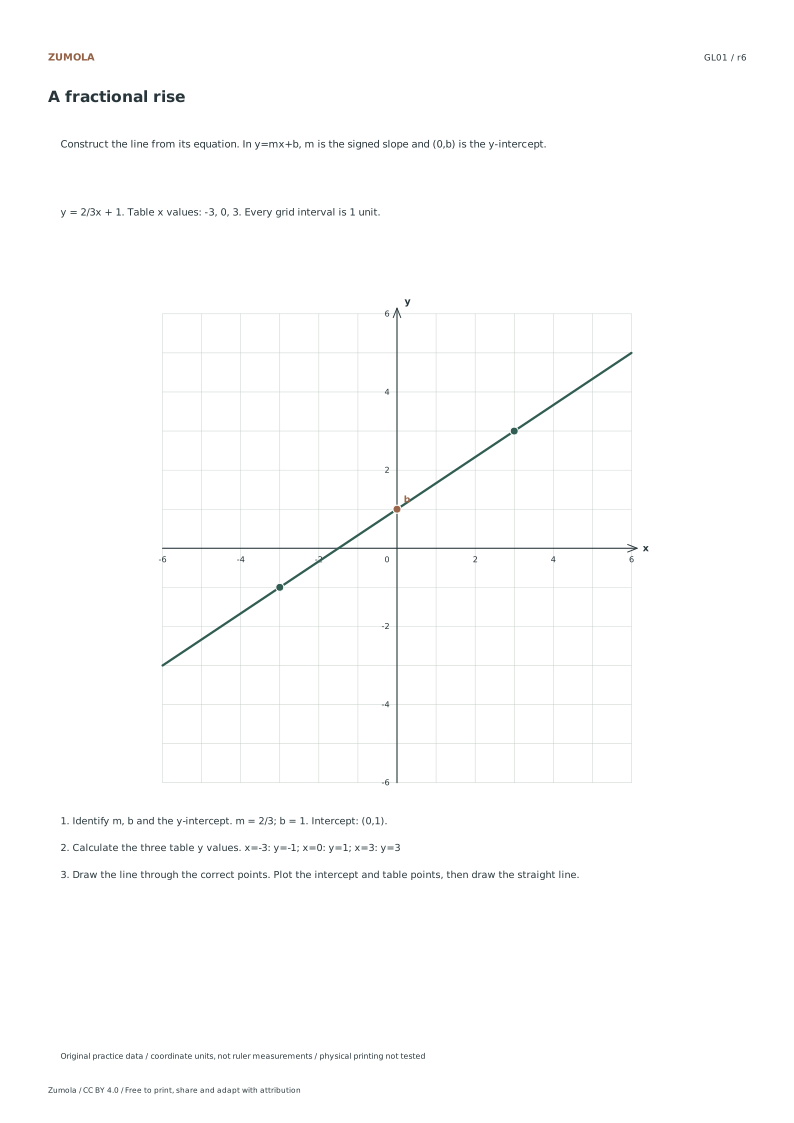
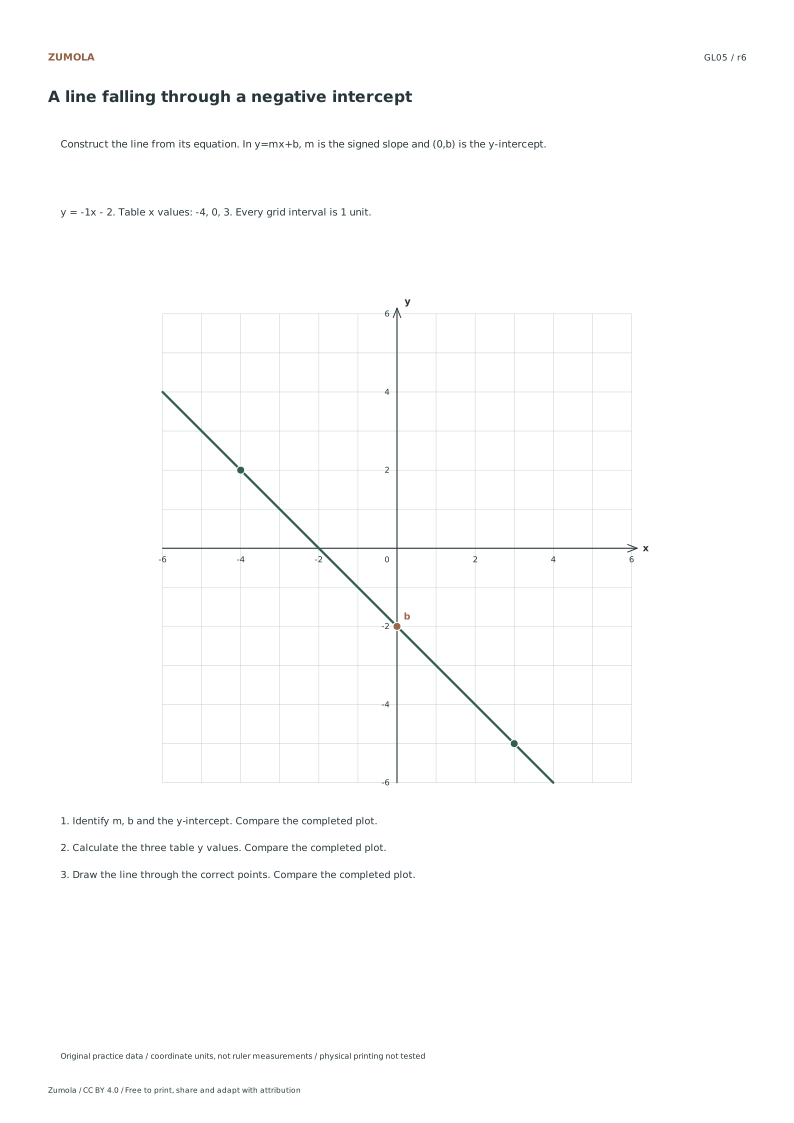
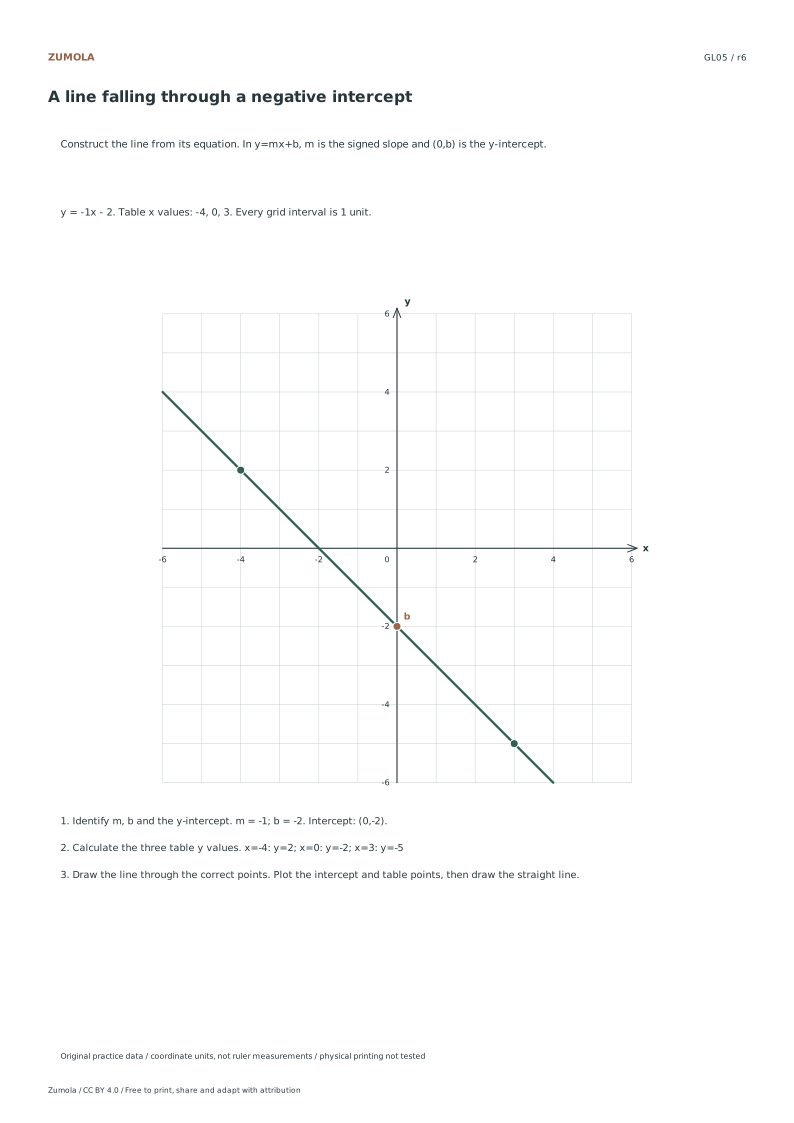
Turn six equations in y=mx+b into coordinate tables and straight-line graphs. Locate the intercept, use the slope and verify another point before extending your line.
6 line-construction cases.
Tables + intercepts + answers.
More ways to practice
A new case: negative slope with a fractional run
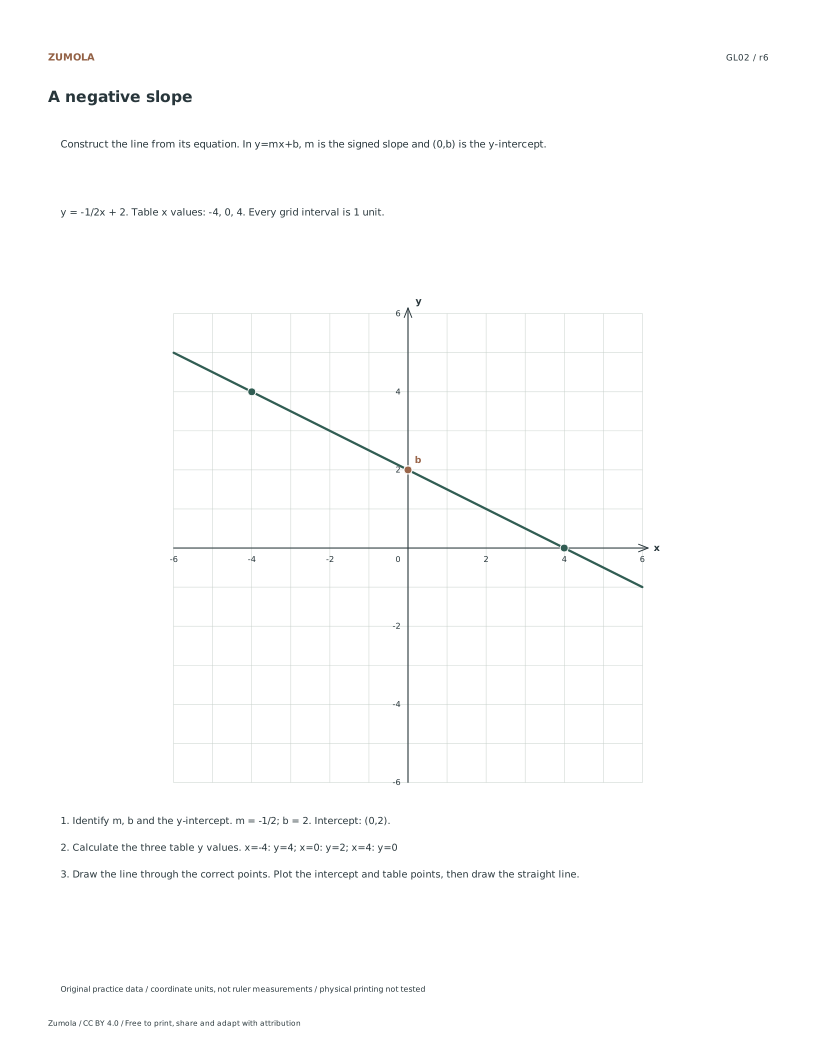
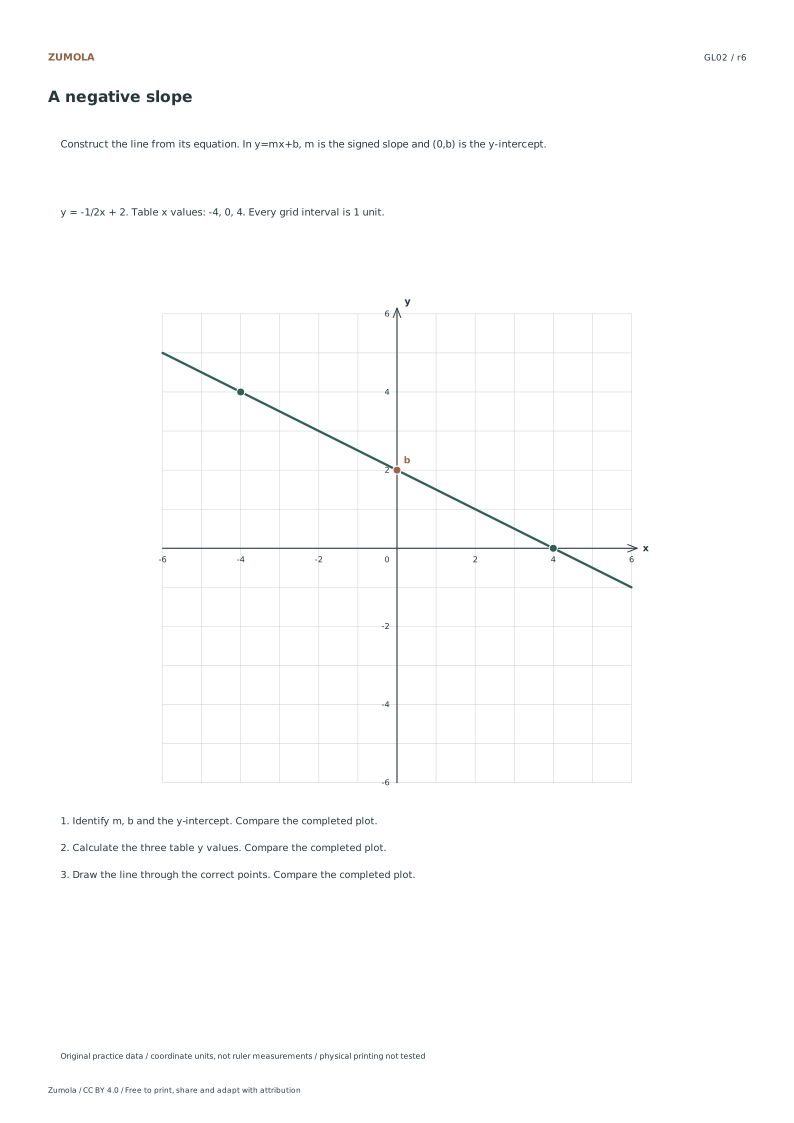
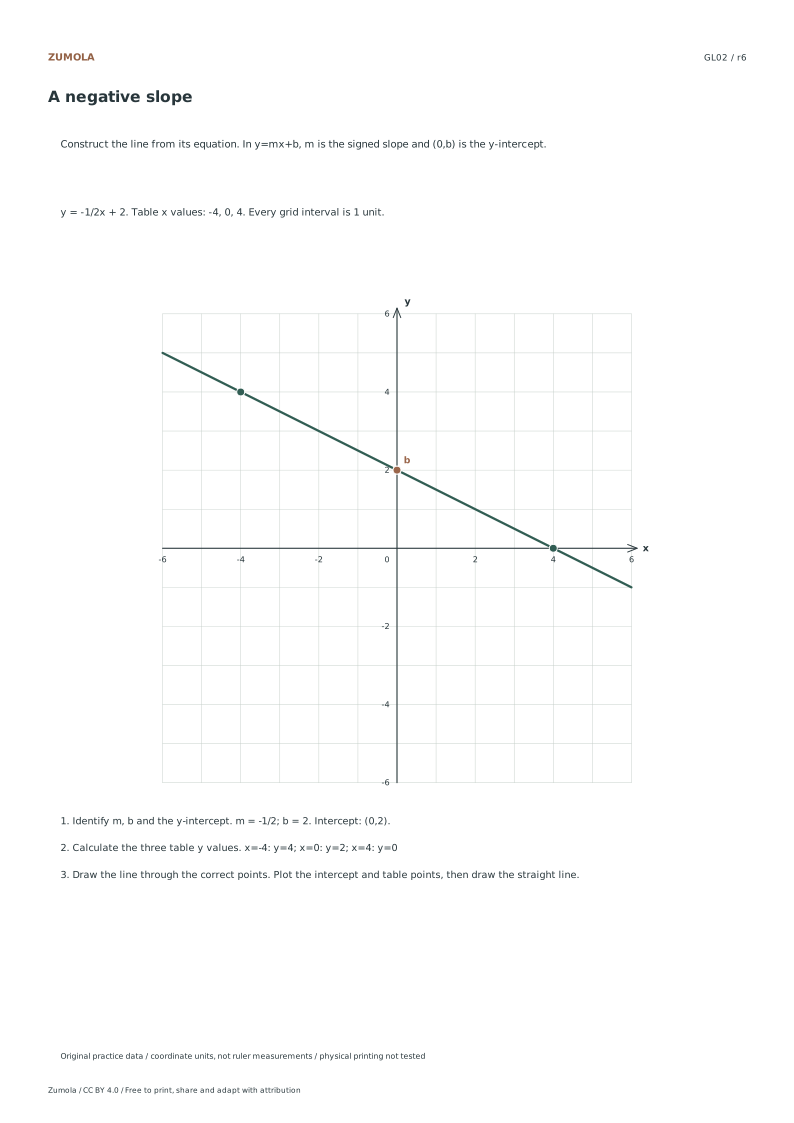
Consider y = -3/4 x + 2. The intercept is (0, 2) because b = 2. The slope is -3/4, so from the intercept move down 3 units and right 4 units to reach (4, -1). Verify by substitution: -3/4 times 4 is -3, and -3 + 2 = -1, which matches the plotted point.
A second verification point helps confirm the line is straight. From (4, -1), apply the slope again: down 3 and right 4 gives (8, -4). Substituting x = 8 gives -3/4 times 8 = -6, and -6 + 2 = -4. Three collinear points make a stronger check than two.
Because the run is 4, the grid must have at least four horizontal units to the right of the intercept before the next integer point appears. If your grid is small, plot the intercept and one verified point, then extend carefully with a straightedge rather than guessing intermediate positions.
- Write the equation and label m and b separately.
- Plot the intercept at (0, b) and mark it clearly.
- Apply the rise and run from the intercept to find one more integer point.
- Substitute that point's x-value into the equation to confirm its y-value.
- Repeat once more to obtain a third collinear point.
- Place a straightedge through all three points before drawing the full line.
Diagnostic checks before you extend the line
Check the sign of the slope against the visual direction. A negative slope must fall from left to right; a positive slope must rise. If your drawn line disagrees with the sign of m, the error is usually in the rise direction rather than the arithmetic.
Check the intercept independently. Substitute x = 0 into the equation and confirm the result equals b. Then look at the graph: does the line cross the vertical axis at that value? A line that crosses elsewhere means the intercept was plotted at the wrong height or the slope was applied from the wrong starting point.
Check a point far from the intercept. Errors in the run accumulate slowly near the intercept but become obvious farther away. Choose an x-value several units from zero, compute y, and compare with the graph. If the plotted line misses that point, recheck the slope fraction before redrawing.
- Confirm the sign of the slope matches the line's direction.
- Substitute x = 0 and compare with the plotted intercept.
- Test one point close to the intercept and one farther away.
- If any check fails, recompute the slope from two plotted points rather than adjusting the line by eye.
Adapting the case to different grids
The same equation can be plotted on grids with different scales. On a grid where each square represents 1 unit, the run of 4 spans four squares. On a grid where each square represents 2 units, the same run spans two squares, but the labels must reflect the scale. Always state the scale before plotting so the slope's visual steepness is interpreted correctly.
If the grid is too small for a run of 4, choose a different verified point by working backward: from the intercept, move up 3 and left 4 to reach (-4, 5). Substituting x = -4 gives -3/4 times -4 = 3, and 3 + 2 = 5. This keeps the line within the grid without changing the equation.
When the slope is fractional, integer points occur only at multiples of the run. Mark those points first, then connect them. Avoid placing points at fractional x-values unless the grid explicitly supports them, because misreading a half-square position is a common source of slope errors.
- State the grid scale in units per square before plotting.
- If space is limited, apply the slope backward from the intercept.
- Mark integer points at multiples of the run, then connect with a straightedge.
Try this example
Graph y = -3/4 x + 2 on a grid scaled 1 unit per square, and verify two points beyond the intercept.
Show the worked explanation
The intercept is (0, 2). Applying the slope down 3 and right 4 gives (4, -1); substituting x = 4 gives -3 + 2 = -1, which matches. Applying the slope again gives (8, -4); substituting x = 8 gives -6 + 2 = -4, which matches. The three points (0, 2), (4, -1), and (8, -4) are collinear, so a straightedge through them defines the line. The line falls from left to right, consistent with the negative slope.
Common mistakes
- Applying the rise in the wrong direction for a negative slope. Treat the negative sign as part of the rise: for m = -3/4, move down 3 and right 4, or up 3 and left 4.
- Plotting the intercept at (b, 0) instead of (0, b). Substitute x = 0 to confirm the intercept lies on the vertical axis at height b.
- Extending the line by eye after plotting only the intercept. Plot and verify a second and third integer point, then use a straightedge through all of them.
Check your work
- Intercept plotted at (0, b) and labeled.
- Slope direction matches the sign of m.
- At least two points beyond the intercept verified by substitution.
- Points are collinear and connected with a straightedge.
- Grid scale stated and labels readable.
- Fractional run handled with integer points at multiples of the run.
Questions before you start
How many points should I verify before drawing the line?
Verify at least two points beyond the intercept when the grid allows. Three collinear points catch most slope and arithmetic errors.
What if the run does not fit on my grid?
Apply the slope in the opposite direction from the intercept, or choose a smaller grid scale and label it clearly.
Can I check a line without recomputing every point?
Yes. Confirm the sign of the slope, substitute x = 0 for the intercept, and test one point far from the intercept.