Free original resources
Piecewise Function Graphing: Endpoints, Intervals and Open or Closed Points
Learn to graph piecewise functions by matching each rule to its interval, plotting open and closed endpoints correctly, and checking intercepts and domain.
Free resources
Letter & A4
PDF & SVG
Letter & A4
PDF & SVG
Make it yours.
Free · no signup · calculated in your browser
Your free printable kit.
Original reference, student practice and separate worked answers. No account or payment.
Practice worksheet
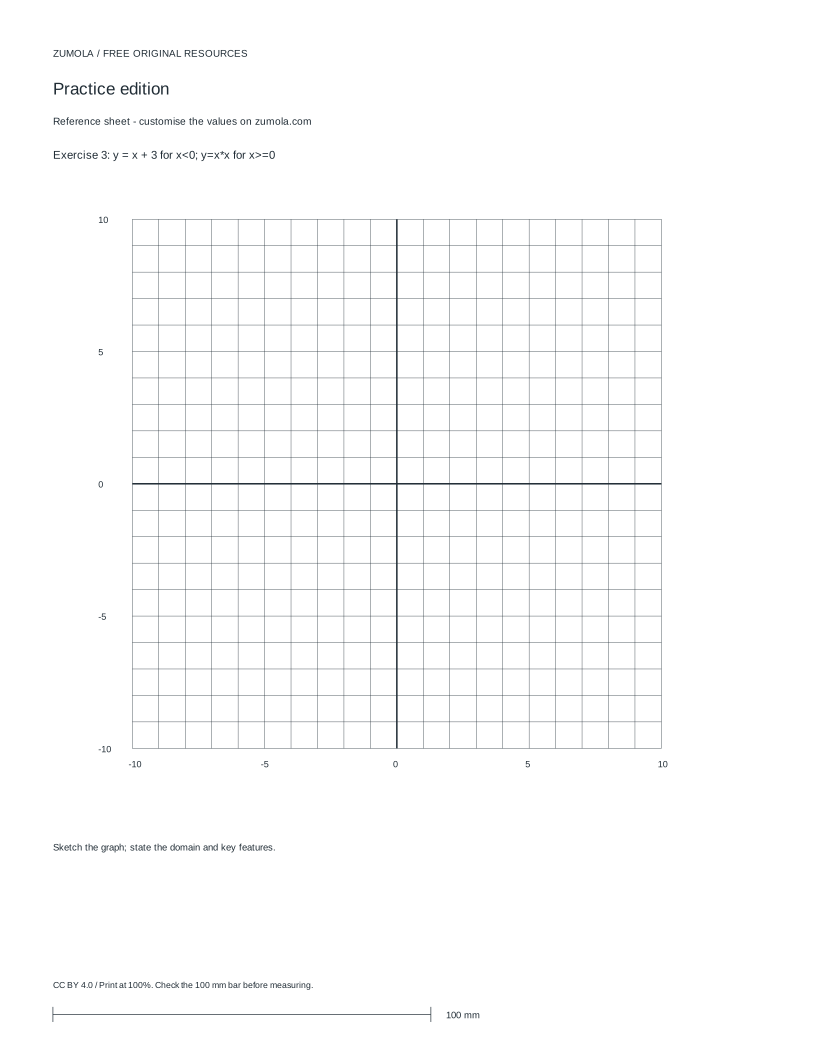
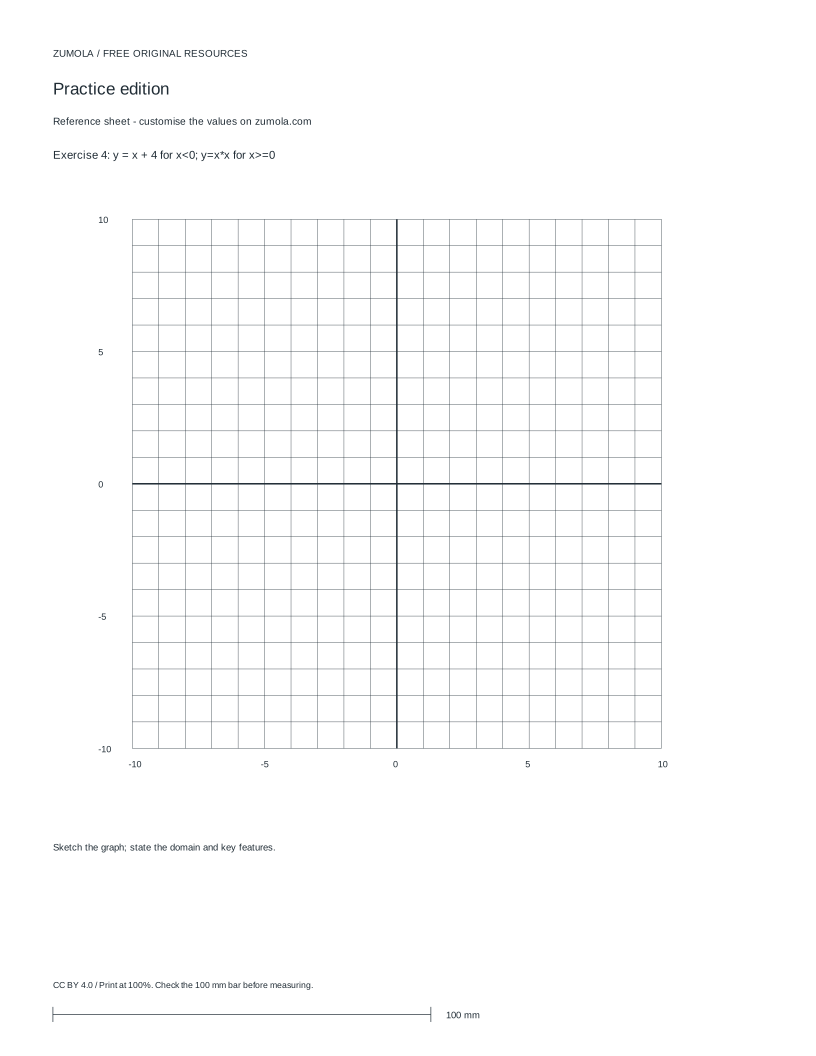
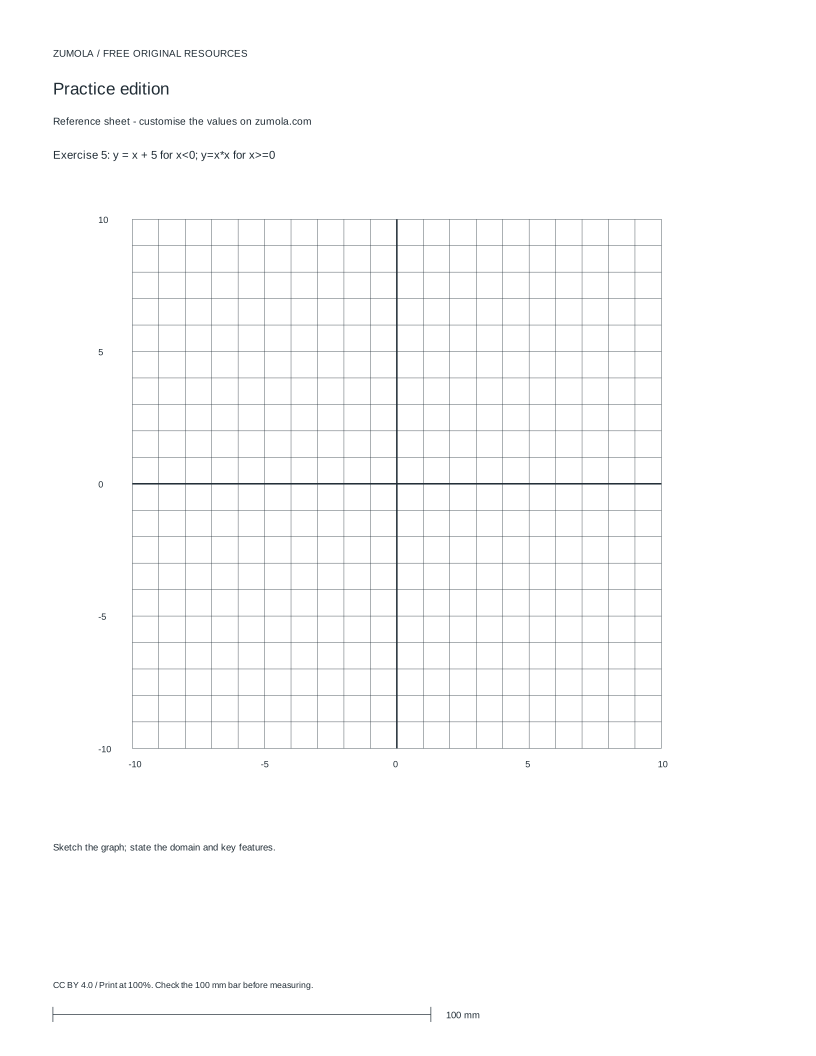
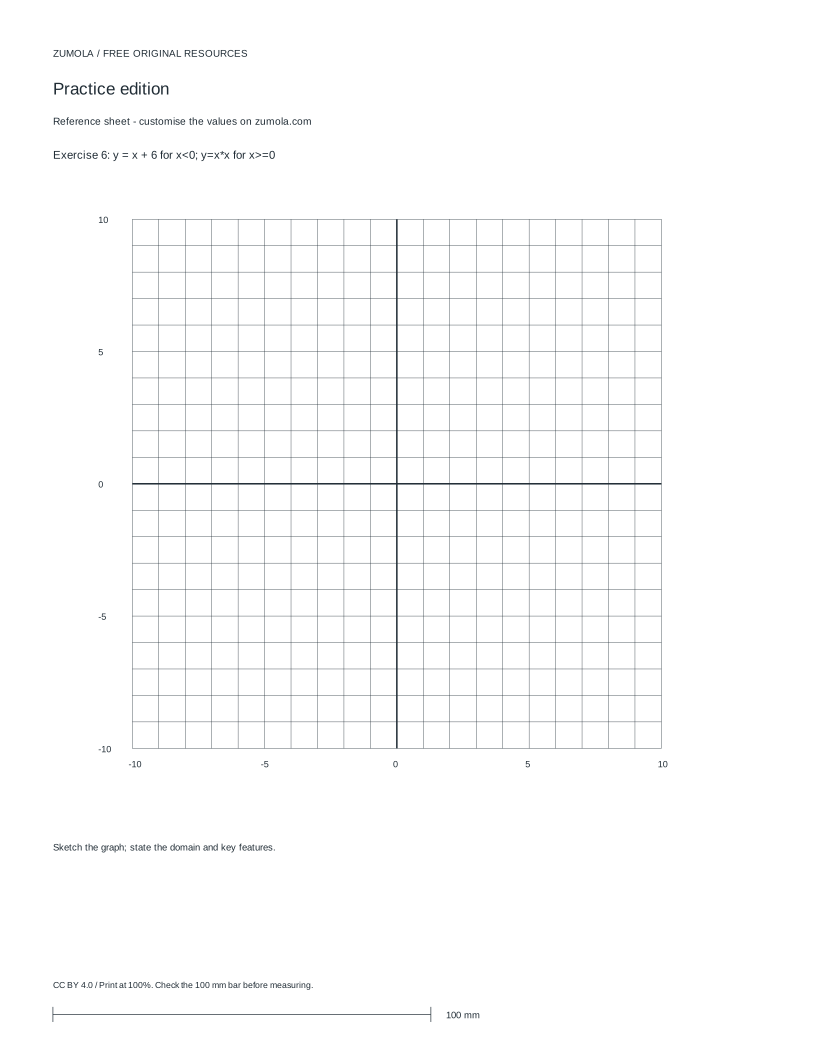
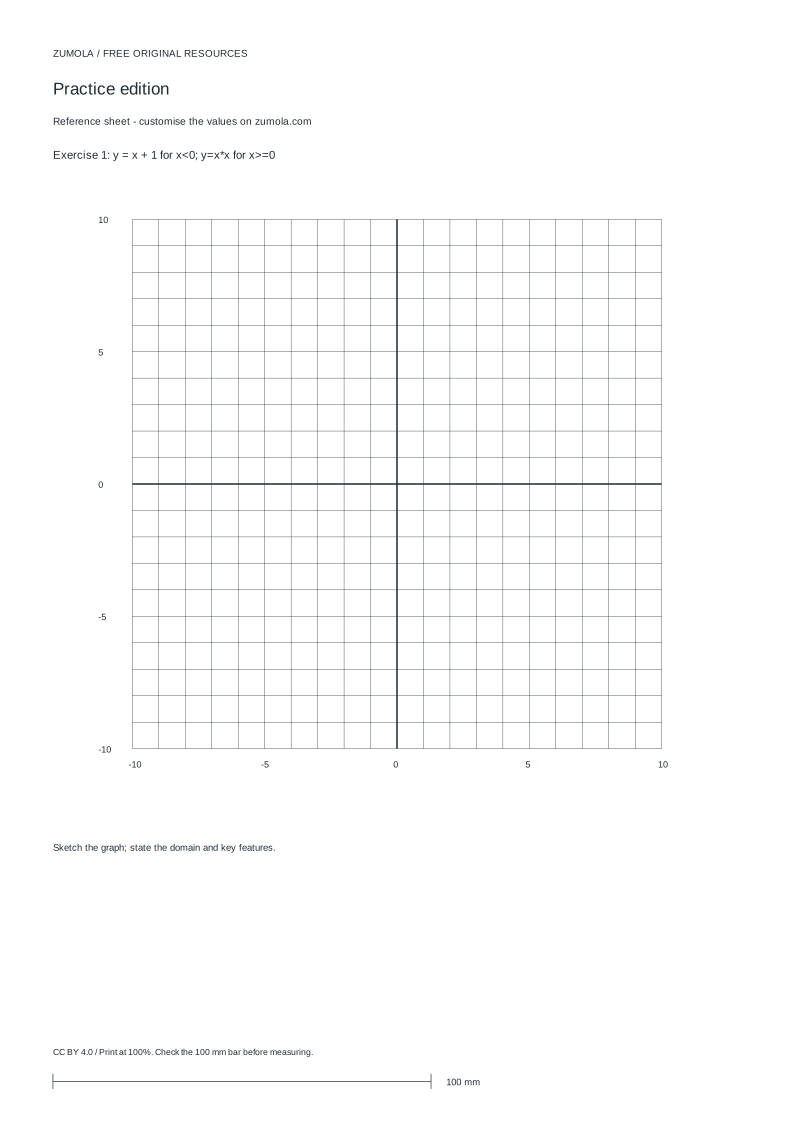
Worked answers / rubric
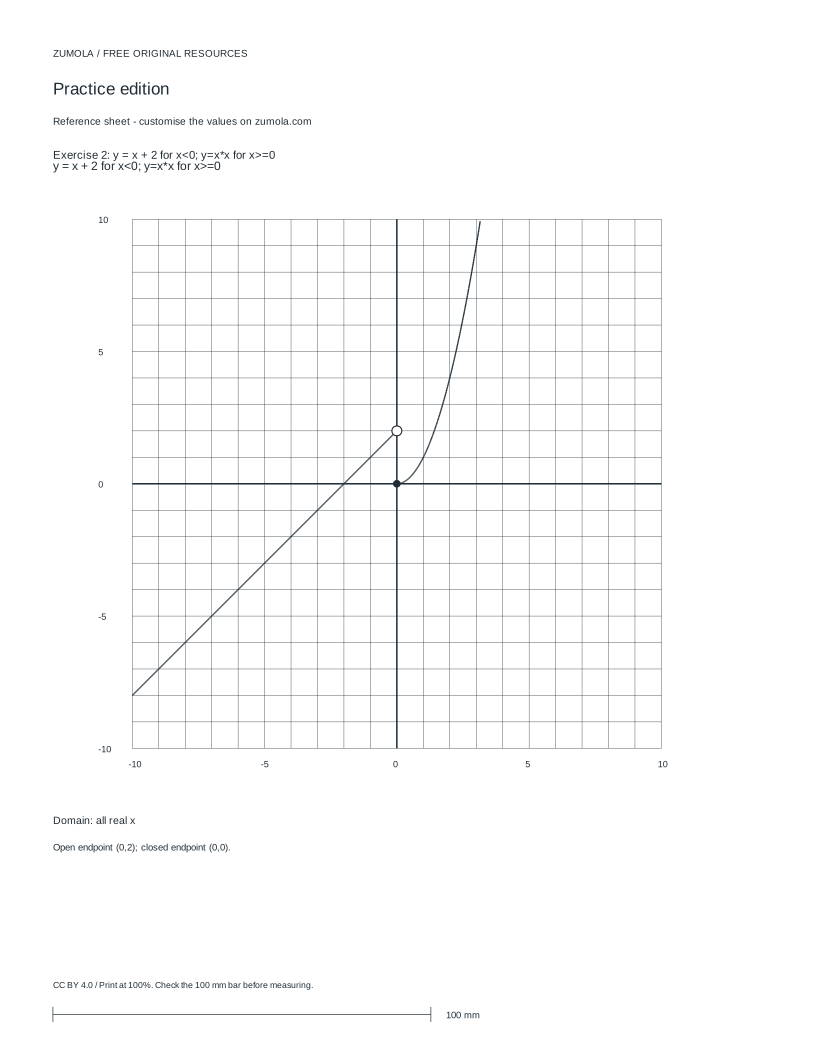
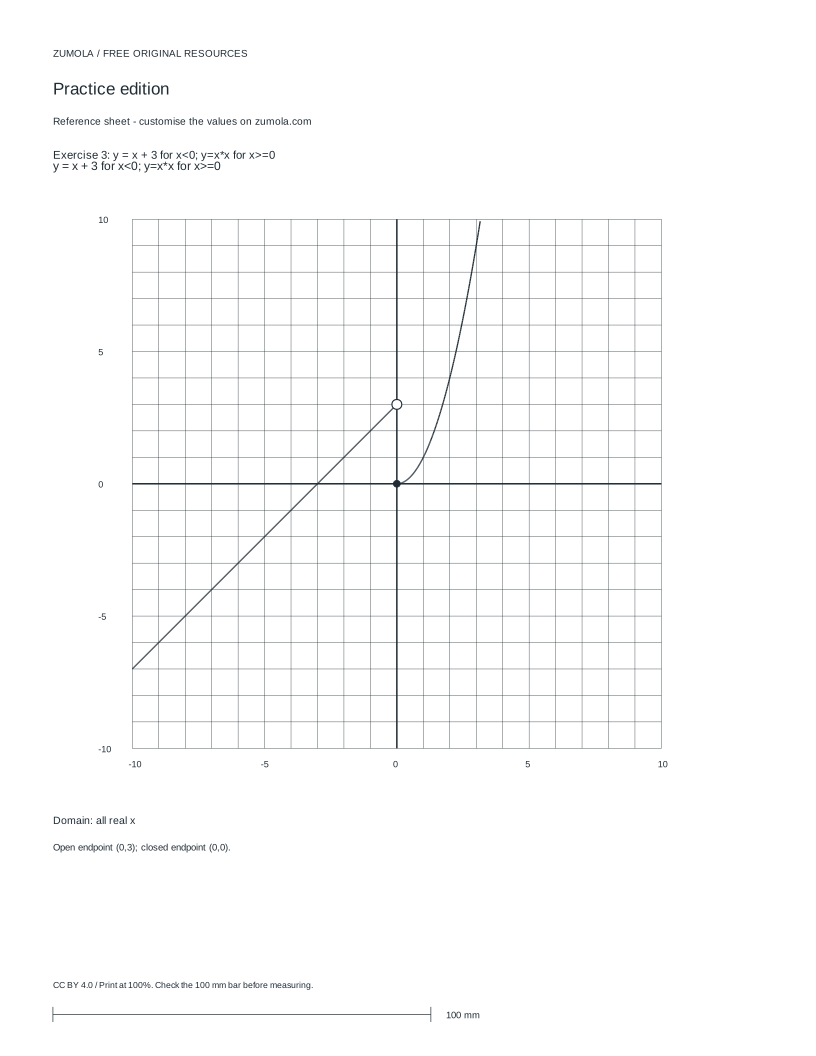
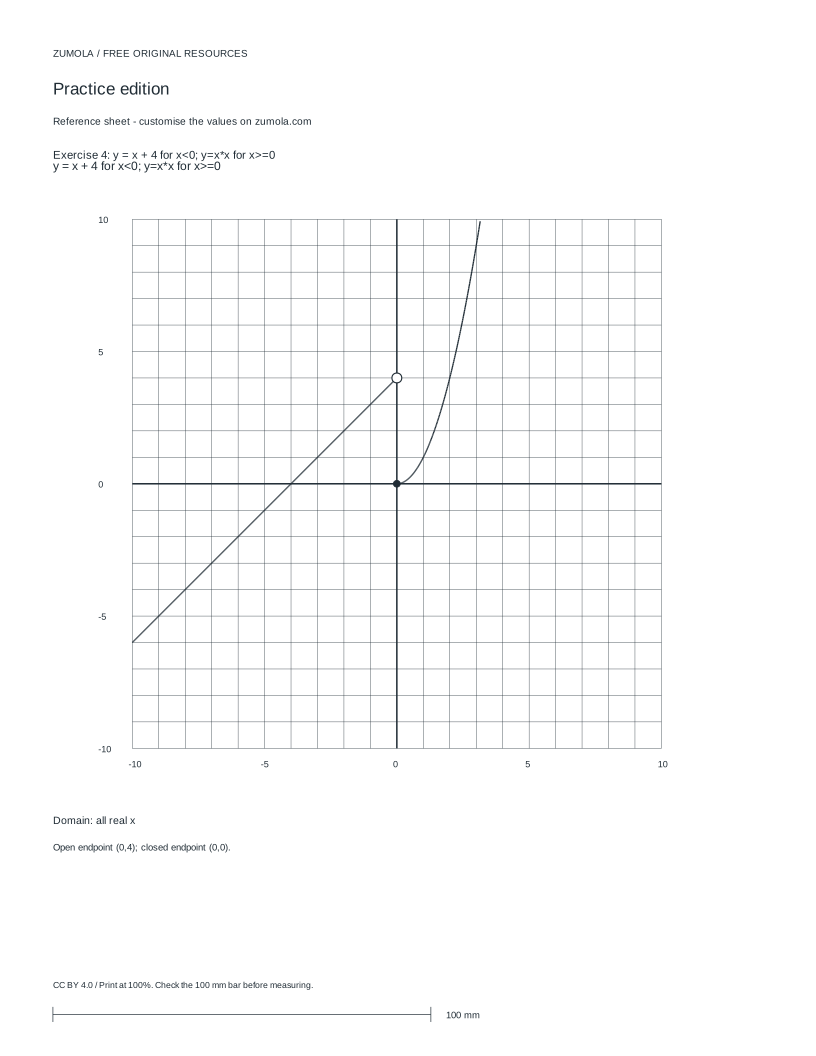
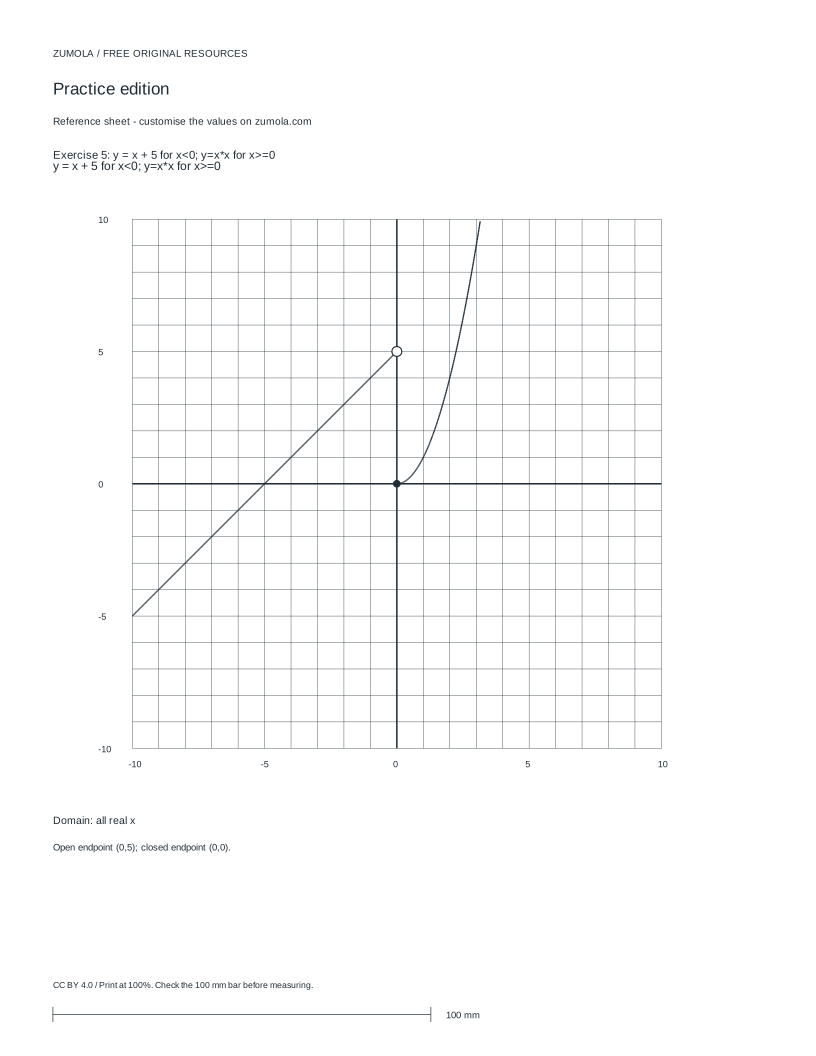
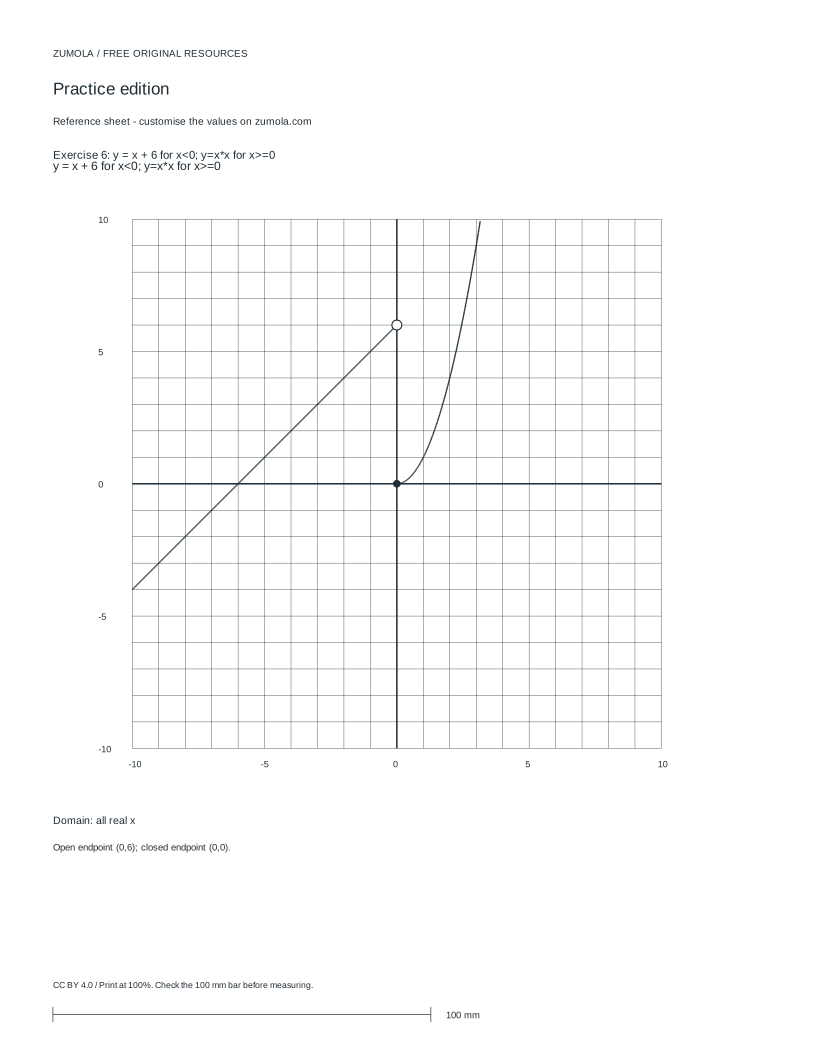
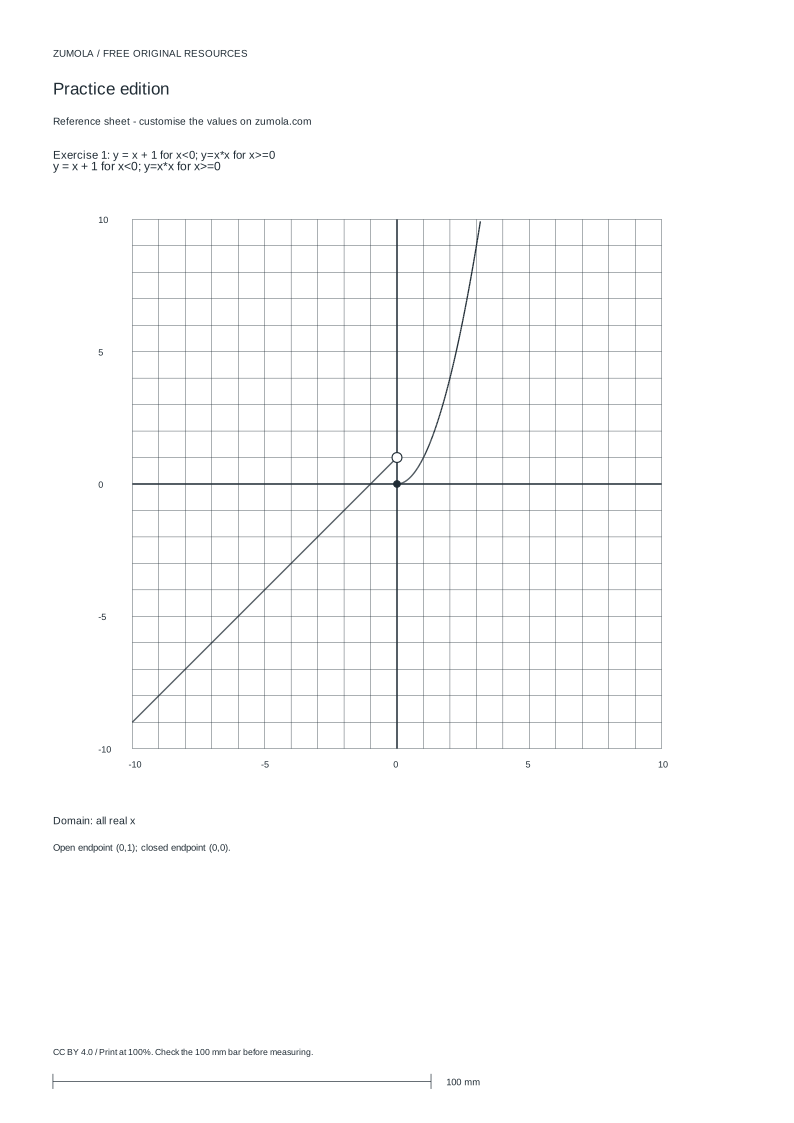
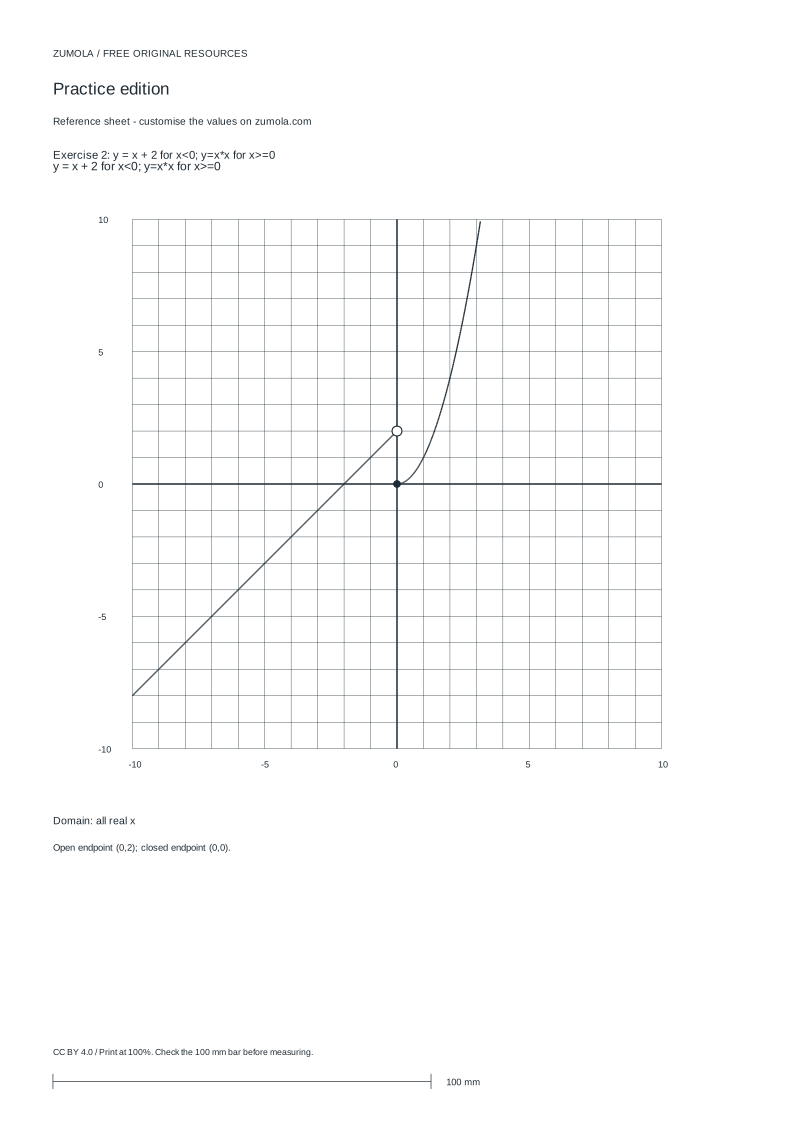
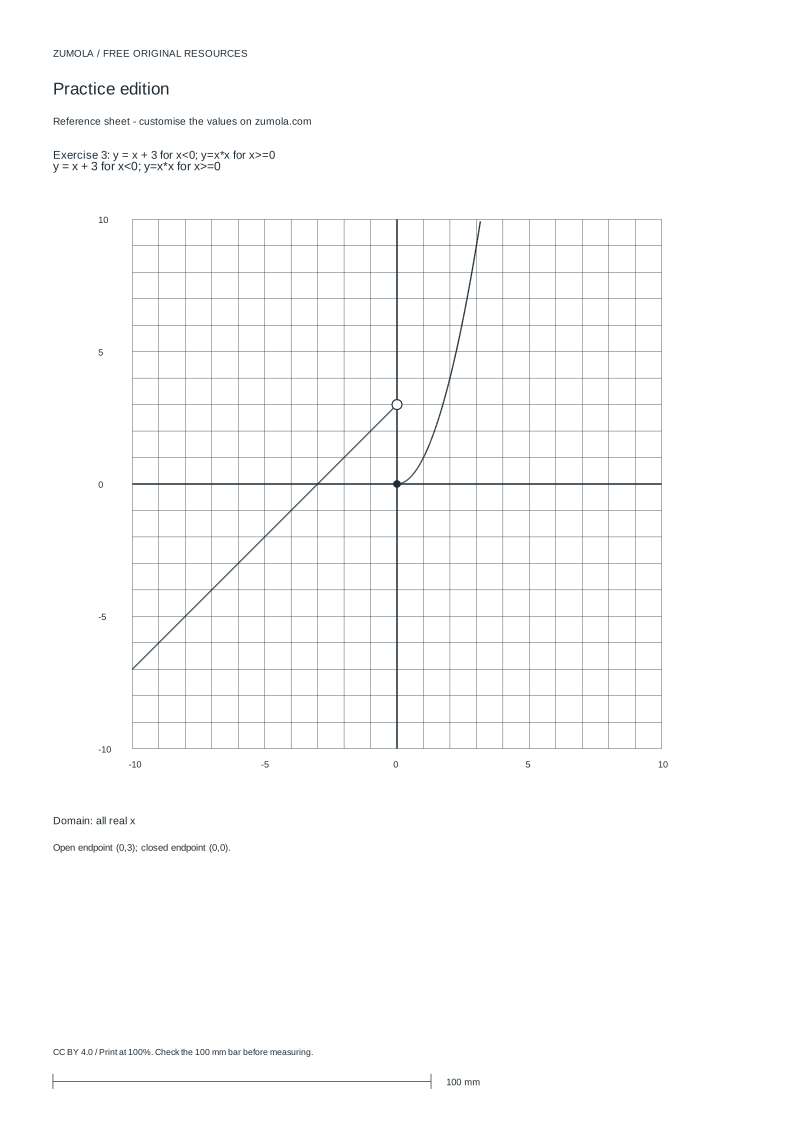
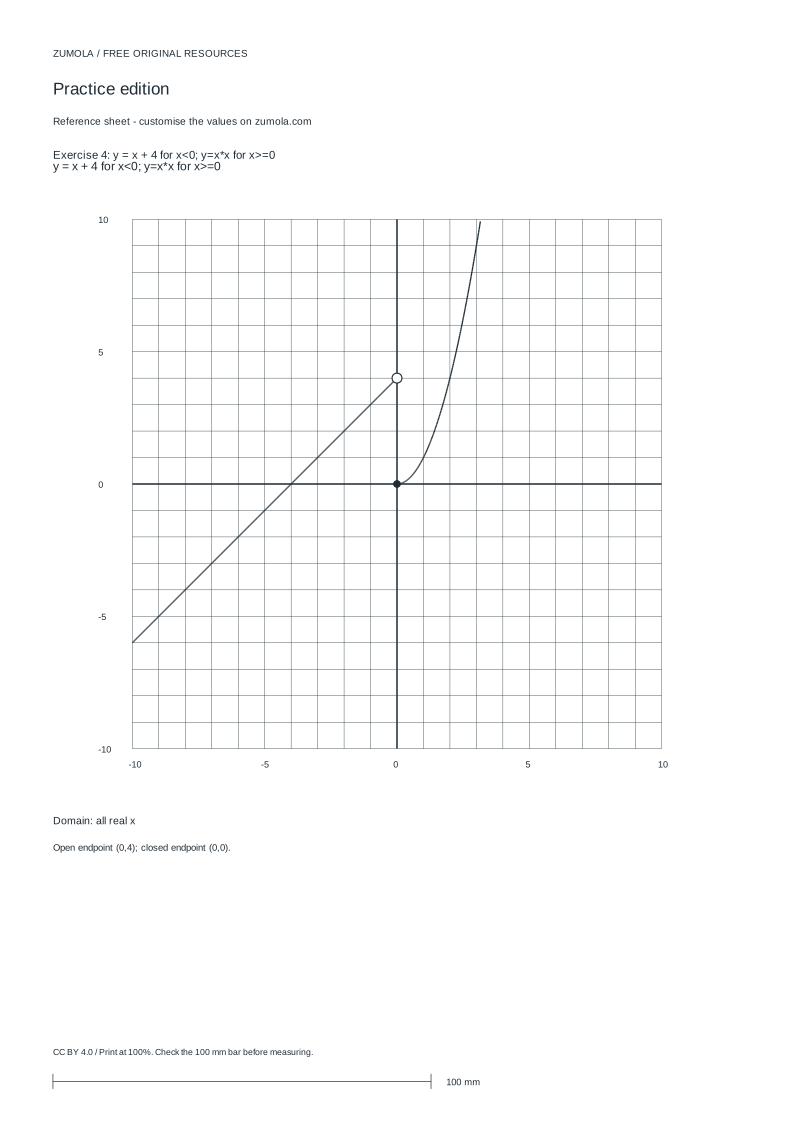
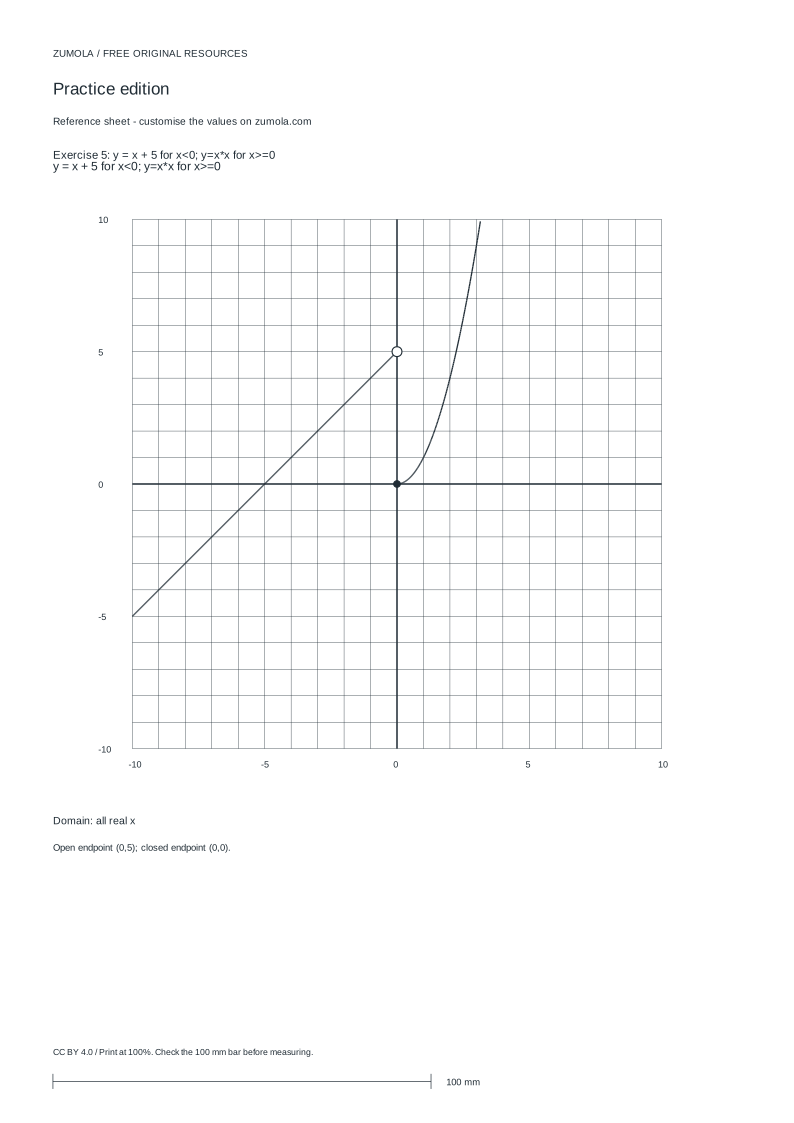
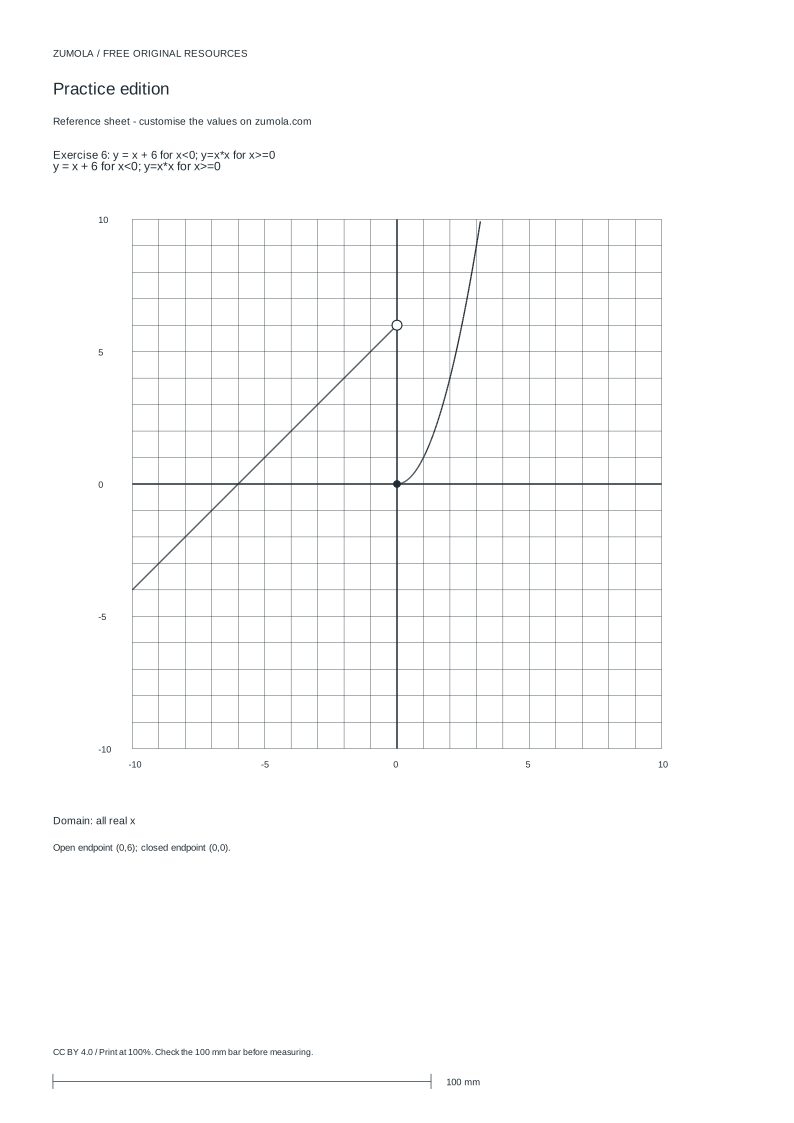
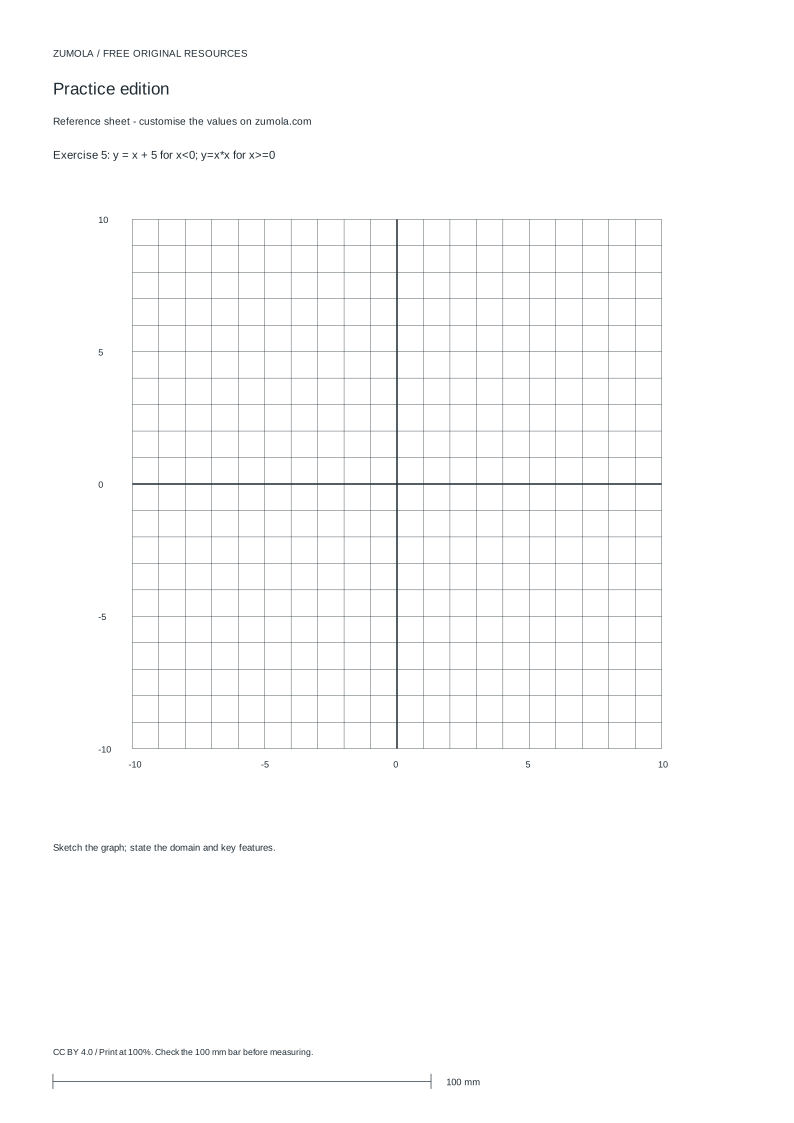
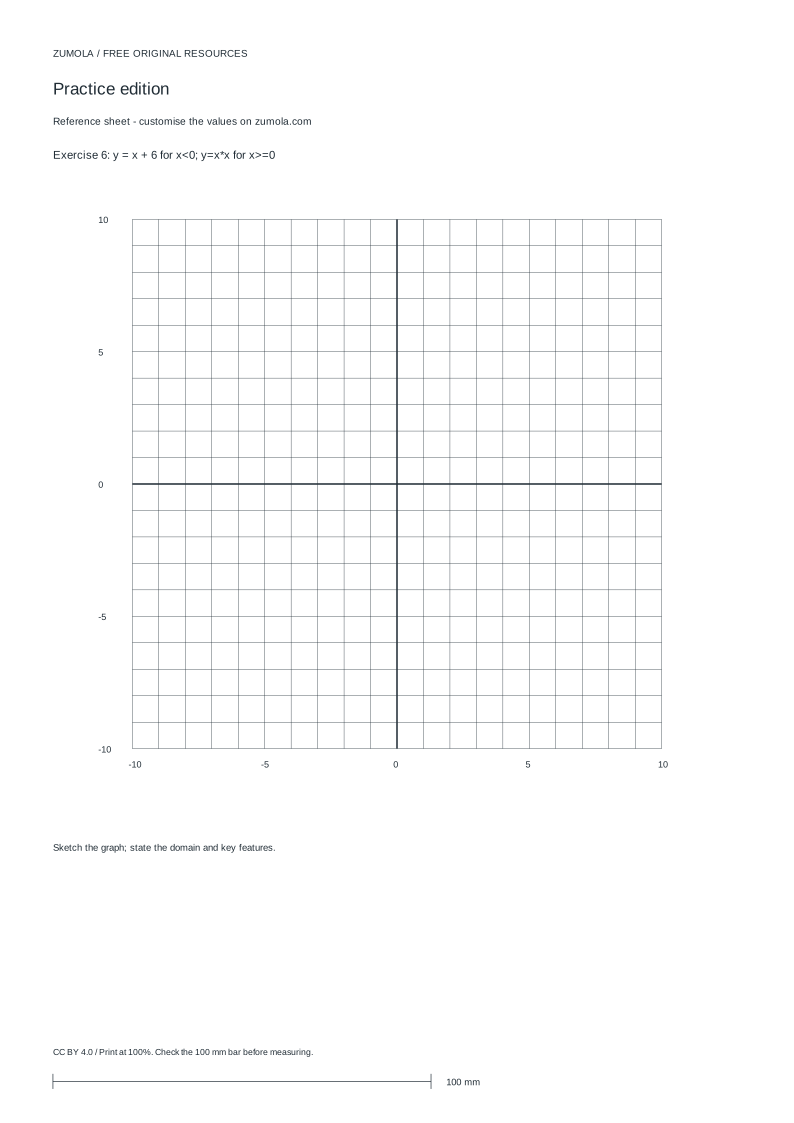
Print at Actual size / 100%. Check the calibration bar before using physical dimensions.
A piecewise function uses different rules on different parts of its domain. Graphing it well means more than drawing two curves: each rule must be applied only on its stated interval, and every endpoint must show whether it is included or excluded. This page explains the method step by step, with a simple worked example and a rubric for judging a finished graph. Coordinate values here are abstract units, not physical measurements.
Match each rule to its interval before plotting
Read the function as a list of cases. For each case, note the expression and the exact condition on x. The condition tells you where that expression is allowed to produce points. A rule written for x < 0 applies only to the left of zero; a rule written for x >= 0 applies at zero and to the right.
Sketch each expression across a wider range than its interval so you can see its shape, then keep only the portion inside the interval. This prevents the common error of drawing a full line or parabola and forgetting that only part of it belongs to the function.
The domain is the union of the intervals. If the cases cover all real numbers with no gaps, the domain is all real x. If a gap exists, the graph has a missing vertical strip, and no point should be plotted there.
- List every case with its expression and its x-condition.
- Identify the endpoint x-values where the rule changes.
- Sketch each expression lightly beyond its interval to see its shape.
- Keep only the segment inside each interval.
- Mark each endpoint as open or closed according to whether the condition includes that x-value.
Open and closed endpoints carry the meaning
An endpoint is closed when the condition includes the endpoint value, such as x >= 0 or x <= 2. A closed endpoint is drawn as a filled dot and means the point belongs to the graph. An endpoint is open when the condition excludes the value, such as x < 0 or x > 2. An open endpoint is drawn as a hollow circle and means the point is not part of the graph.
At a break point, evaluate each rule separately at that x-value, but only plot the result if that rule's condition allows it. Two rules can approach the same height or different heights; the open or closed marks show which value the function actually takes.
If both rules include the break point, the function would assign two values to one input, so the definition is not a function there. Check the conditions for overlap before graphing.
- At each break point, substitute the x-value into every rule.
- Decide inclusion from the inequality symbol, not from the height of the curve.
- Draw a filled dot for included endpoints and a hollow circle for excluded ones.
- Confirm no x-value is assigned two different y-values.
Check points, intercepts and domain
Choose one test x-value inside each interval and compute y from that interval's rule. Plot the test point and confirm it lies on your drawn segment. This independent substitution catches rule mix-ups quickly.
Find intercepts by setting x = 0 for the y-intercept and y = 0 within each interval for x-intercepts, keeping only solutions that satisfy that interval's condition. An intercept outside the interval is not on the graph.
State the domain from the combined intervals and note any vertical asymptotes if a rule is rational. Asymptotes are not endpoints; they are lines the graph approaches but does not touch.
- Pick one interior test x-value per interval and compute its y-value.
- Check the plotted point against the drawn segment.
- Solve for intercepts and discard solutions outside the relevant interval.
- Write the domain as the union of the case intervals.
- Note any asymptotes separately from endpoints.
Worked example
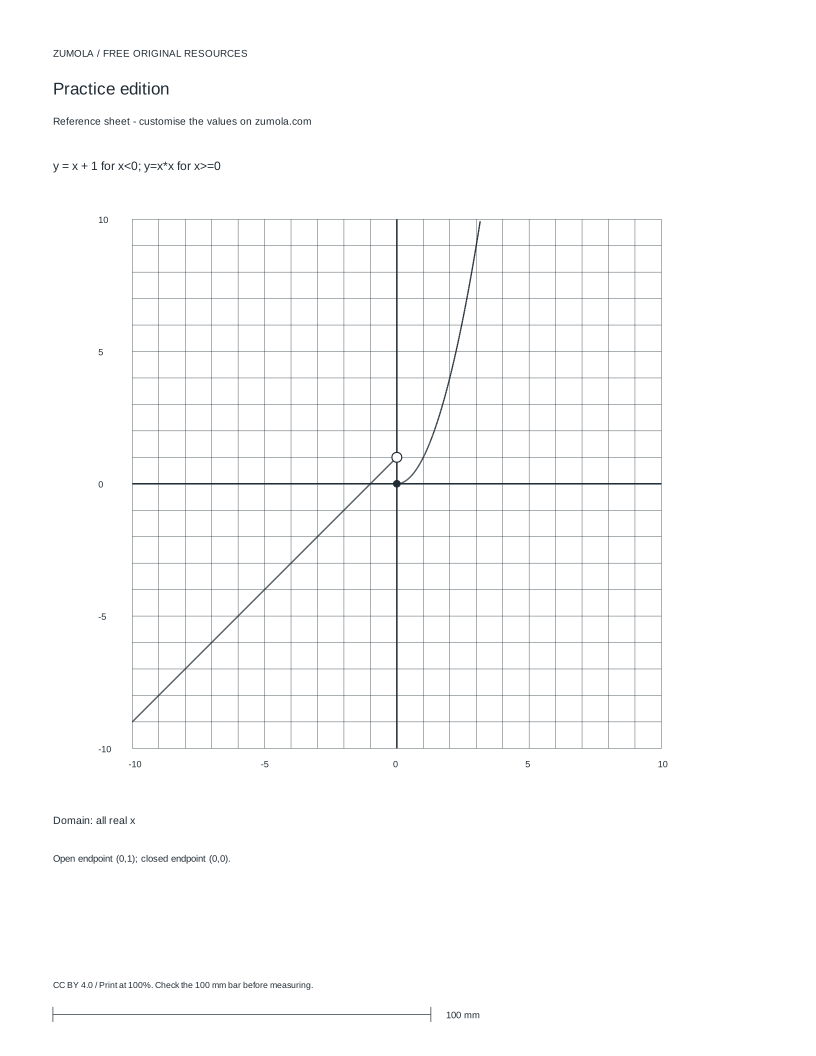
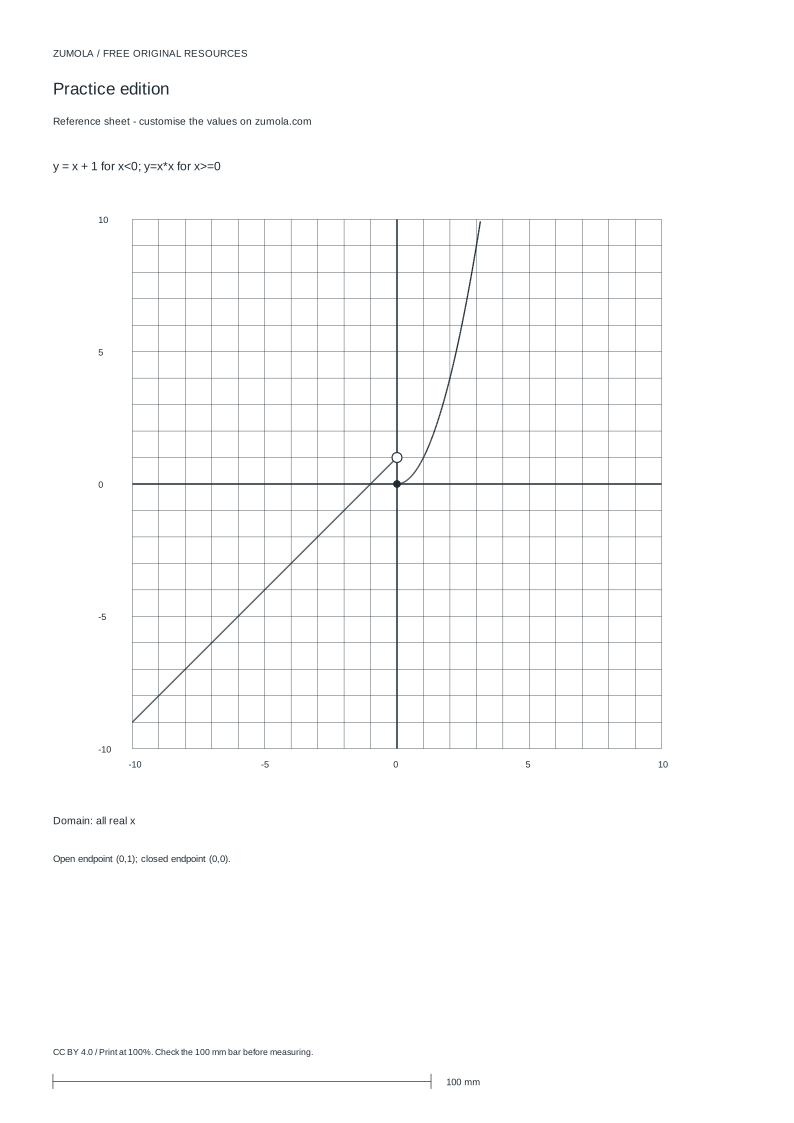
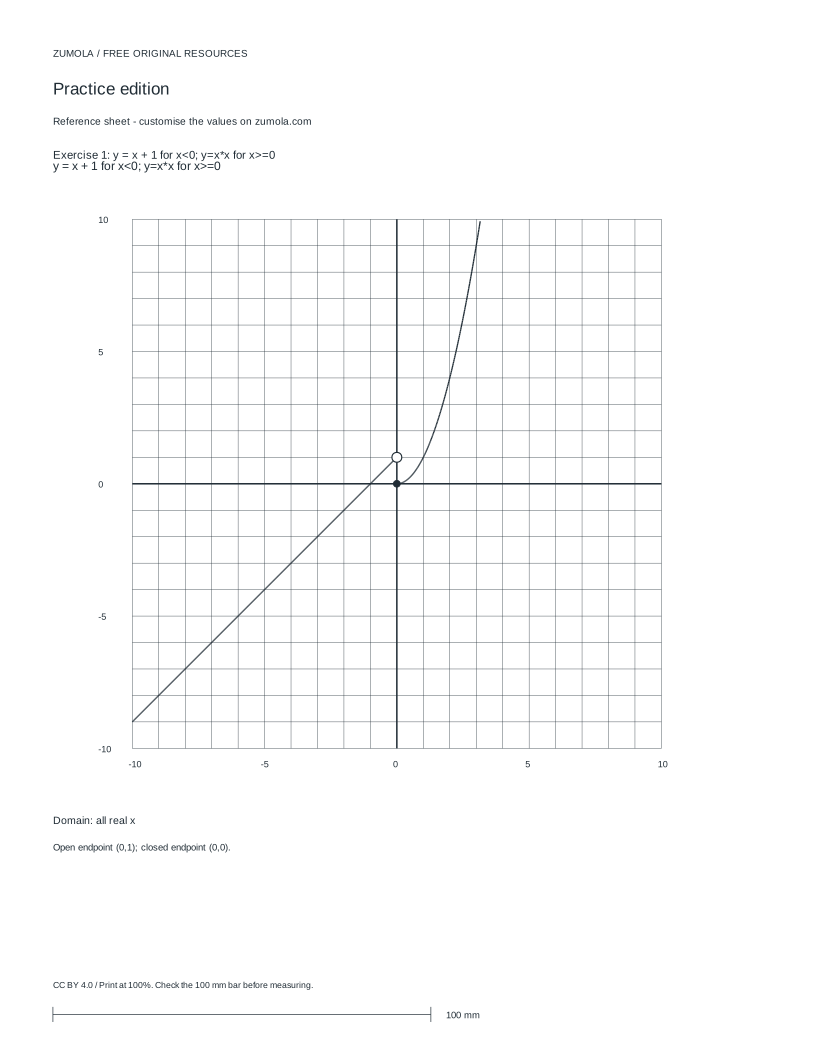
Consider y = x + 1 for x < 0, and y = x squared for x >= 0, with domain all real x. The break point is x = 0. For the first rule, x = 0 is excluded, so the endpoint at (0, 1) is open. For the second rule, x = 0 is included, so the endpoint at (0, 0) is closed.
Test x = -2 in the first rule: y = -1, giving the point (-2, -1). Test x = 2 in the second rule: y = 4, giving (2, 4). The y-intercept is the closed point (0, 0). The x-intercept of the first rule solves x + 1 = 0, giving x = -1, which satisfies x < 0, so (-1, 0) is on the graph. The second rule gives x = 0, already counted.
The finished graph is a straight line approaching the open point (0, 1) from the left and a parabola rising from the closed point (0, 0) to the right. The domain is all real x because the intervals join at zero with no gap.
- Mark the open endpoint (0, 1) and the closed endpoint (0, 0).
- Plot test points (-2, -1) and (2, 4).
- Draw the line segment for x < 0 and the parabola for x >= 0.
- Label intercepts and state the domain.
Judging a finished graph
Art and graph work can have more than one acceptable presentation, so use a rubric rather than expecting one exact picture. A correct graph shows the right shape on each interval, correct endpoint marks, and consistent labels. Neatness matters, but accuracy of intervals and endpoints matters more.
- Compare each segment with its rule and interval.
- Check every endpoint for open or closed marking.
- Verify test points and intercepts.
- Confirm the stated domain matches the drawn intervals.
Try this example
Graph y = x + 1 for x < 0 and y = x squared for x >= 0, with domain all real x. Identify endpoints, one test point per interval, and the domain.
Show the worked explanation
At x = 0, the first rule is excluded, so (0, 1) is open; the second rule is included, so (0, 0) is closed. Test x = -2 gives (-2, -1) on the line; test x = 2 gives (2, 4) on the parabola. The y-intercept is (0, 0), and the line's x-intercept is (-1, 0). The domain is all real x because the intervals meet at zero with no gap.
Common mistakes
- Drawing a full line or curve and ignoring the interval condition. Erase or omit any part of the expression outside its stated x-range, then mark the endpoint.
- Using a filled dot at a break point just because a curve reaches that height. Decide open or closed from the inequality symbol, then evaluate the rule only if its condition includes that x-value.
- Listing intercepts or test points that fall outside the interval for that rule. Substitute the candidate x-value back into the interval condition and discard it if the condition fails.
Check your work
- Each expression is drawn only on its stated interval.
- Every break-point endpoint is marked open or closed according to its inequality.
- At least one interior test point per interval is plotted and matches its rule.
- Intercepts are computed and only those inside the relevant interval are kept.
- The domain is stated as the union of the case intervals.
- Asymptotes, if any, are shown as approach lines rather than endpoints.
Questions before you start
How do I know whether an endpoint is open or closed?
Look at the inequality for that case. Symbols like < and > exclude the endpoint, so use a hollow circle. Symbols like <= and >= include it, so use a filled dot.
What if two rules both include the break point?
Then the definition assigns two values to one input and is not a function there. Adjust the conditions so exactly one rule includes the break point.
Does a vertical asymptote count as an endpoint?
No. An asymptote is a line the graph approaches without touching. Endpoints come from the interval conditions and are marked open or closed.