Free original resources
Mean, Median and Mode Practice: Sorting, Frequency and the Middle Value
Learn how to order data, count frequencies and find the median, with a clear worked example and a rubric for checking your own mean, median and mode work.
Free resources
Letter & A4
PDF & SVG
Letter & A4
PDF & SVG
Make it yours.
Free · no signup · calculated in your browser
Your free printable kit.
Original reference, student practice and separate worked answers. No account or payment.
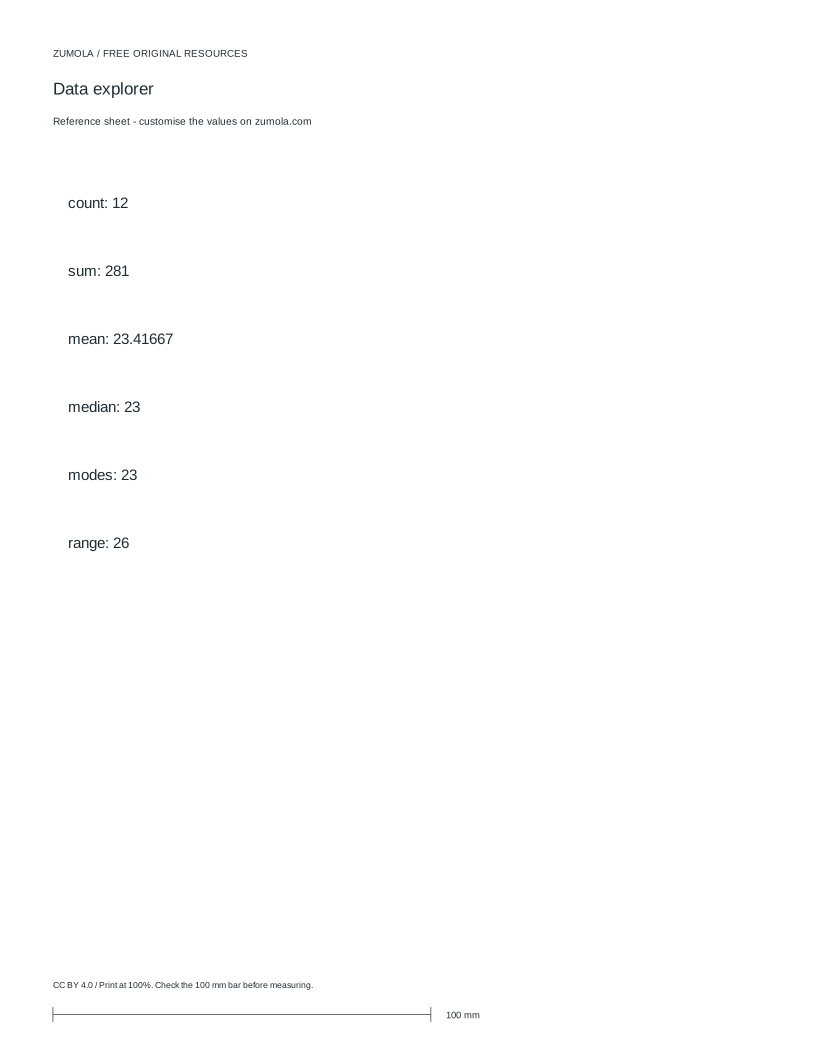
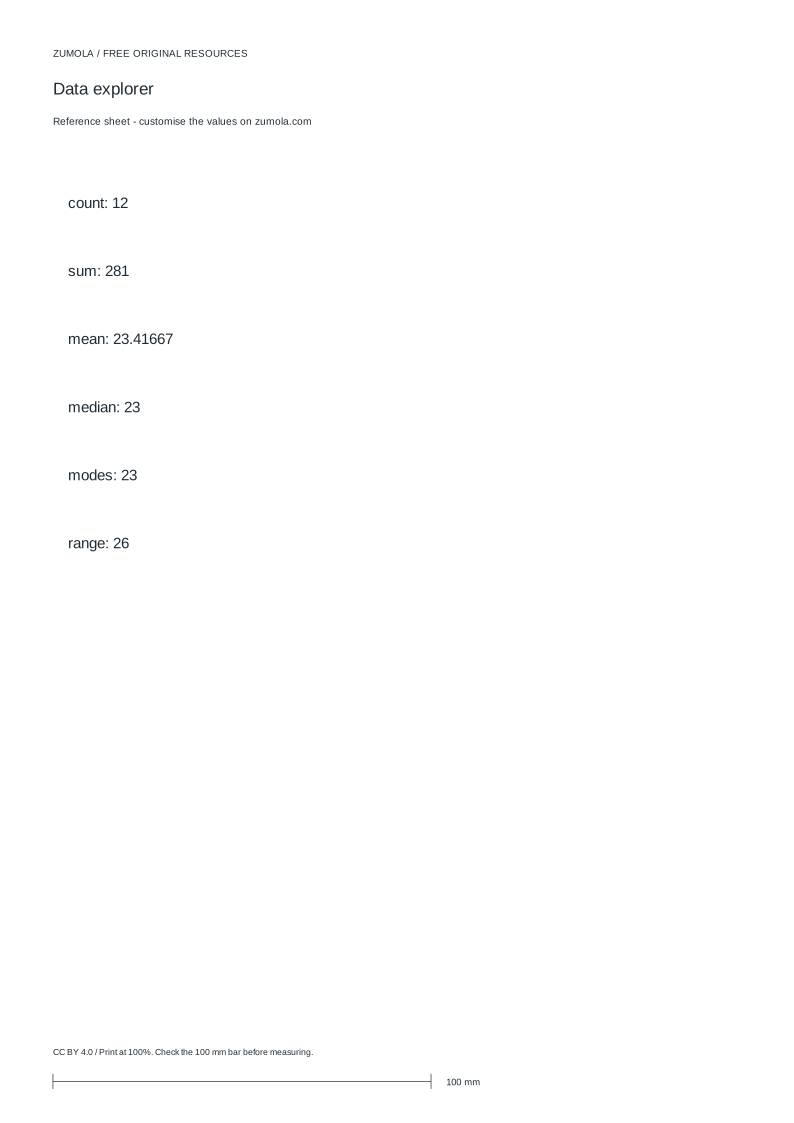
Practice worksheet
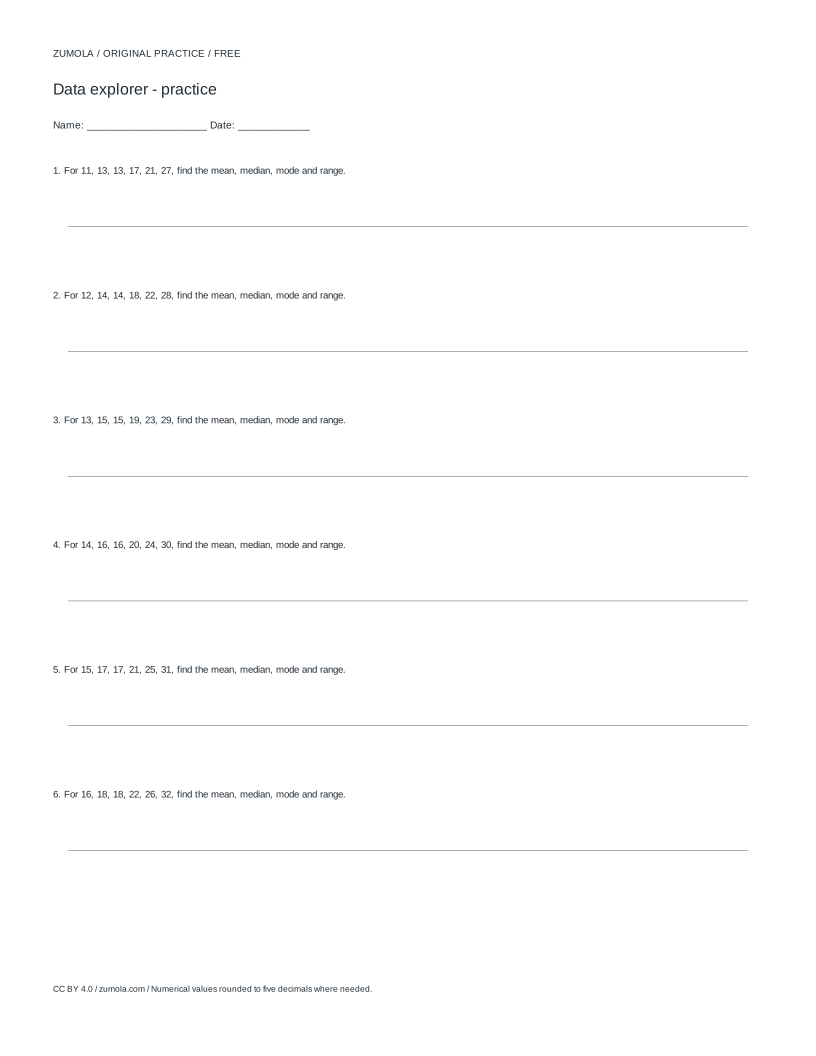
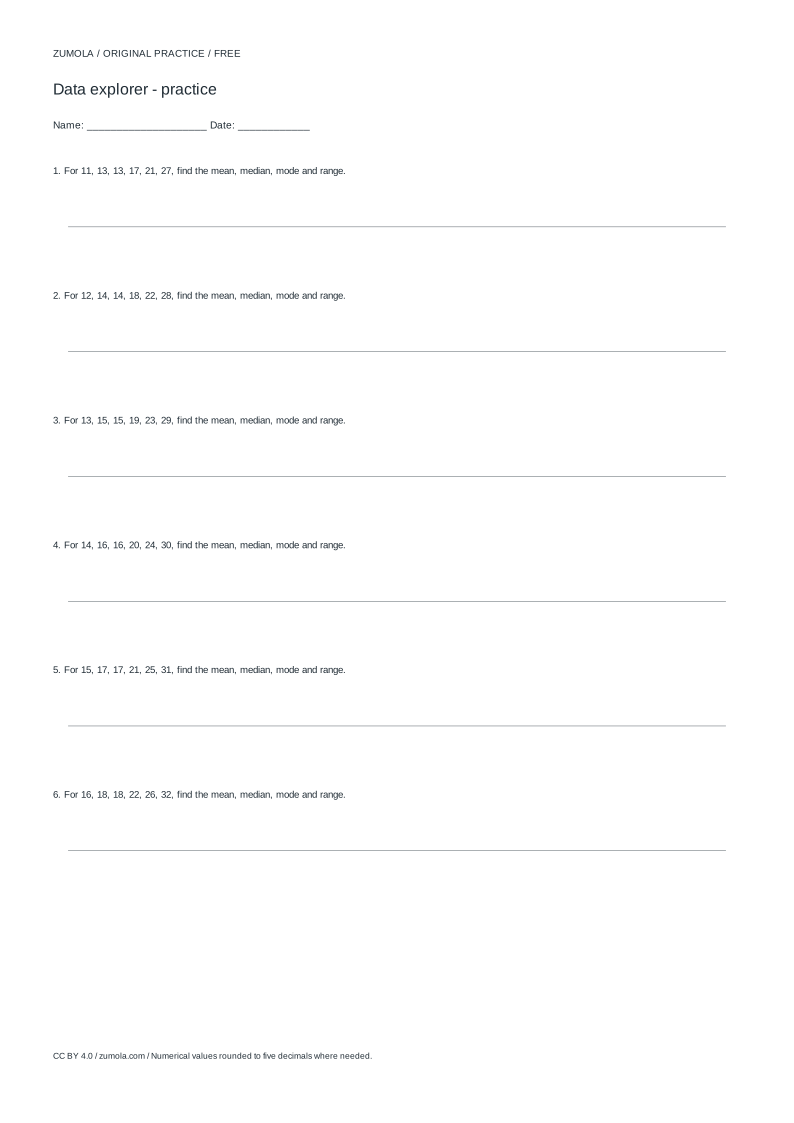
Worked answers / rubric
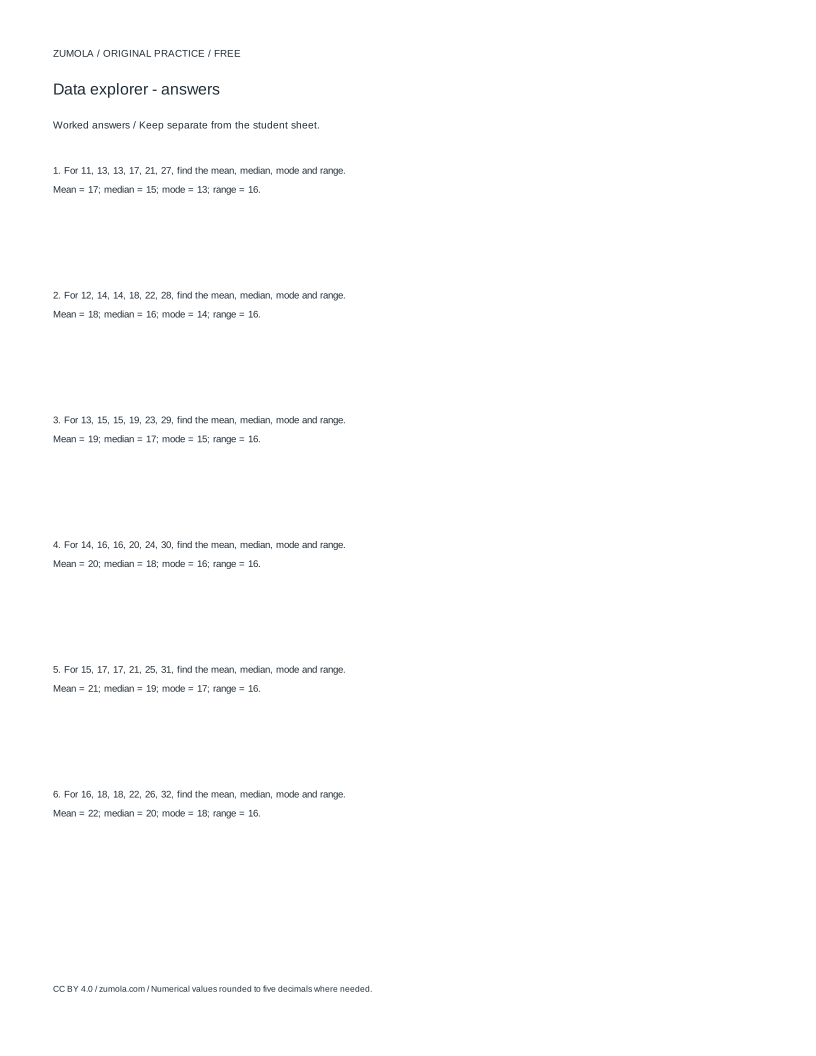
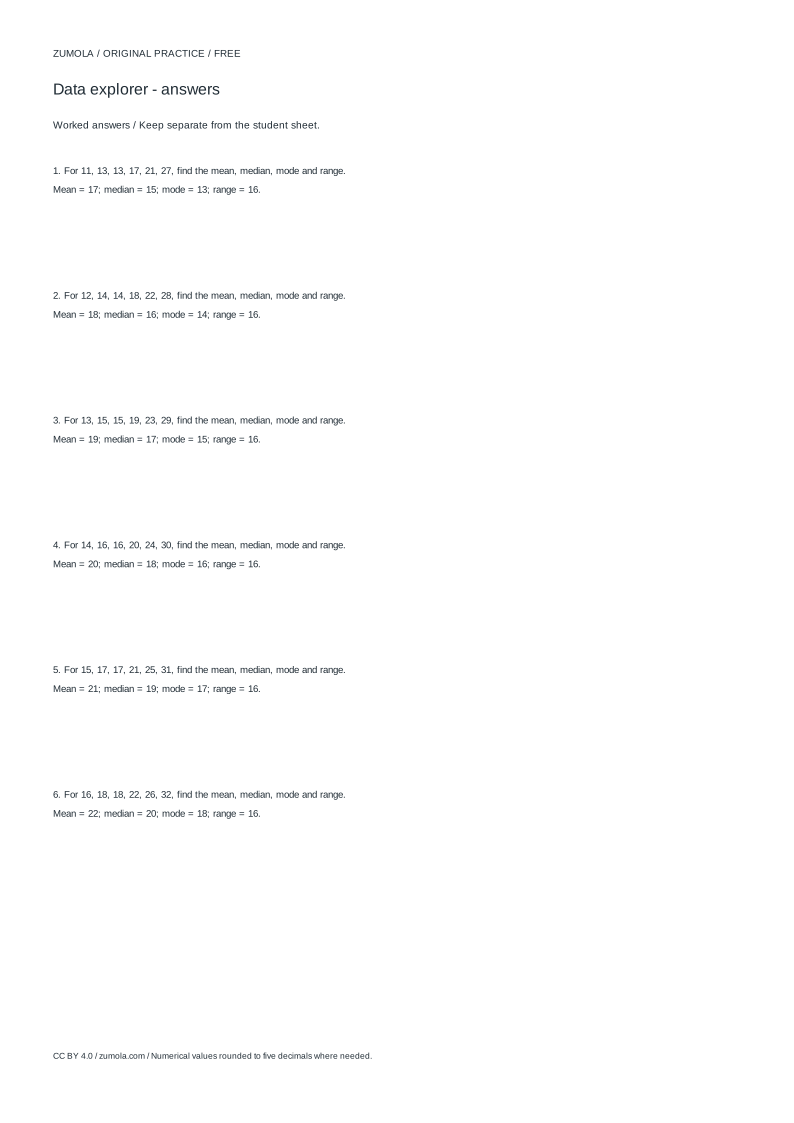
Print at Actual size / 100%. Check the calibration bar before using physical dimensions.
Mean, median and mode describe the same list of numbers in three different ways, so the order of your working matters. This page walks through sorting values, tallying how often each one appears, and locating the median in an ordered list. It also shows how the mean is built from the total and the count. A short original example and a checking rubric help you practise without guessing.
Sort first, then count frequency
Every reliable median calculation starts with an ordered list. Write the values from smallest to largest, keeping repeated values in place. Ordering turns a scattered set into a sequence where position means something: the smallest value sits at one end and the largest at the other.
Frequency is a separate count. For each distinct value, record how many times it appears. The frequencies must add up to the total number of values; if they do not, a value has been missed or counted twice. The mode is the value with the highest frequency, and a list can have one mode, several modes, or no mode when every value appears equally often.
Keep the raw values and the frequency table side by side while you work. The raw list protects the total count, and the table makes repeats visible. Neither replaces the other.
- Copy the values exactly as given, including repeats.
- Rewrite them in ascending order and count how many values you have.
- Build a frequency tally for each distinct value.
- Check that the frequencies sum to the total count before finding the median or mode.
Finding the median in an ordered list
The median is the middle value of an ordered list. When the count is odd, the median is the single value at position (n + 1) divided by 2, counting from 1. When the count is even, there is no single middle value, so the median is the mean of the two central values at positions n divided by 2 and n divided by 2 plus 1.
That averaging step is where many errors appear. For an even count, the median is not automatically one of the original values; it can sit between two of them. Report it as the calculated midpoint and show the two central values you used.
The mean uses a different route: add every value to get the total, then divide by the count. The median depends on position, the mean depends on the total, and the mode depends on frequency. Keeping these three routes separate prevents mixing them up.
- Confirm the list is in ascending order and note n, the count.
- If n is odd, take the value at position (n + 1) / 2.
- If n is even, take the values at positions n / 2 and n / 2 + 1, then average them.
- For the mean, divide the sum of all values by n.
- For the mode, read the highest frequency from your tally.
Data types, bins and quartile assumptions
Label the data type before choosing a display. A bar chart compares counts in separate categories, and a histogram groups continuous measurements into bins. A line graph usually shows change over an ordered sequence such as time. Mixing these up changes what the picture claims, so state which one you are using and why.
When data are grouped into bins, say where each bin starts and ends and whether edges are included. A bin width of 10 might run 10 to under 20, then 20 to under 30, and so on. Grouped data give an estimated median, not an exact one, because individual values inside a bin are unknown.
Quartiles also need a declared method. Different conventions place the lower and upper quartiles at different positions, so two correct-looking answers can differ. Write down the rule you used, keep raw frequencies consistent with the total, and treat any schematic chart numbers as abstract coordinate units rather than measurements.
- State whether the data are categorical, discrete or continuous.
- Choose a display that matches the data type and label the axes.
- For grouped data, write each bin's lower and upper boundary and the inclusion rule.
- Declare the quartile method before computing, and check frequencies against the total.
Checking your work
A quick consistency check catches most slips. The frequencies should sum to n, the ordered list should still contain the same values as the original, and the median should sit between the smallest and largest values. If the mean is far outside the range of the data, the total or the count is probably wrong.
Use a rubric rather than expecting one exact answer for open tasks. A well-presented solution shows the ordered list, the frequency tally, the position used for the median, and the sum and count behind the mean. Neat working makes each step checkable, which matters more than a tidy final number.
- Re-add the frequencies and compare with n.
- Confirm the ordered list matches the original values.
- Check the median lies within the data range.
- Verify the mean by multiplying it by n and comparing with the sum.
Try this example
Find the mean, median, mode and range of 12, 15, 15, 18, 21, 23, 23, 23, 28, 31, 34, 38.
Show the worked explanation
Ordered list: 12, 15, 15, 18, 21, 23, 23, 23, 28, 31, 34, 38. Count n = 12. Sum = 281, so mean = 281 / 12 = 23.4166... (about 23.42). Even count, so the median is the average of positions 6 and 7: (23 + 23) / 2 = 23. The value 23 appears three times, more than any other, so the mode is 23. Range = 38 - 12 = 26. Frequencies sum to 12, matching n.
Common mistakes
- Finding the median before sorting the values. Rewrite the list in ascending order first, then locate the middle position.
- Treating the median of an even count as one of the two central values. Average the two central values and show both in your working.
- Letting the frequency tally disagree with the total count. Add the frequencies and compare with n; correct any missed or duplicated value.
Check your work
- Values are copied accurately and rewritten in ascending order.
- Frequency tally is complete and sums to the total count.
- Median position is stated and the even-count averaging step is shown.
- Mean shows the sum and the count used in the division.
- Mode is identified from the highest frequency, with ties noted.
- Data type, bin boundaries and quartile method are declared where relevant.
Questions before you start
What is the difference between mean, median and mode?
The mean divides the total by the count, the median is the middle of an ordered list, and the mode is the most frequent value.
Can a data set have more than one mode?
Yes. If several values share the highest frequency, each is a mode. If all values appear equally often, there is no mode.
Why does the median of grouped data differ from the raw median?
Grouped data hide individual values inside bins, so the median is estimated from bin positions rather than exact values.