Free graphing resources · Original practice
Box and whisker plot worksheets.
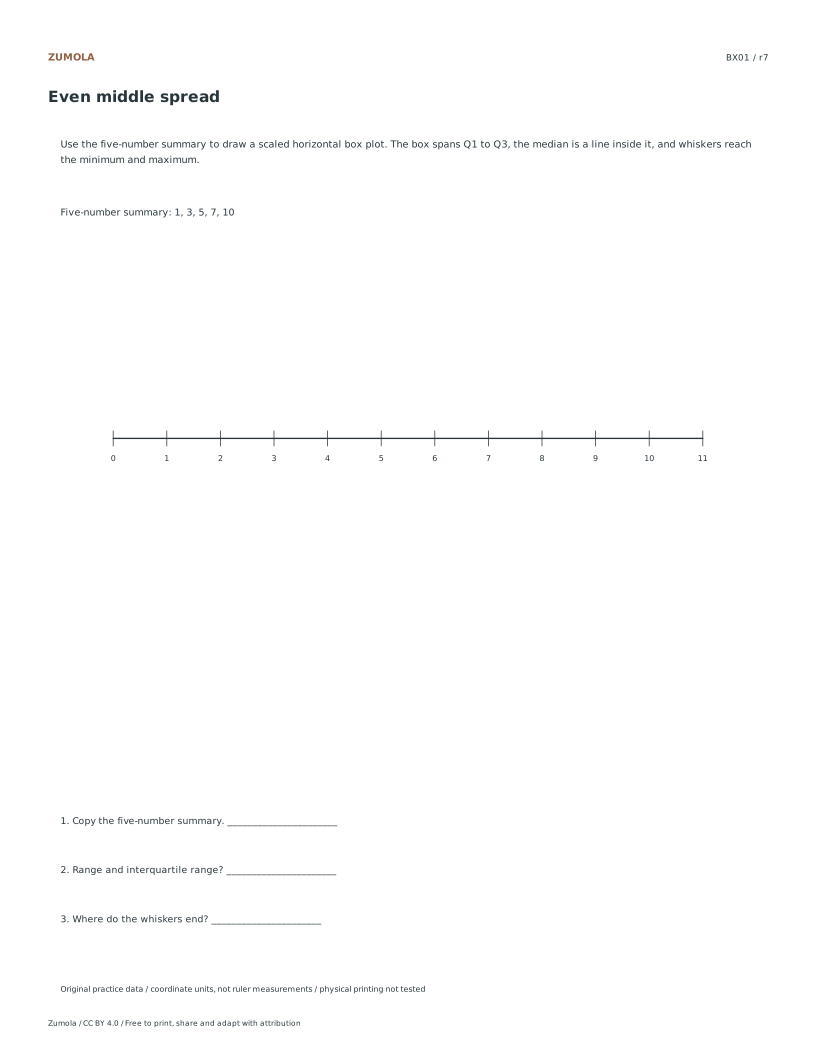
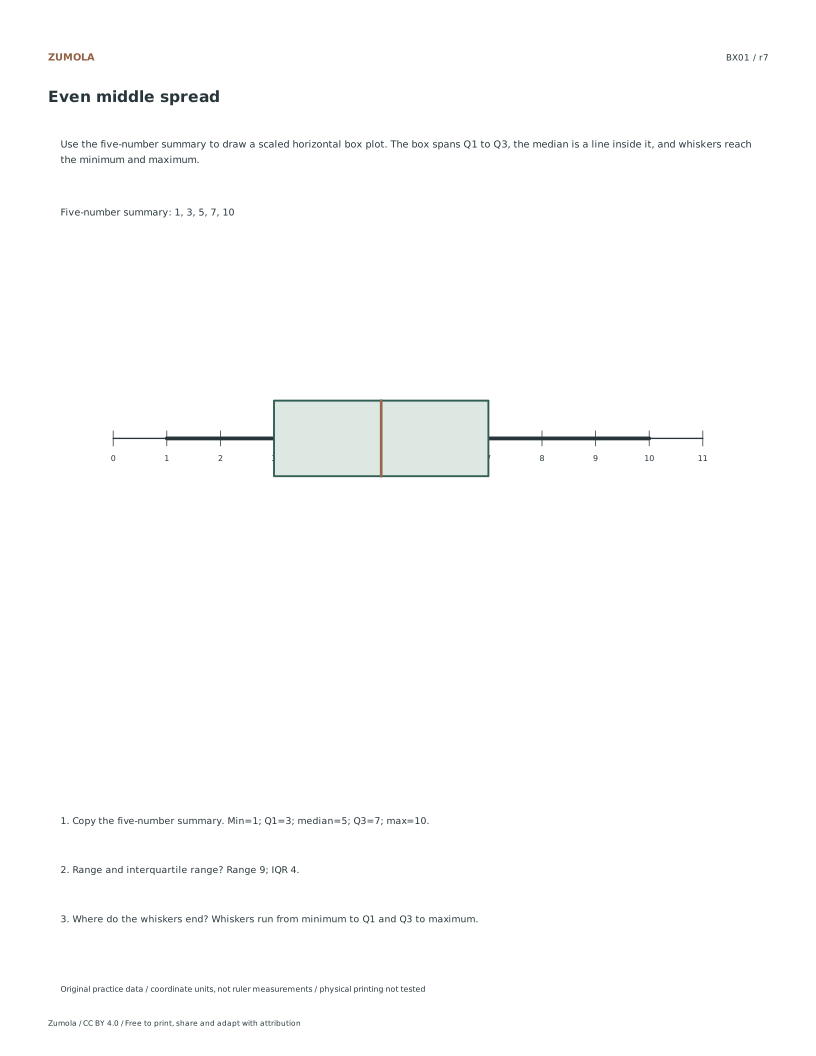
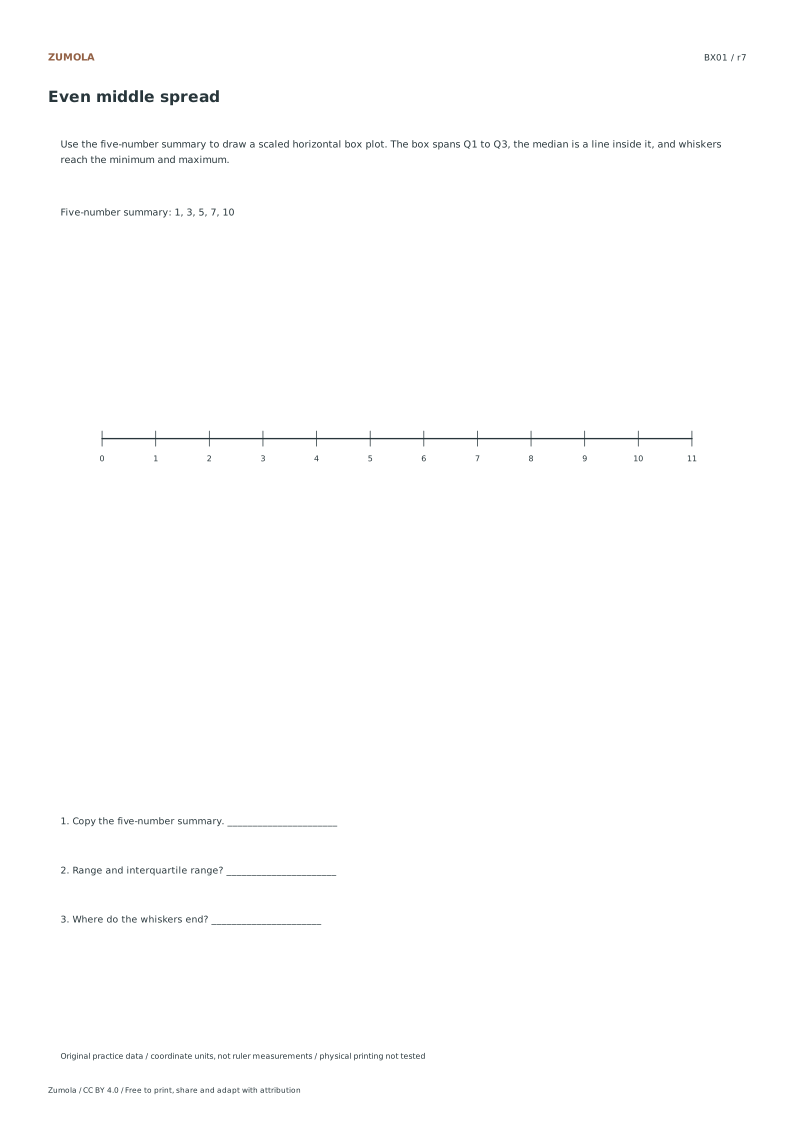
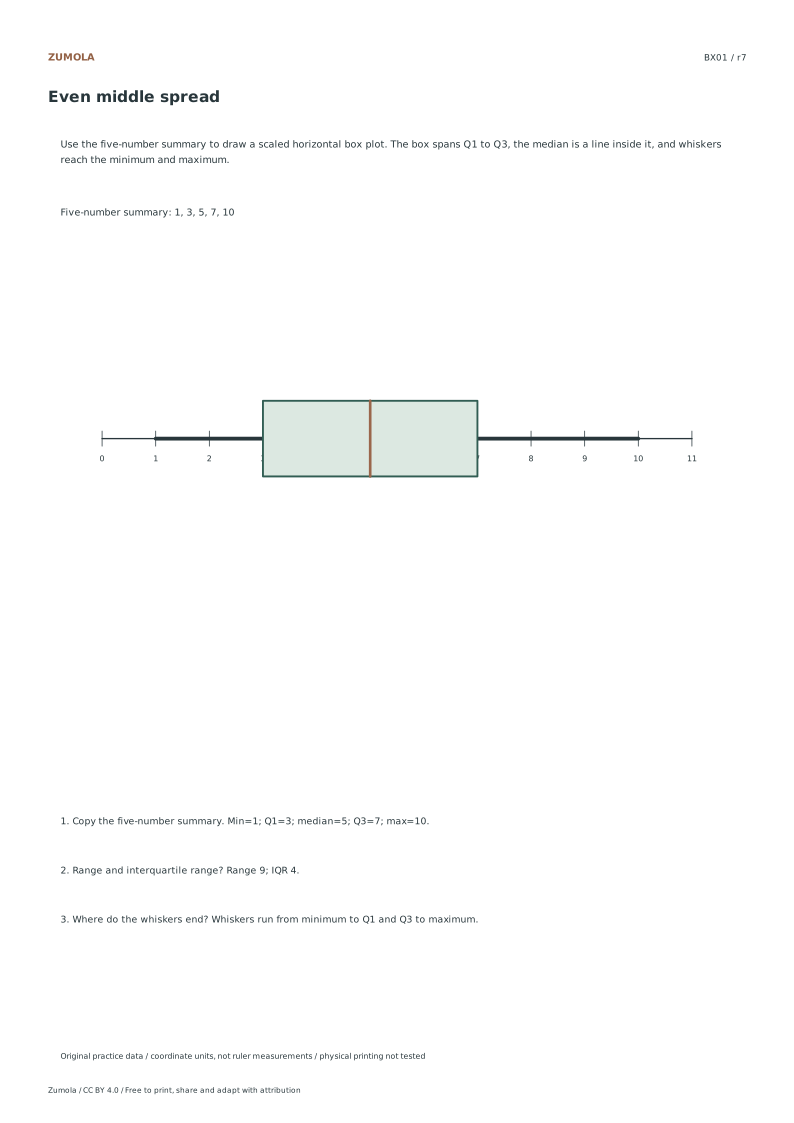
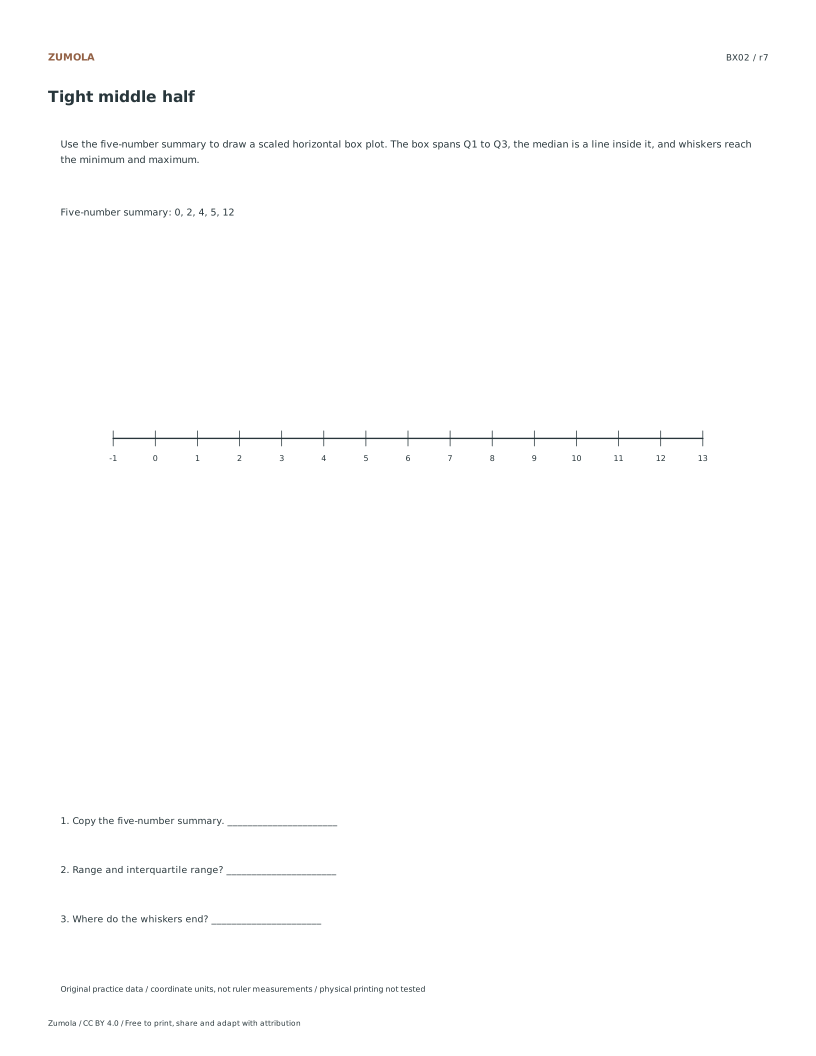
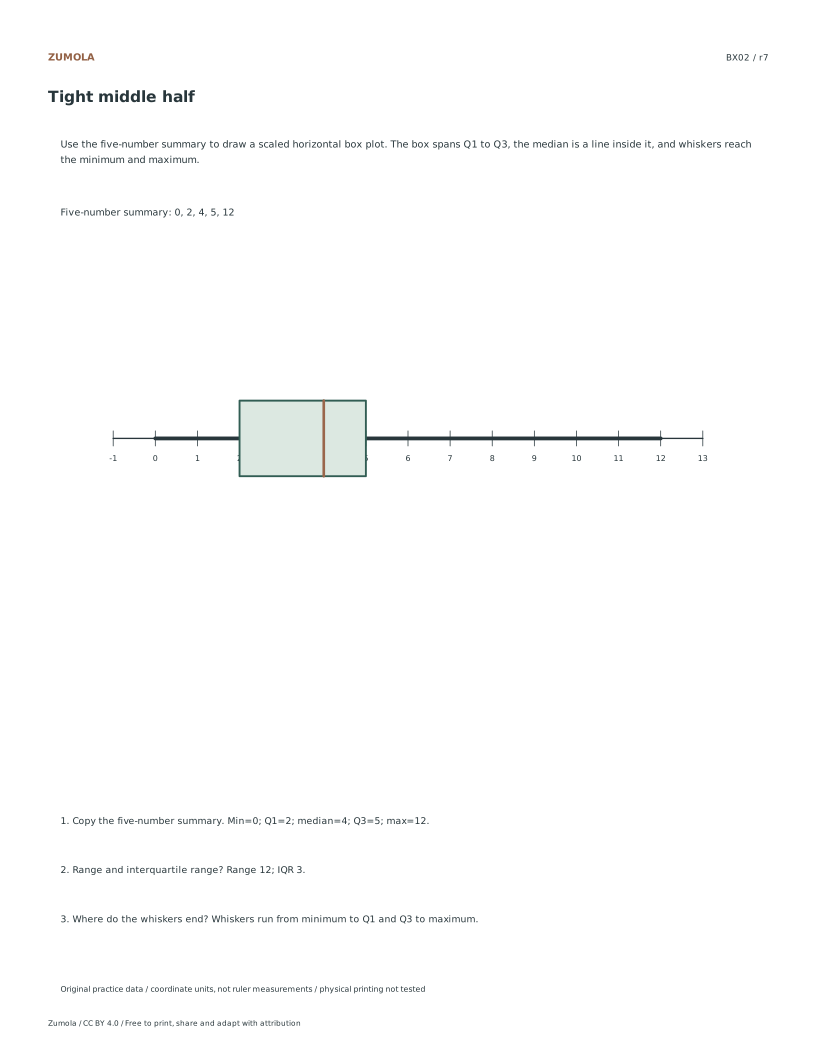
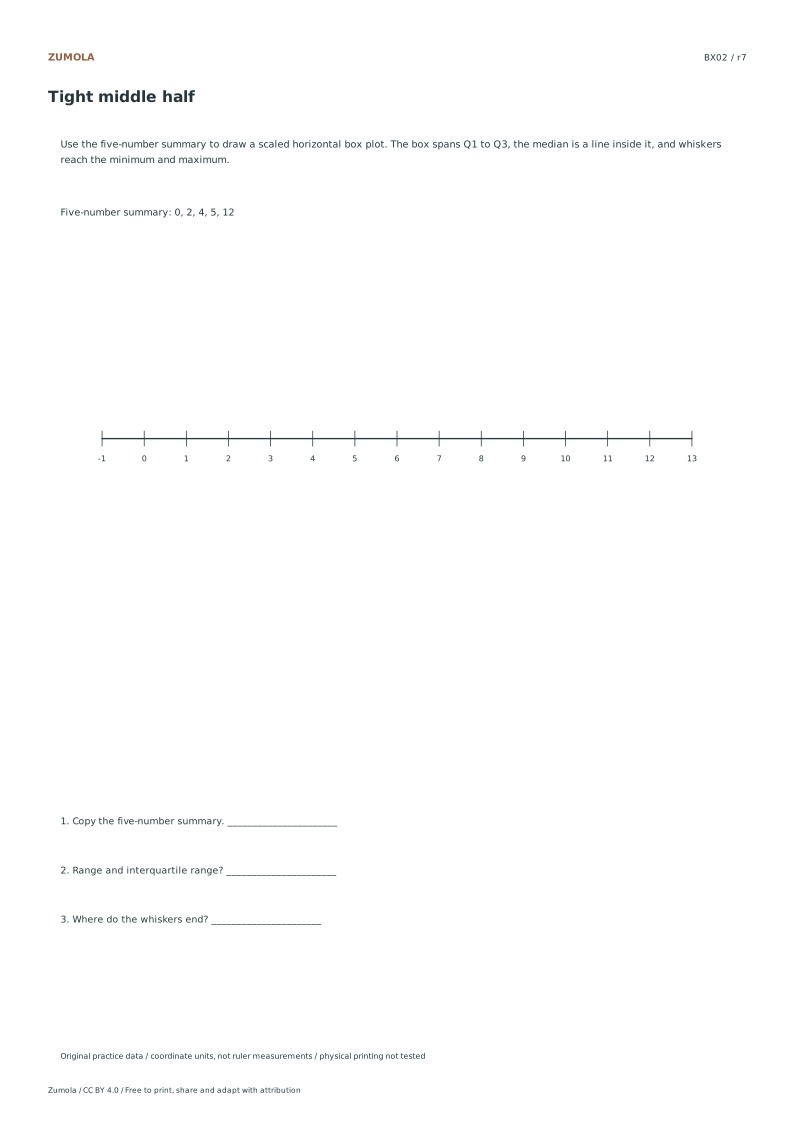
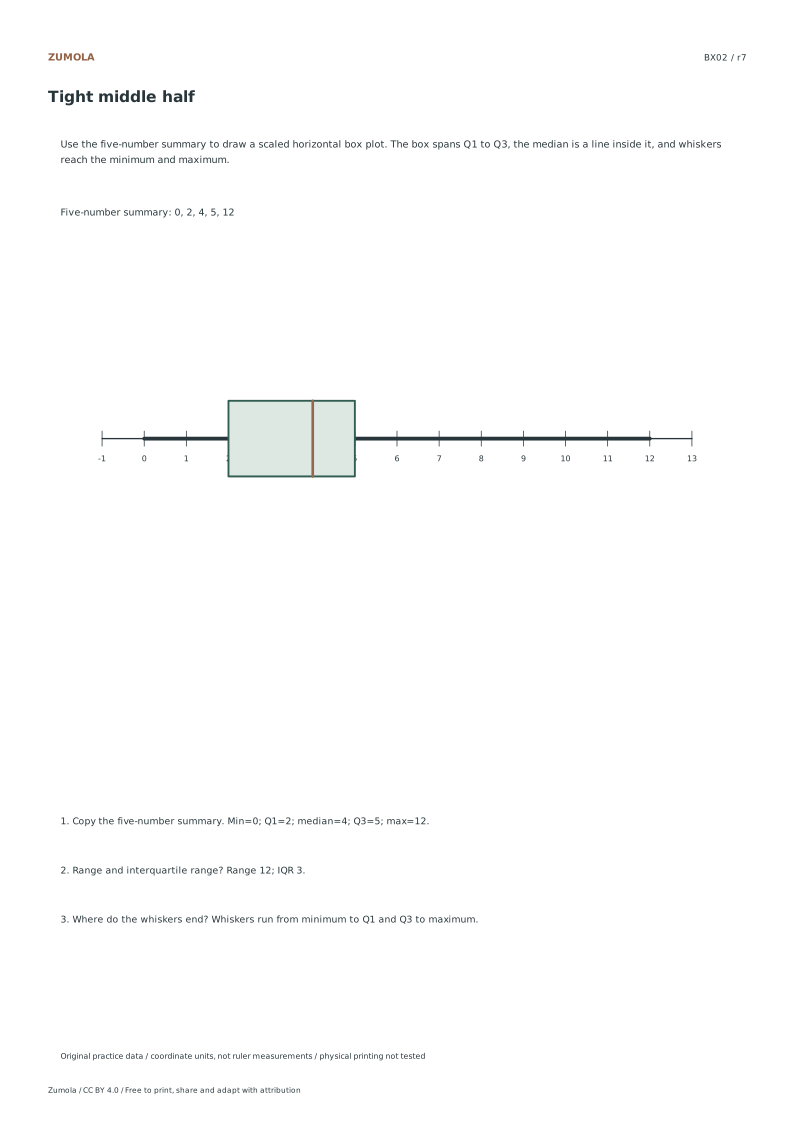
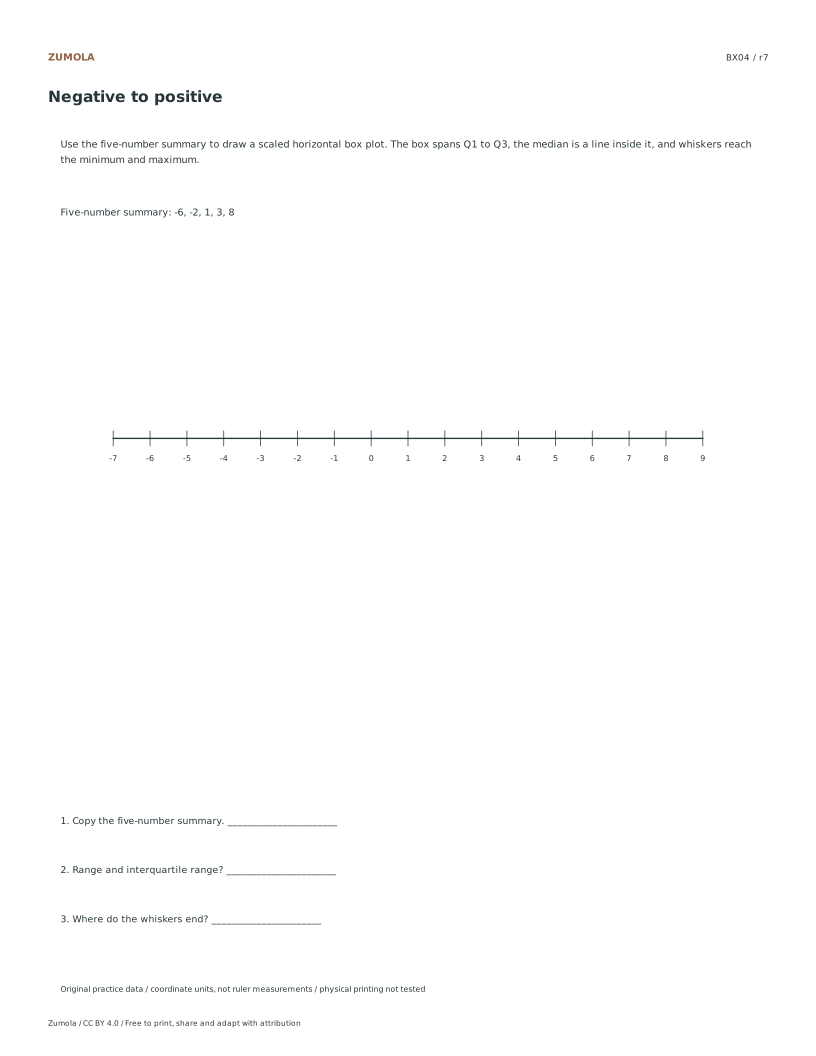
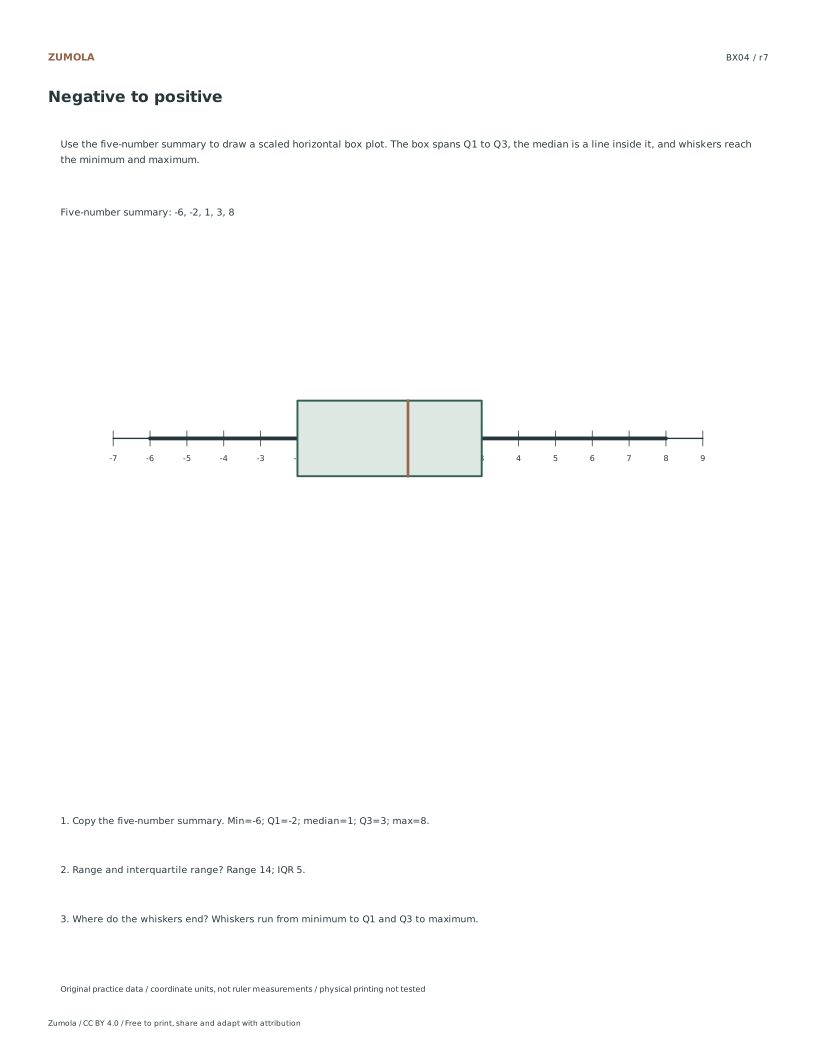
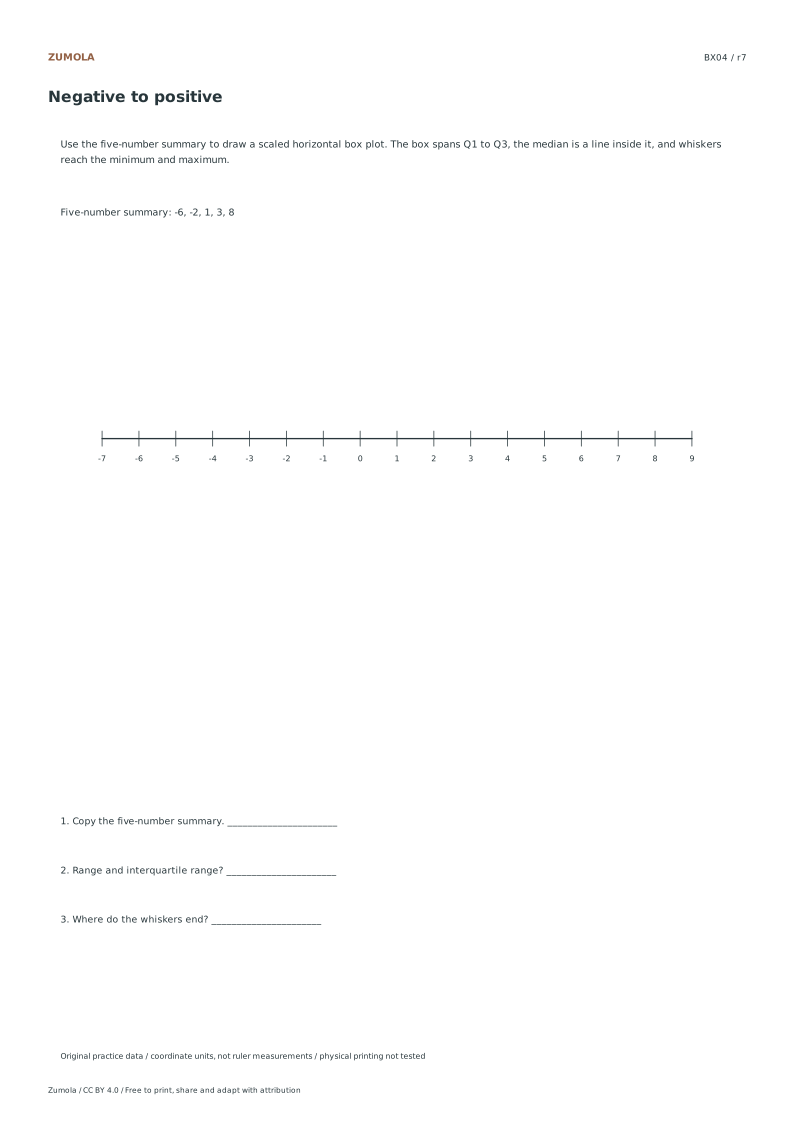
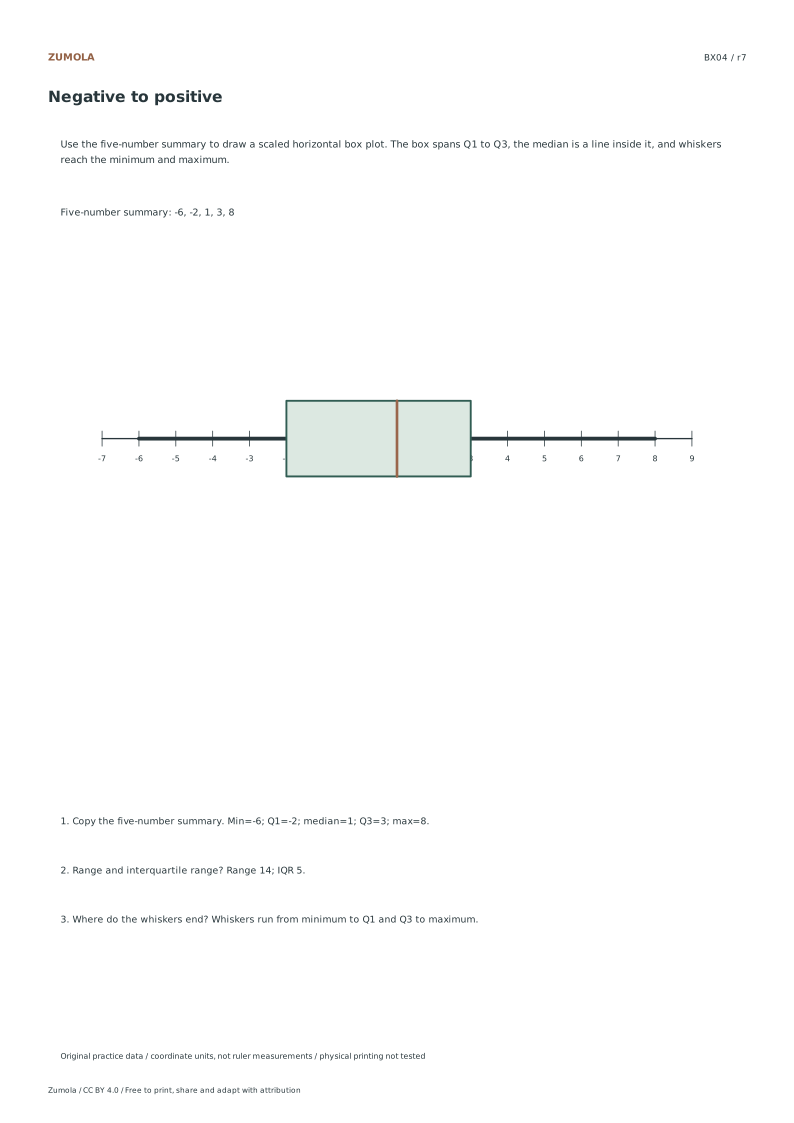
Show the five-number summary.
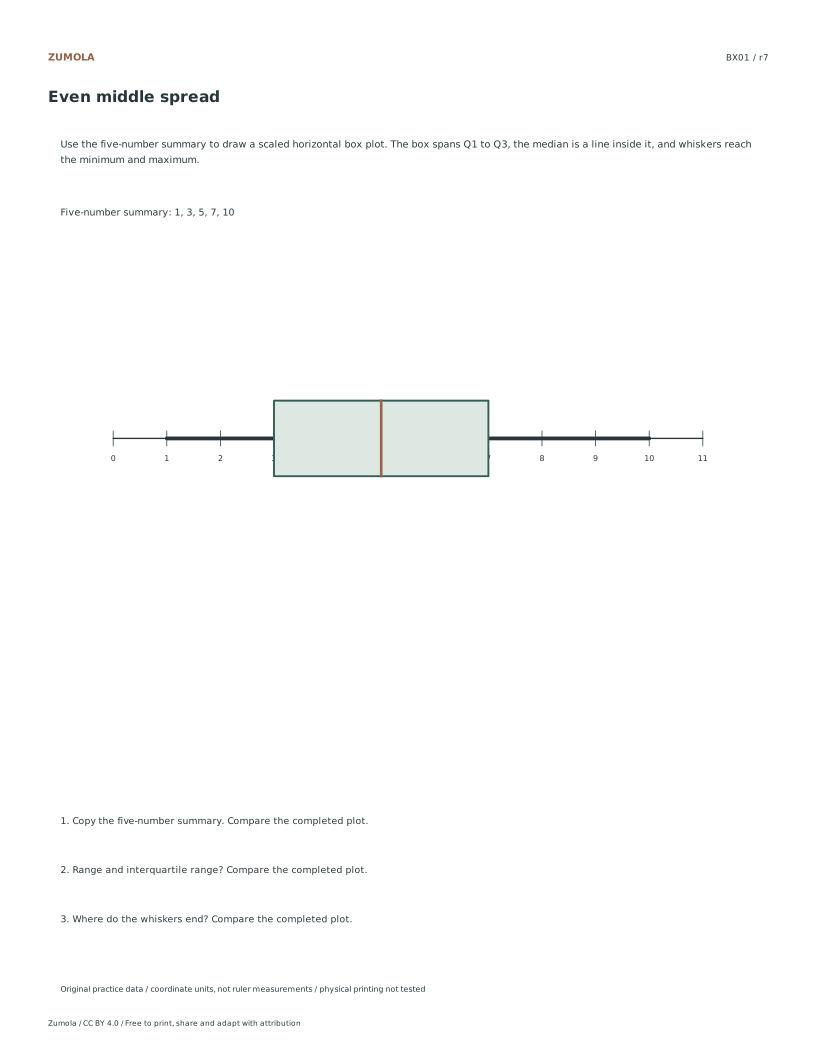
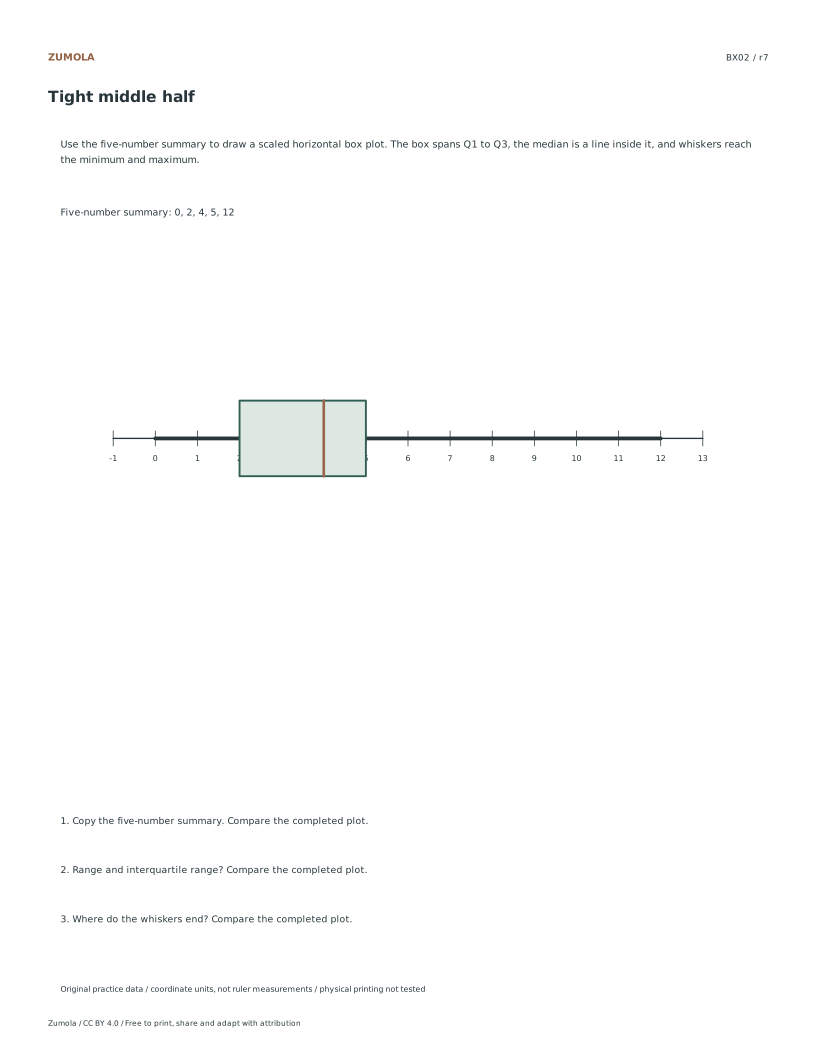
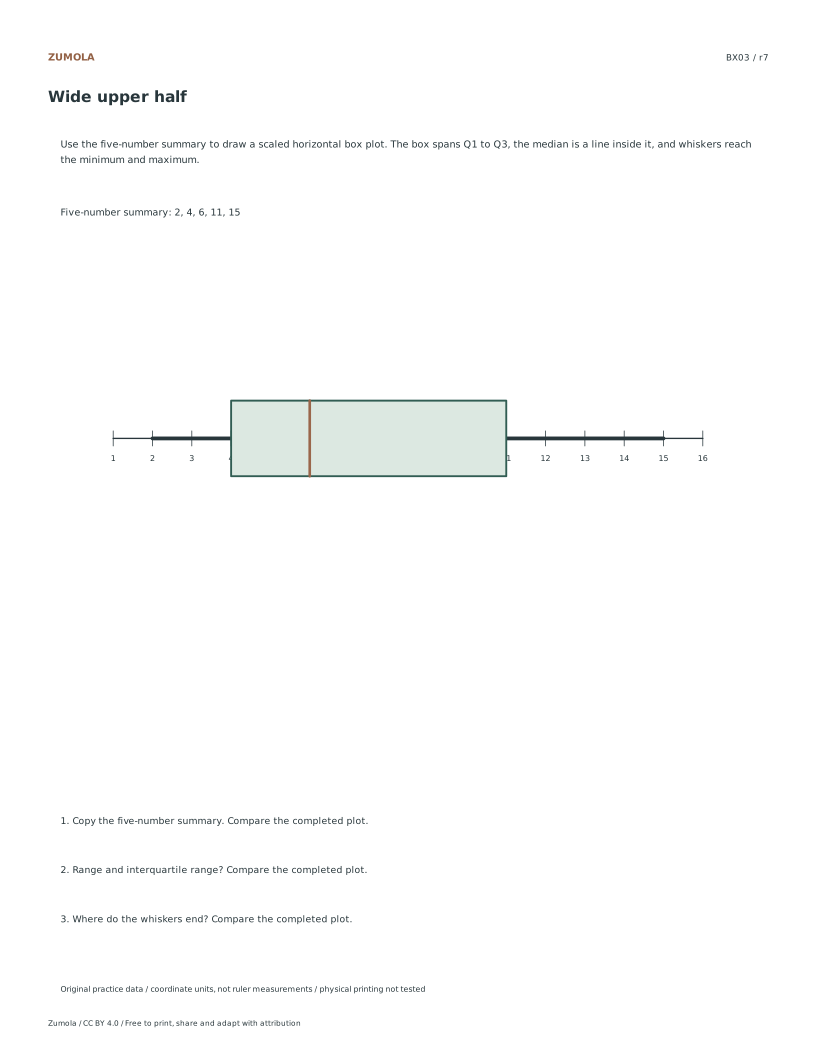
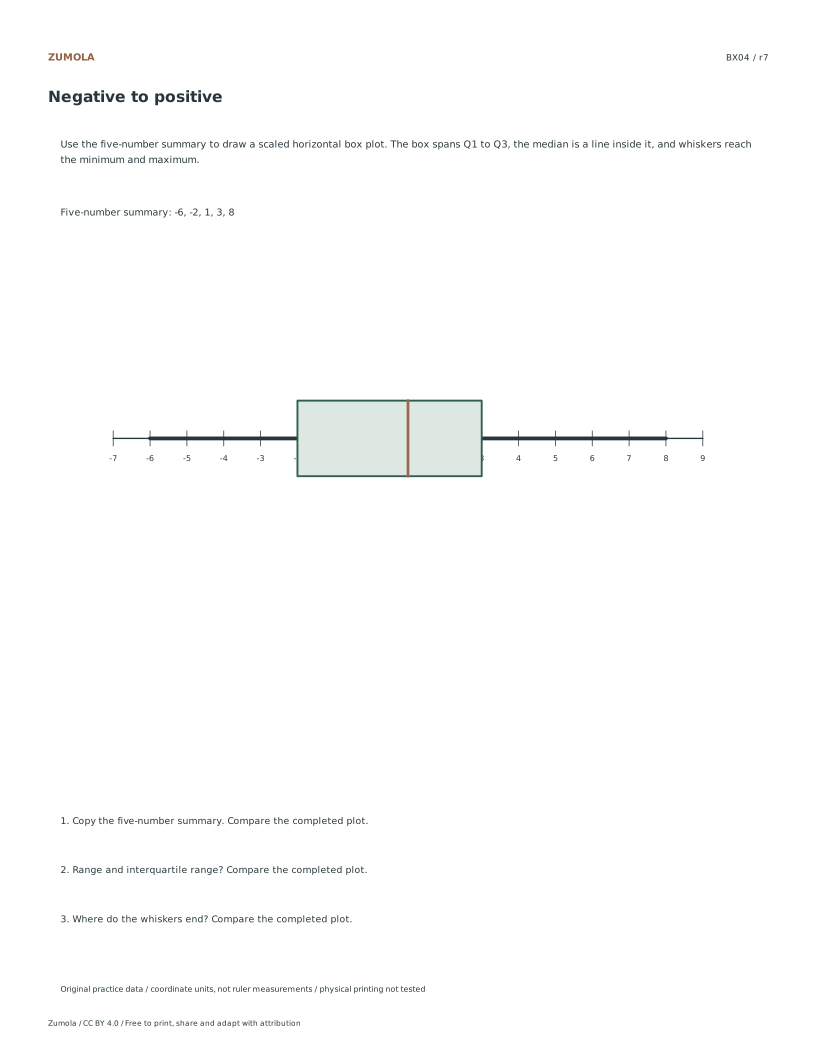
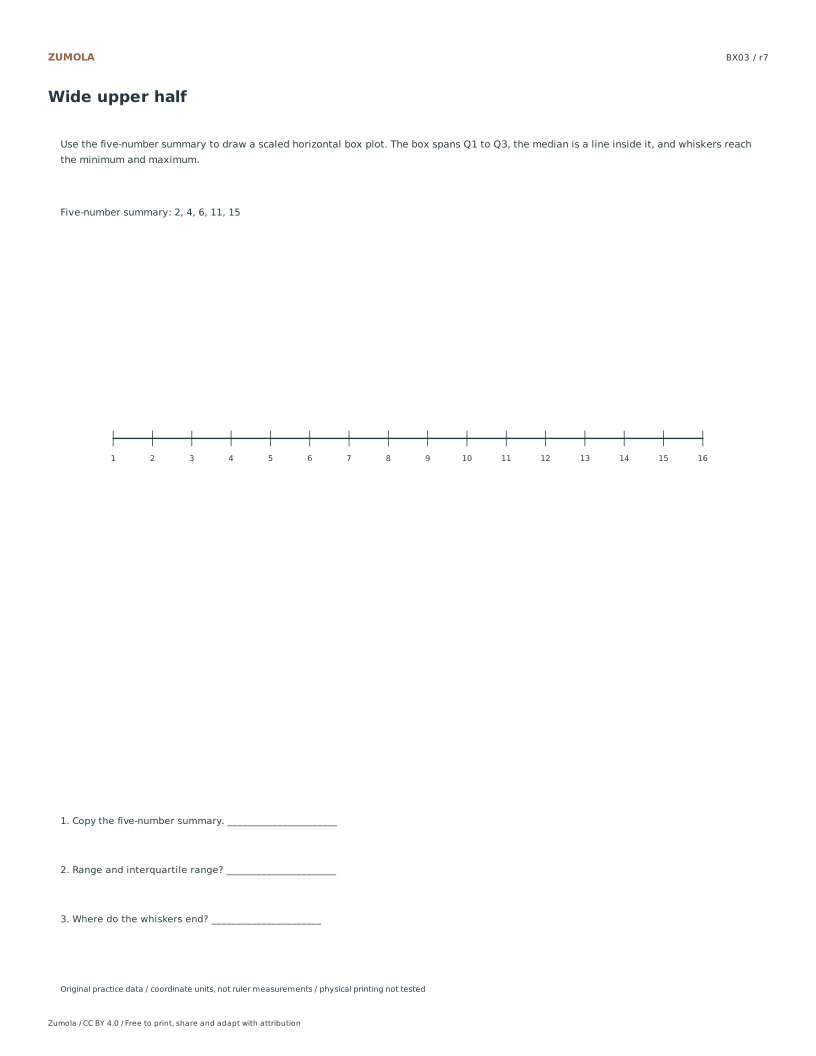
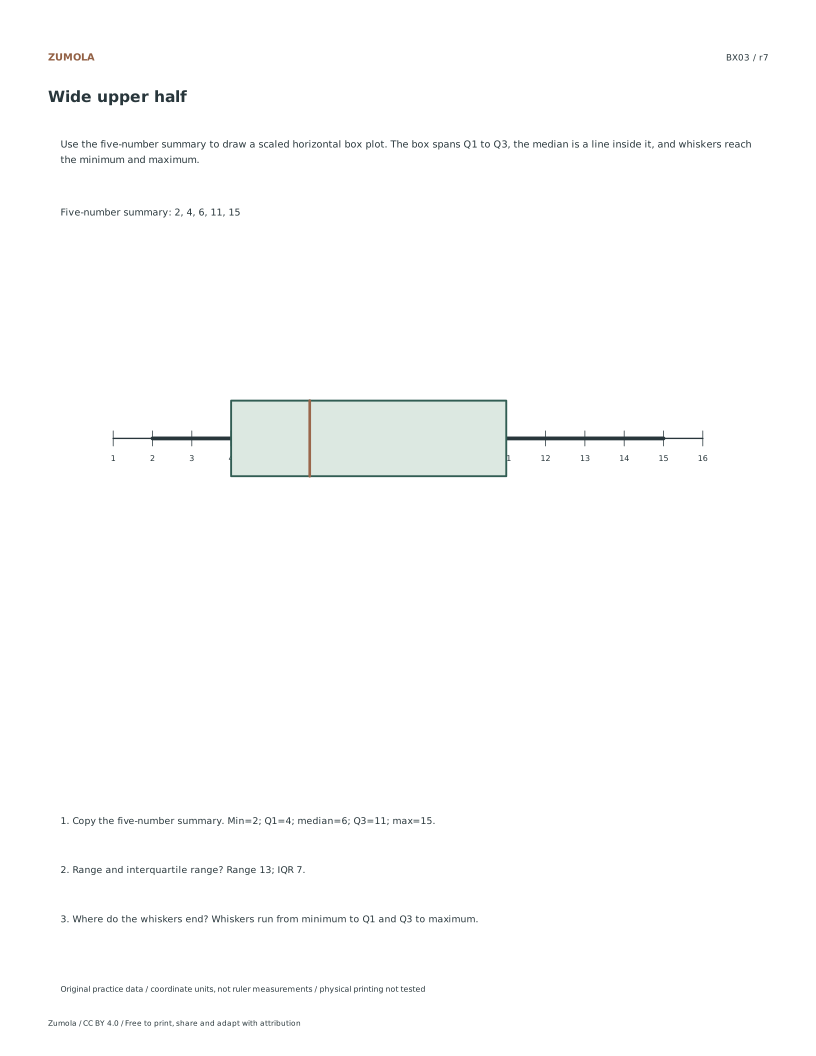
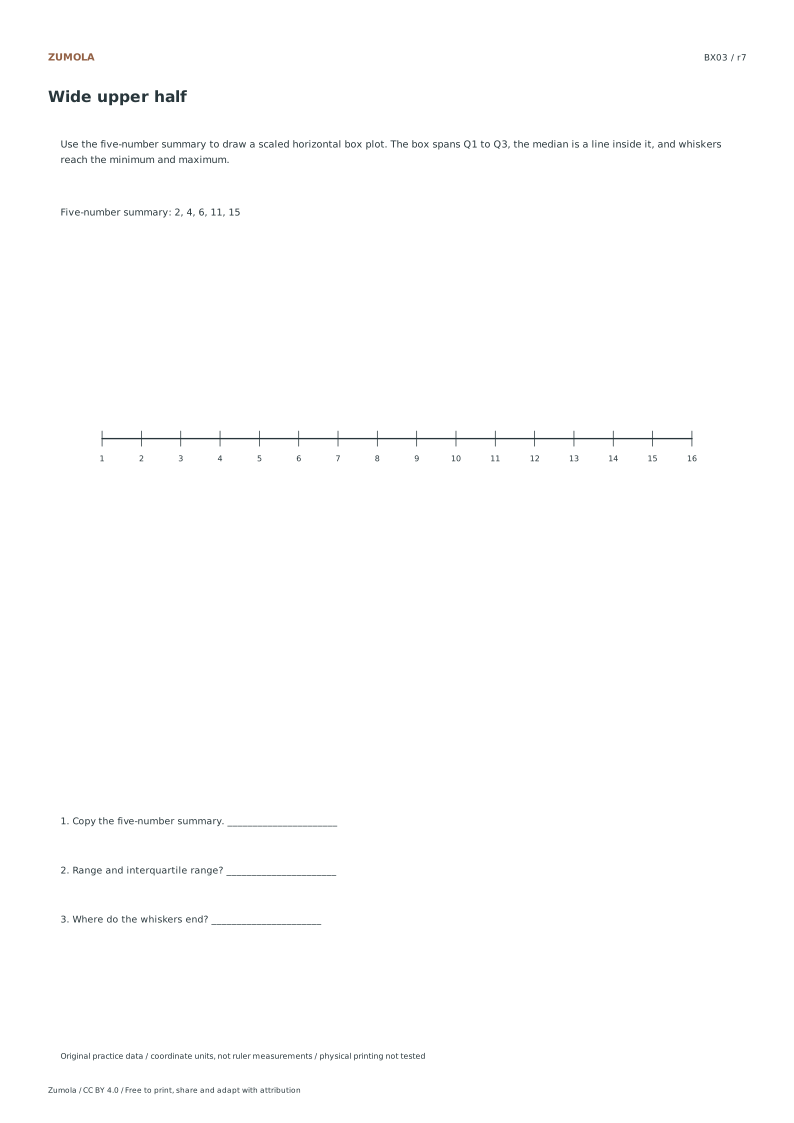
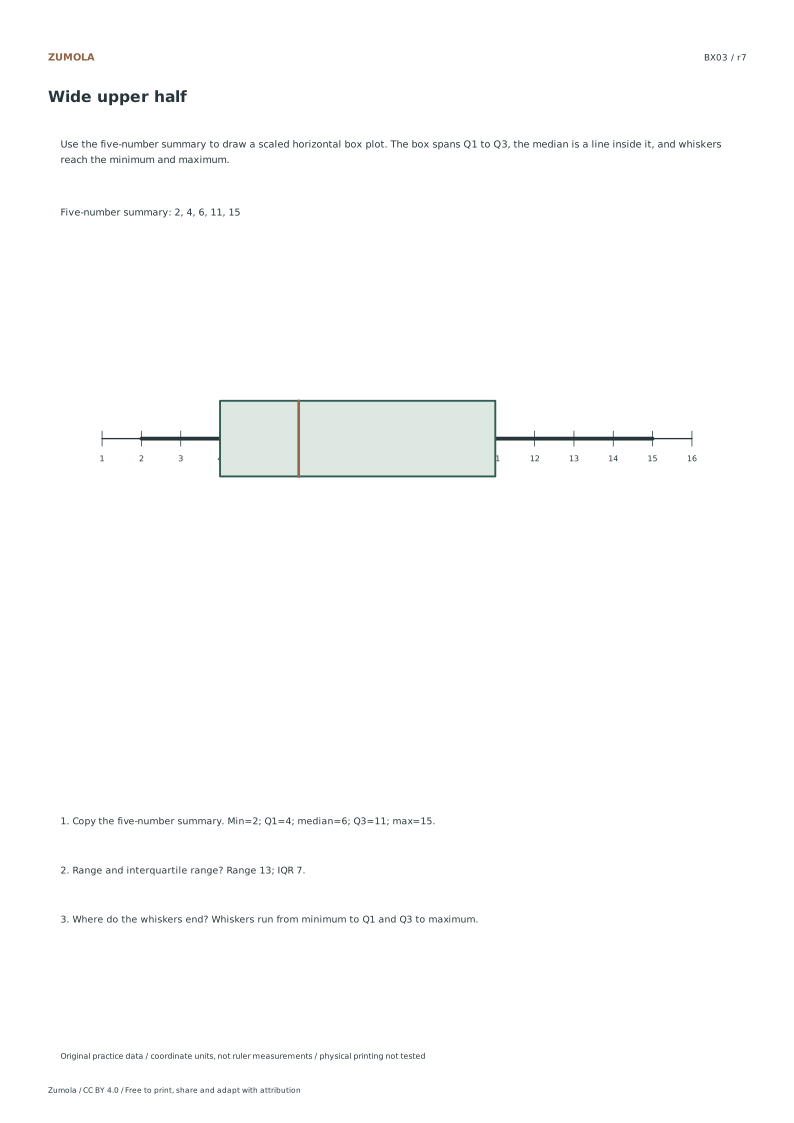
Draw four box plots from minimum, Q1, median, Q3 and maximum. Calculate range and IQR while keeping the supplied five-number summary visible.
4 box-plot cases.
Minimum, quartiles and maximum.
More ways to practice
Name the quartile method before plotting
Quartiles split ordered data into four groups, but there is more than one accepted convention. One common school method finds the median, then takes the median of the lower half and the median of the upper half; when the count is odd, the overall median is excluded from both halves. Another convention uses position formulas on the full ordered list. Both can be legitimate, but a worksheet answer must say which one it used, because Q1 and Q3 can differ by one data step.
Write the ordered list first, number the positions, and mark the median position. Then apply one stated rule consistently to every case on the page. If a value repeats, keep every copy; duplicates are data, not errors. Record Q1, median and Q3 as actual data values or as midpoints between two values, and say which.
The interquartile range is Q3 minus Q1. It measures the spread of the middle half only, so it ignores the tails. Report it in the same units as the data and keep the subtraction visible so a reader can recheck it.
- Sort all values ascending and number each position.
- Find the median; note whether the count is odd or even.
- Apply your declared quartile rule to locate Q1 and Q3.
- Compute IQR = Q3 − Q1 and label its units.
Apply one outlier rule and show the whisker logic
A common outlier test uses fences: lower fence = Q1 − 1.5 × IQR and upper fence = Q3 + 1.5 × IQR. Values strictly beyond a fence are flagged as outliers under that rule; values exactly on a fence are not. State the multiplier you used, because 1.5 is a convention, not a law.
Whiskers then reach the most extreme values that are not flagged, while flagged points are drawn separately. This keeps the box and whiskers describing the bulk of the data. If you choose to extend whiskers to the minimum and maximum instead, say so plainly and do not call distant points outliers.
Check that every original value is accounted for exactly once: inside the box region, on a whisker, or as a plotted outlier. A count that does not match the raw list signals a transcription slip.
- Compute both fences from your stated Q1, Q3 and IQR.
- Compare each extreme value with the fences, not with the median.
- Draw whiskers to the furthest non-flagged values on each side.
- Plot flagged values individually and total all accounted values.
Diagnostic checks after drawing
Read your finished plot back into a five-number summary and compare it with your calculation sheet. If the read-back differs, the drawing is wrong even when the arithmetic is right. Check axis scale: equal spacing between labelled ticks, and a range that includes outliers without crushing the box.
Label the axis with units and note the quartile convention and outlier multiplier beside the plot. A reader should be able to reconstruct your decisions without guessing. Where two valid conventions exist, a short note prevents a correct answer from looking wrong.
- Read minimum, Q1, median, Q3 and maximum off the drawing.
- Match each read-back value to the calculation sheet.
- Confirm tick spacing is uniform and units are labelled.
- Write the quartile rule and outlier multiplier near the plot.
Try this example
Data: 3, 5, 6, 8, 9, 11, 14, 15, 22. Use the rule that excludes the overall median from both halves, and flag outliers beyond 1.5 × IQR.
Show the worked explanation
Nine values, so the median is the 5th value, 9. Lower half: 3, 5, 6, 8, giving Q1 = (5 + 6) ÷ 2 = 5.5. Upper half: 11, 14, 15, 22, giving Q3 = (14 + 15) ÷ 2 = 14.5. IQR = 14.5 − 5.5 = 9. Lower fence = 5.5 − 13.5 = −8; upper fence = 14.5 + 13.5 = 28. No value lies beyond either fence, so no outliers are flagged. Whiskers reach 3 and 22. Five-number summary: 3, 5.5, 9, 14.5, 22. All nine values are accounted for.
Common mistakes
- Mixing quartile conventions between cases on one page. Declare one rule at the top and apply it to every case; note the rule beside each plot.
- Calling the minimum or maximum an outlier without computing fences. Calculate Q1 − 1.5 × IQR and Q3 + 1.5 × IQR, then compare each extreme value with the relevant fence.
- Dropping duplicate values while sorting. Keep every copy and number positions so the total count matches the raw list.
Check your work
- Ordered list is complete and duplicates are retained.
- Quartile convention is stated and applied consistently.
- Q1, median and Q3 are correct under the stated rule.
- IQR is computed as Q3 minus Q1 with units.
- Both fences are calculated from the stated multiplier.
- Whisker endpoints match the furthest non-flagged values.
- Flagged outliers, if any, are plotted separately.
- Axis ticks are evenly spaced and units are labelled.
- Read-back five-number summary matches the calculation sheet.
- Every original value is accounted for exactly once.
Questions before you start
Can two correct box plots of the same data look different?
Yes, when different quartile conventions or outlier multipliers are declared. The plots are comparable only if the stated rules match.
Is a value exactly on a fence an outlier?
Under the usual strict test, no. Only values beyond the fence are flagged; state this boundary explicitly.
What does the box actually show?
The box spans Q1 to Q3, so its width is the IQR and it covers the middle half of the ordered values, not the middle half of the axis.