Free original resources
Graphing Linear Inequalities: Solid vs Dashed Boundaries and Half-Planes
Learn to graph linear inequalities by choosing a solid or dashed boundary line, testing a point to pick the correct half-plane, and checking intercepts and endpoints.
Free resources
Letter & A4
PDF & SVG
Letter & A4
PDF & SVG
Make it yours.
Free · no signup · calculated in your browser
Your free printable kit.
Original reference, student practice and separate worked answers. No account or payment.
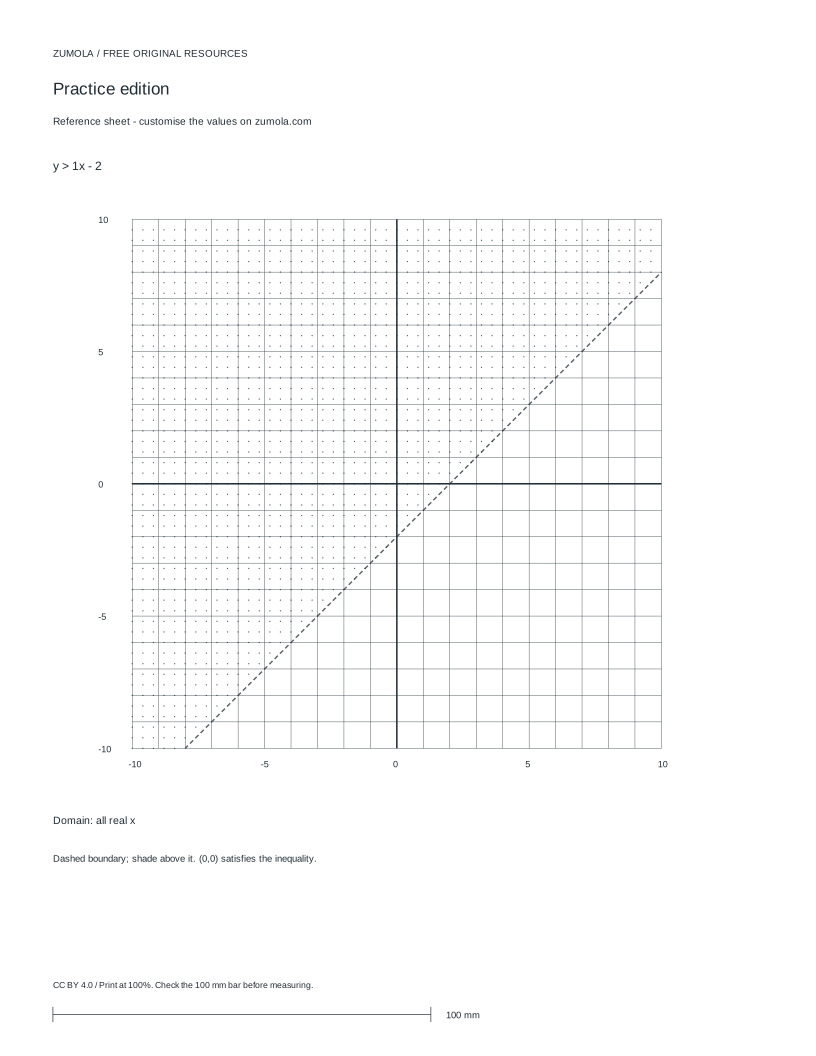
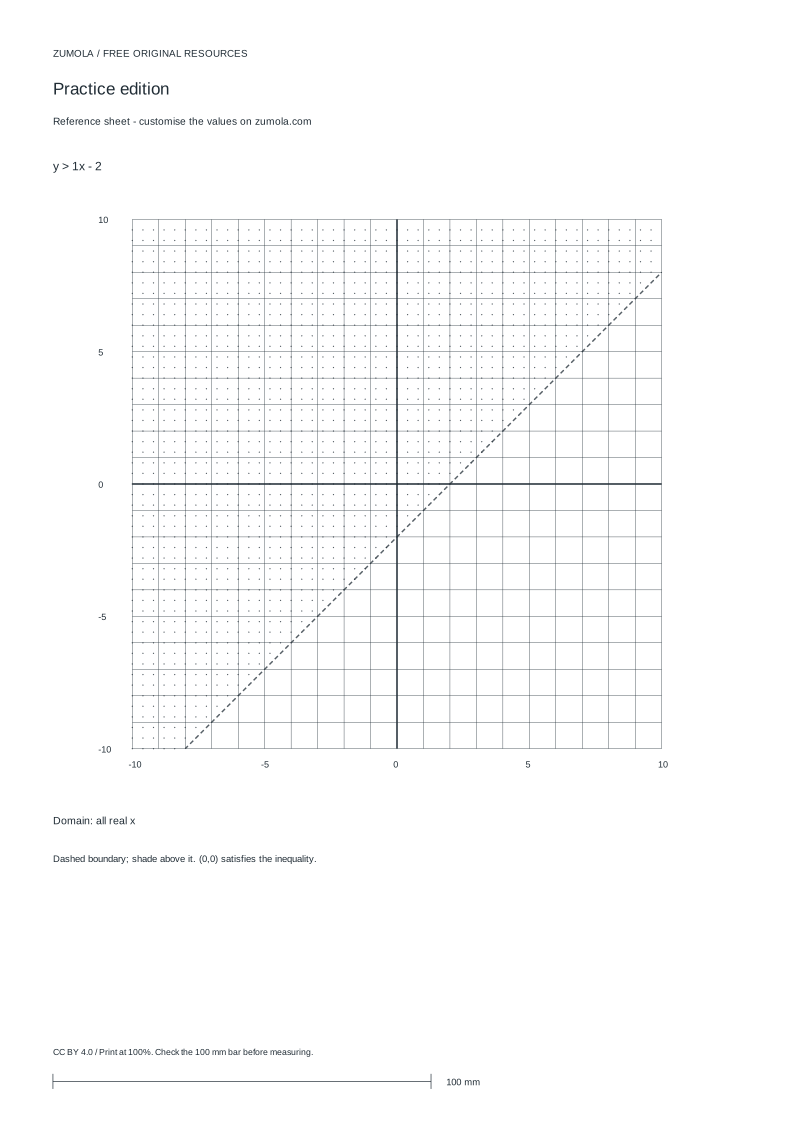
Practice worksheet
Worked answers / rubric
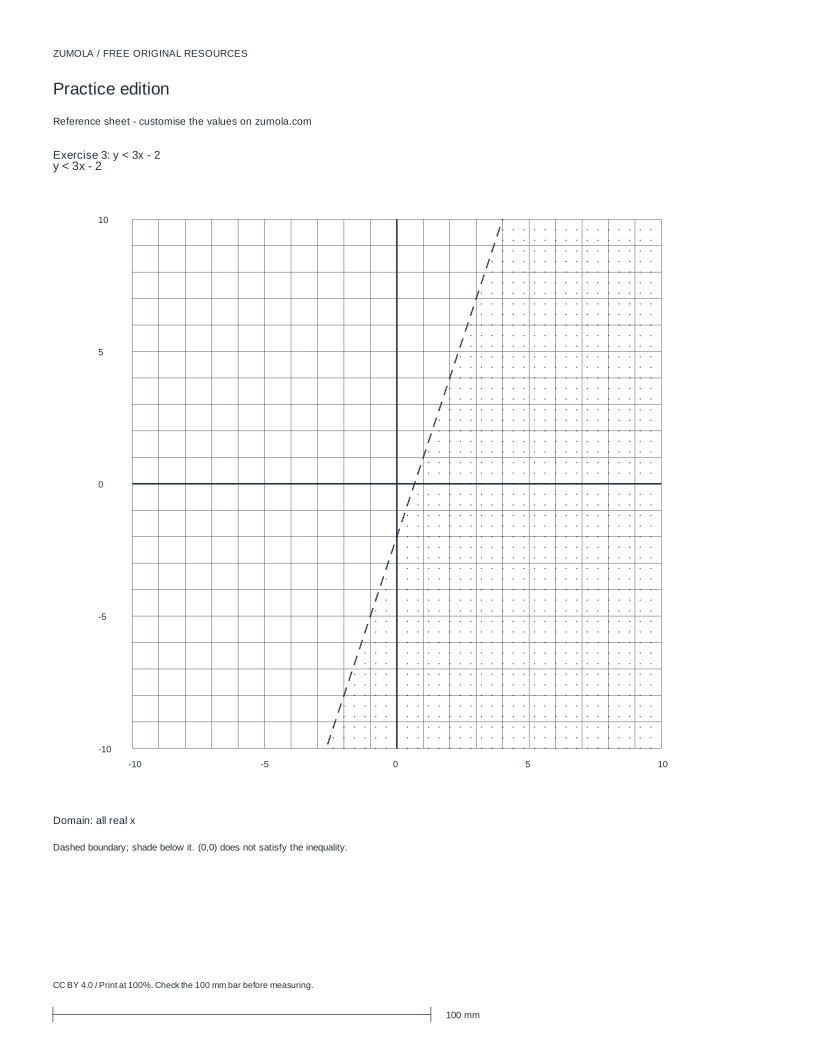
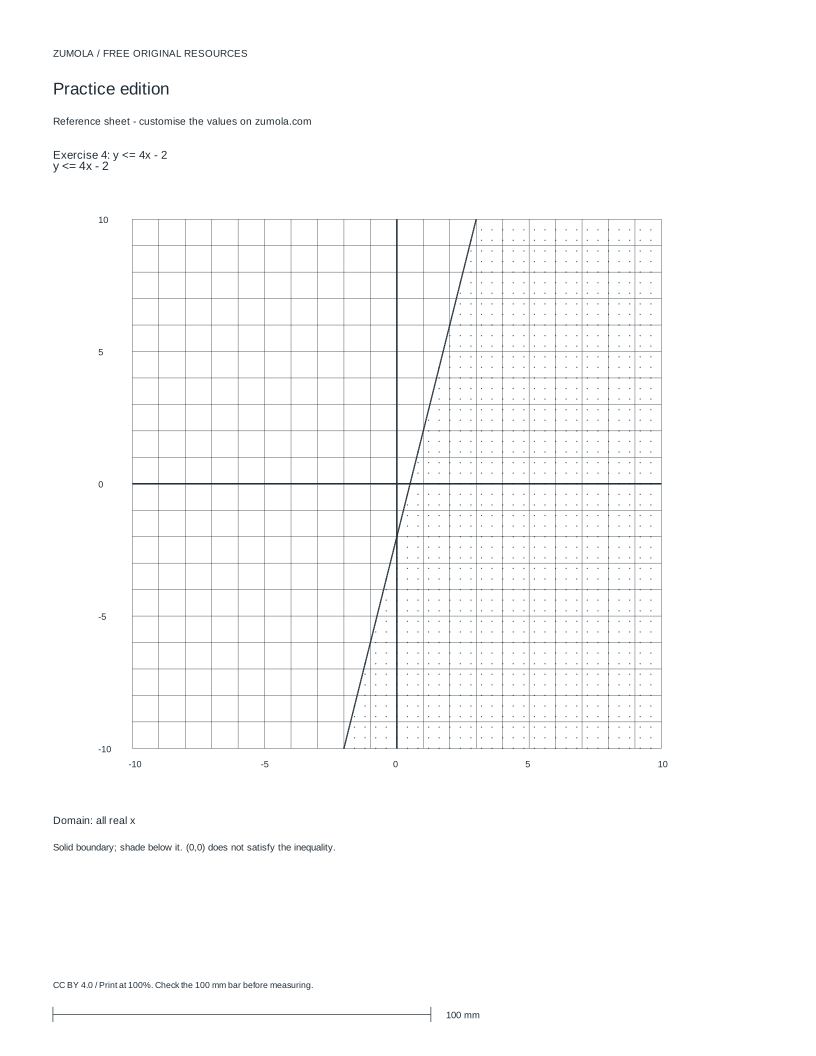
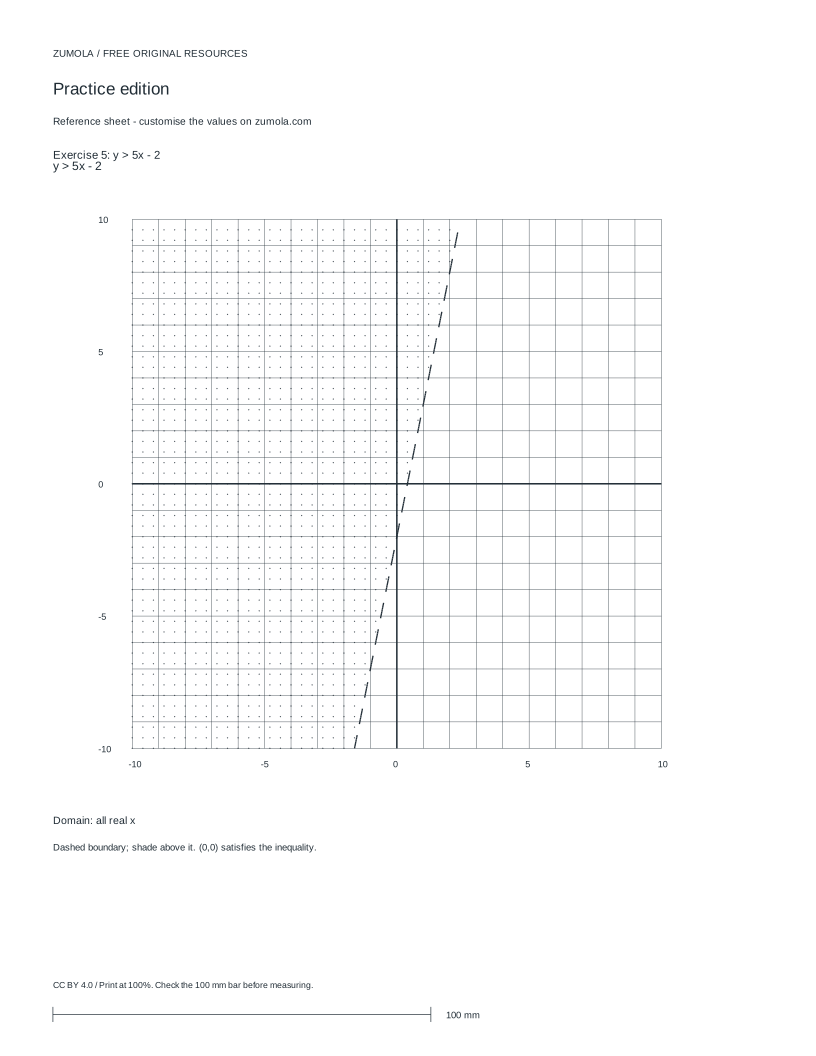
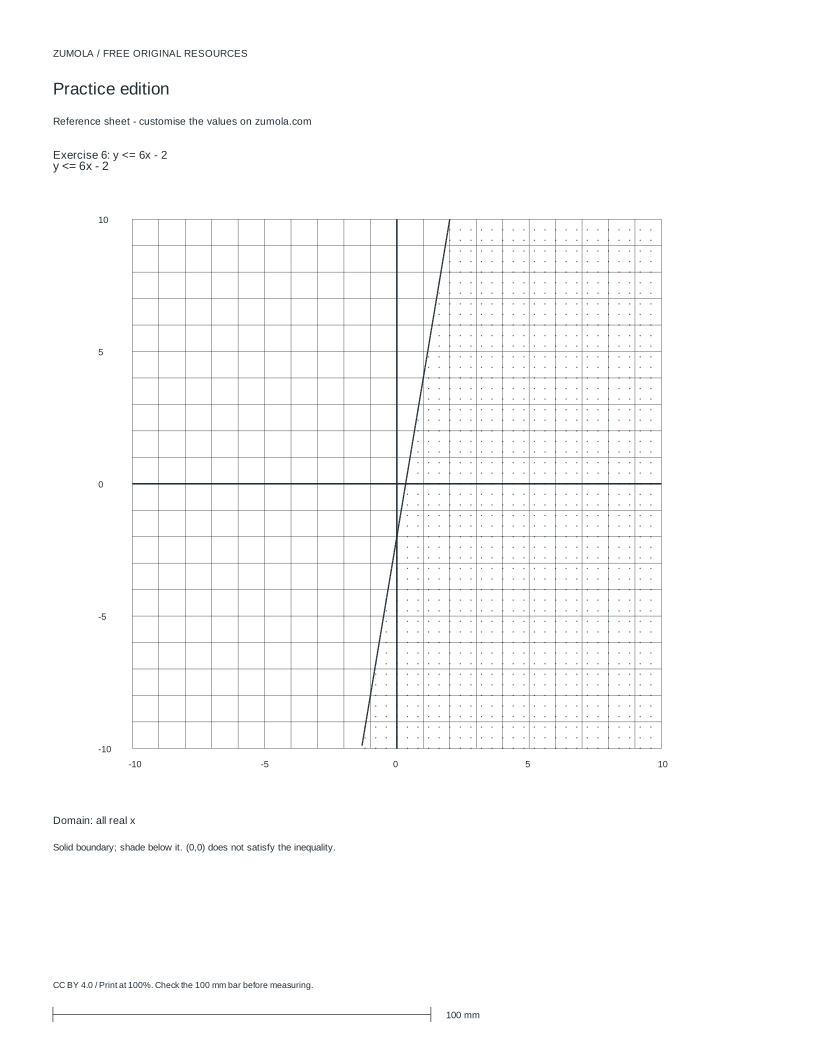
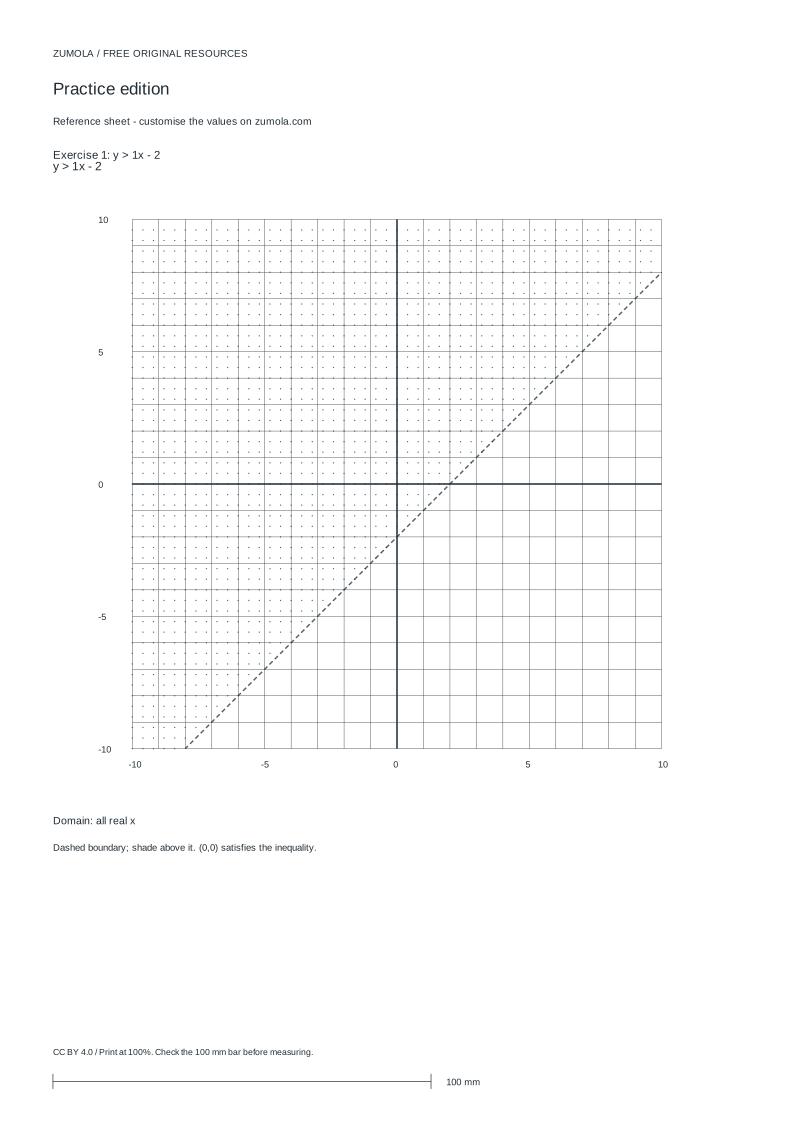
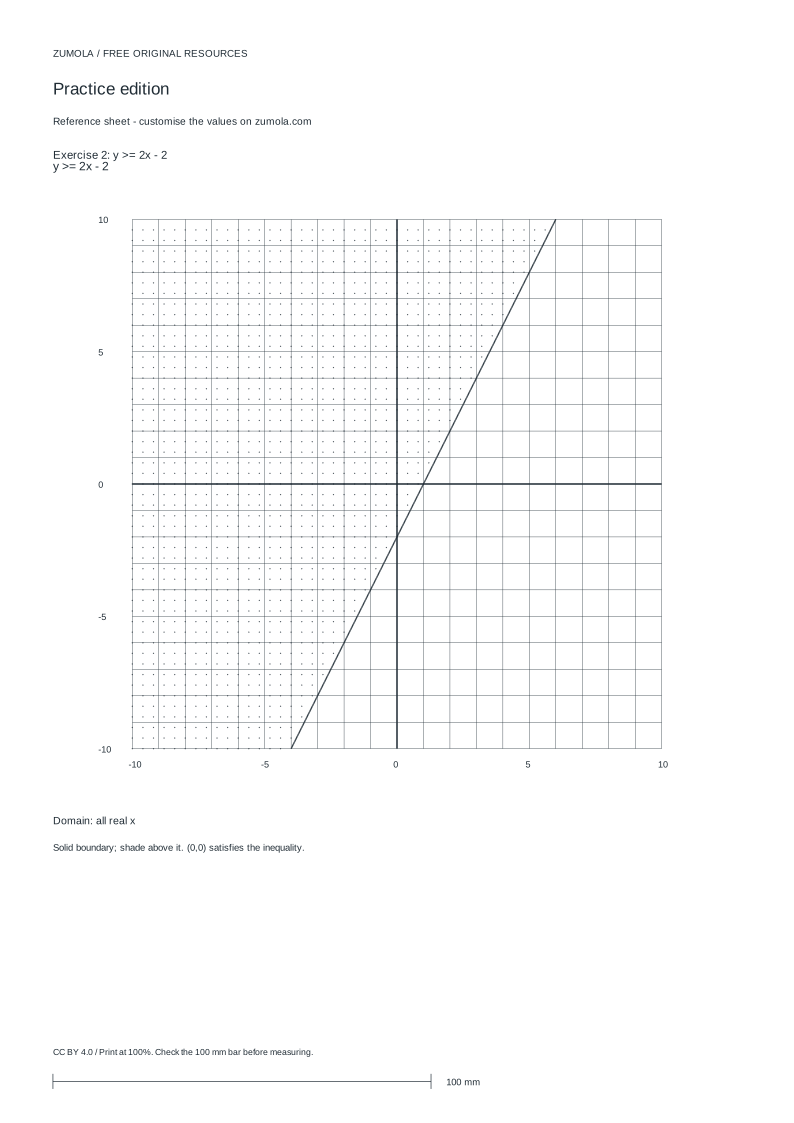
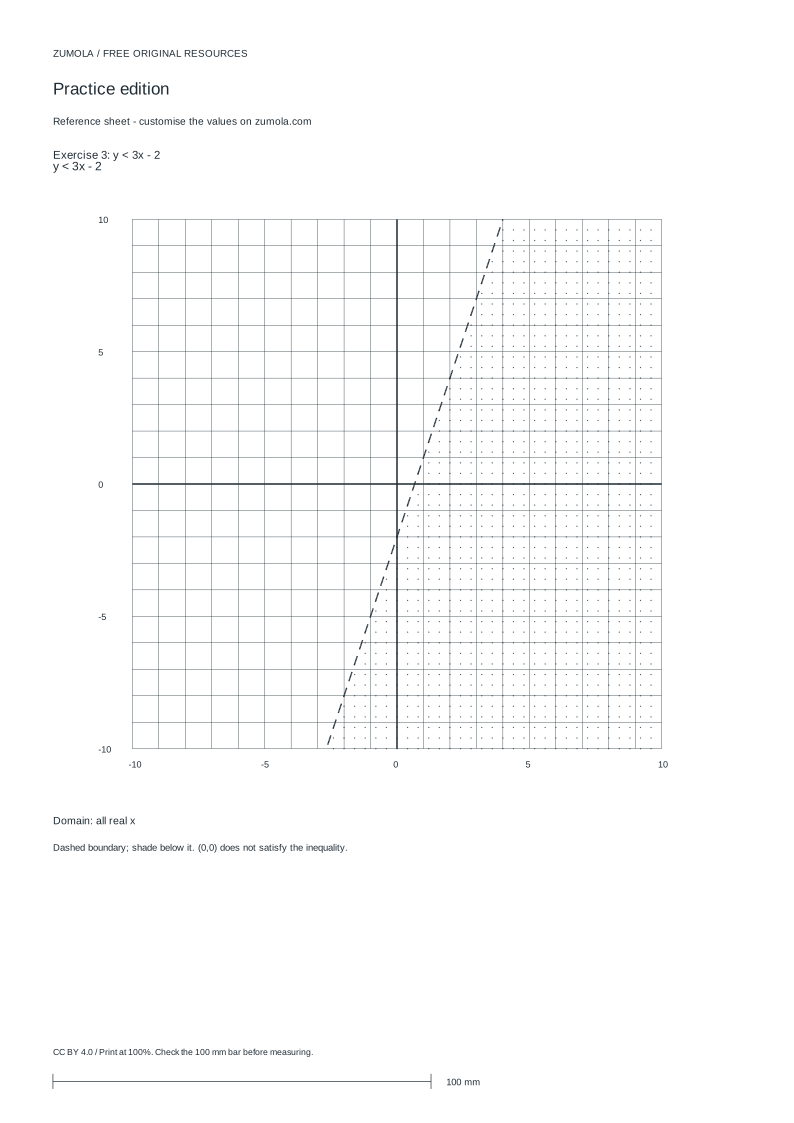
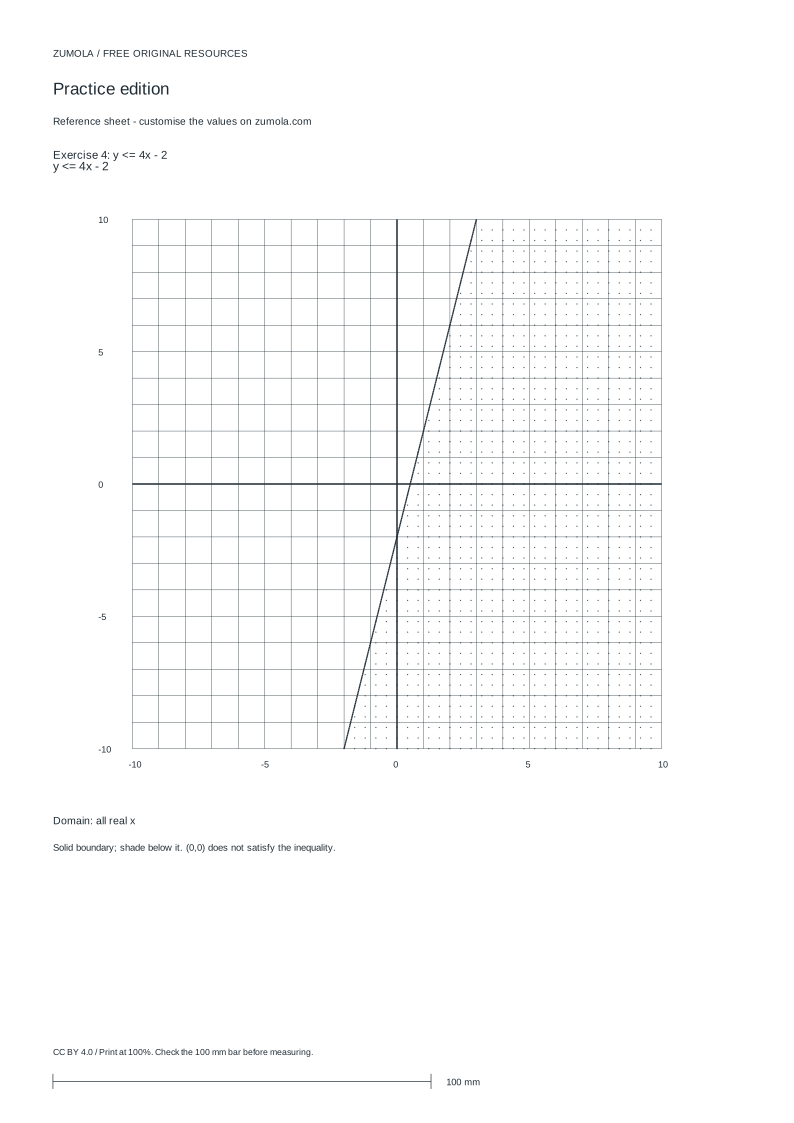
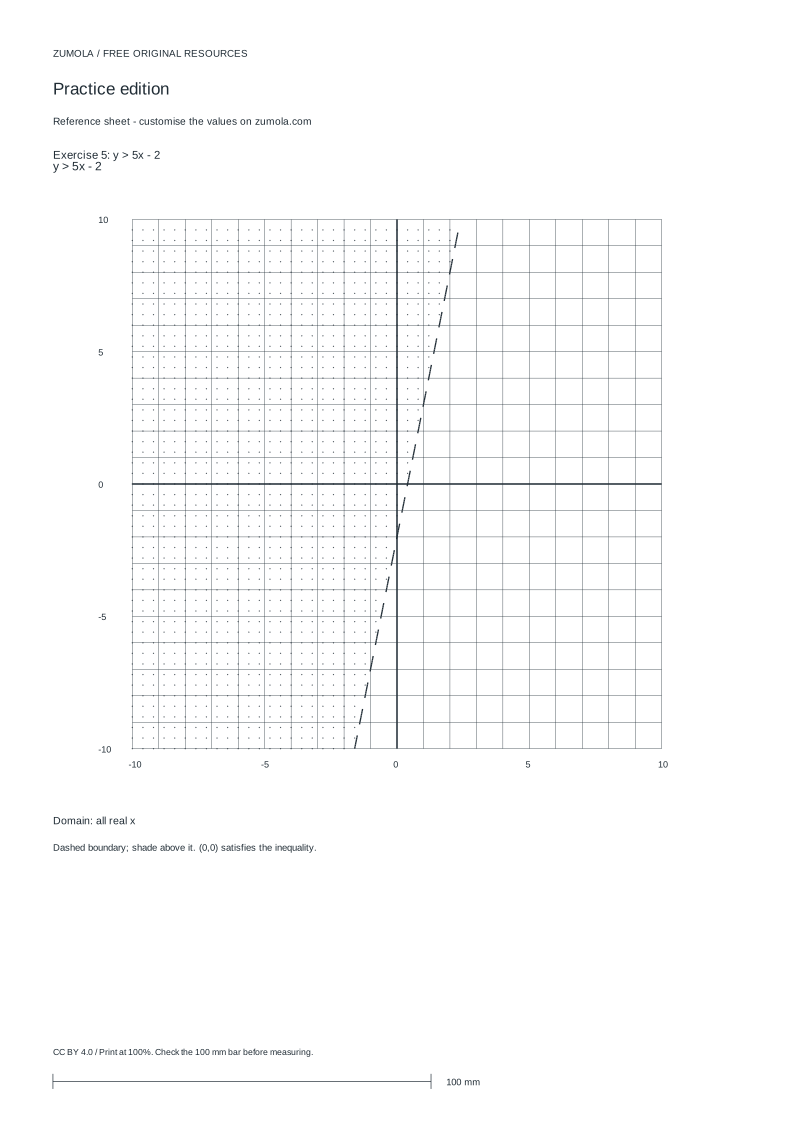
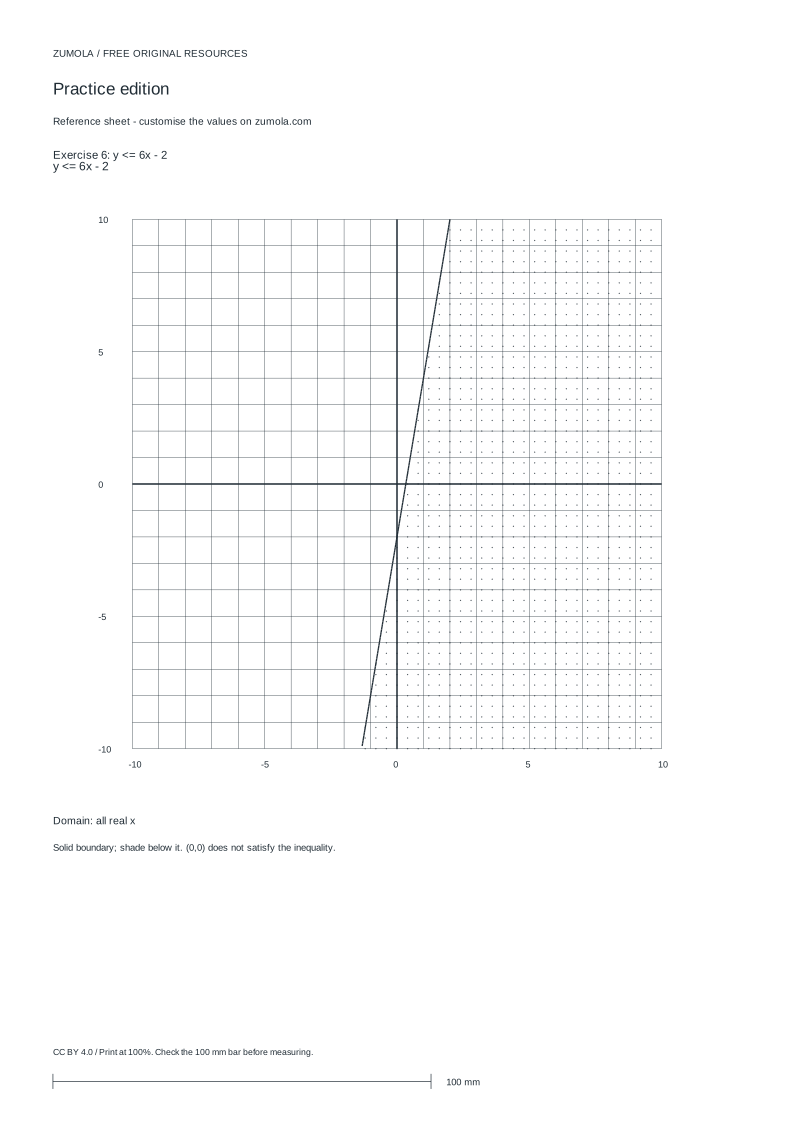
Print at Actual size / 100%. Check the calibration bar before using physical dimensions.
A linear inequality describes a whole region of the coordinate plane, not a single line. The boundary line marks where the two sides are equal, and the shading shows every point that makes the inequality true. This page explains how to decide whether the boundary is solid or dashed, how to choose which side to shade, and how to verify your graph by substituting a test point. All coordinates are abstract units on a schematic grid.
Read the inequality before you draw
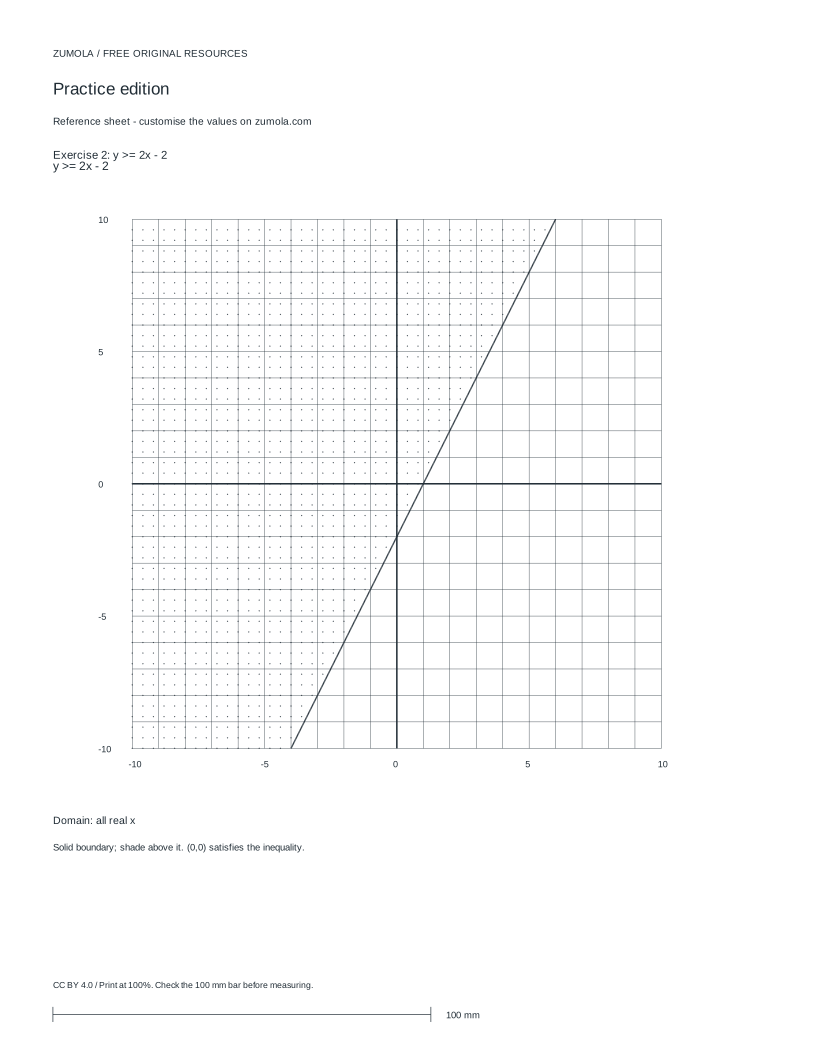
Start by rewriting the inequality so y is isolated, for example y > x - 2 or y ≤ -2x + 3. The boundary line is the equation you get by replacing the inequality sign with an equals sign. If the symbol is strict, meaning < or >, the boundary is dashed because points on the line do not satisfy the inequality. If the symbol includes equality, meaning ≤ or ≥, the boundary is solid because points on the line do satisfy it.
Identify the slope and intercept from the isolated form. For y > x - 2, the slope is 1 and the y-intercept is -2. Plot the intercept, then use the slope to find a second point, such as moving up 1 and right 1 to reach (1, -1). Draw the boundary through those points with the correct line style before shading anything.
- Rewrite the inequality with y alone on one side.
- Replace the inequality sign with an equals sign to get the boundary equation.
- Choose dashed for < or > and solid for ≤ or ≥.
- Plot the y-intercept and use the slope to locate a second point.
- Draw the boundary line across the grid.
Choose the half-plane with a test point
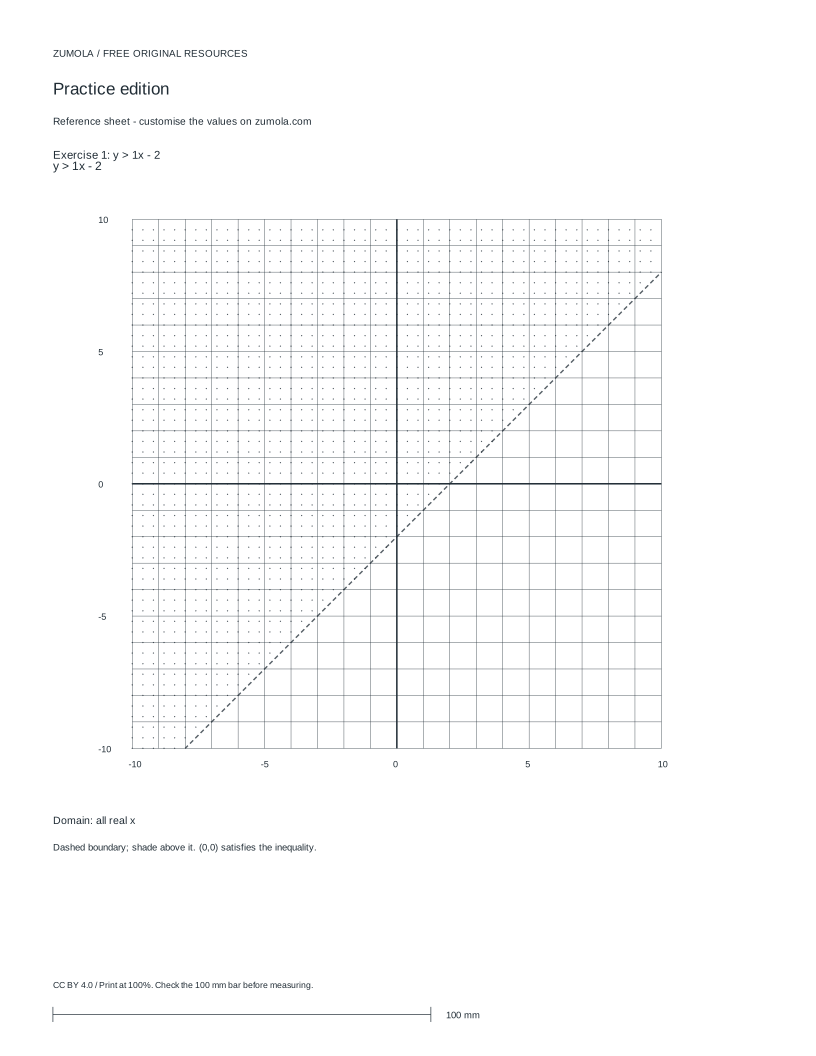
Pick a point that is not on the boundary, usually (0, 0) when it is convenient. Substitute its coordinates into the original inequality. If the result is true, shade the side containing that point. If it is false, shade the opposite side. For y > x - 2, substituting (0, 0) gives 0 > -2, which is true, so shade above the dashed line.
When the boundary passes through the origin, choose a different test point such as (1, 0) or (0, 1). Always substitute into the inequality as written, not into the boundary equation, because the boundary equation is always true on the line and cannot tell you which side to shade.
For systems, graph each inequality separately and shade only the region where all shaded areas overlap. A point in the overlap must satisfy every inequality, so test it in each one.
- Choose a test point not on the boundary line.
- Substitute both coordinates into the original inequality.
- Shade the side where the test point lies if the result is true.
- Shade the opposite side if the result is false.
- For systems, keep only the overlap of all shaded regions.
Check intercepts, endpoints, and domain assumptions
After shading, verify two boundary points by substitution. For y > x - 2, the intercept (0, -2) and the point (2, 0) both lie on the boundary. Because the inequality is strict, neither point should satisfy it: 0 > -2 is false and 0 > 0 is false. That confirms the dashed style. If the inequality were y ≥ x - 2, both points would satisfy it and the line would be solid.
State the domain assumption explicitly. For a linear inequality in two variables, x and y are usually allowed to be any real numbers, so the shaded region extends indefinitely. If a problem restricts x or y to nonnegative values, the graph is limited to that part of the plane, and the boundary endpoints may need open or closed treatment depending on whether the restriction includes equality.
Do not treat a blank coordinate grid as an answer. A finished response includes the boundary style, the shaded region, and at least one substituted check point.
- Substitute a boundary intercept to confirm the line style.
- Substitute a second boundary point to confirm the inequality direction.
- State whether x and y are unrestricted or limited.
- Mark open or closed endpoints when a domain restriction applies.
- Record one test point and its substitution as evidence.
Worked example and common confusions
Consider y > x - 2 with all real x and y. The boundary is y = x - 2, drawn dashed because the symbol is strict. The intercept is (0, -2) and the slope is 1, so a second point is (1, -1). Testing (0, 0) gives 0 > -2, true, so shade above the line. Checking boundary points (0, -2) and (2, 0) gives false results, confirming the dashed boundary.
A frequent error is shading below because the intercept is negative. The sign of the intercept does not decide the side; only the test-point substitution does. Another error is using a solid line for > or <, which wrongly includes boundary points that do not satisfy the inequality. A third error is testing a point on the boundary, which always gives equality and cannot distinguish the two sides.
- Write the boundary equation and its line style.
- Plot two boundary points using intercept and slope.
- Substitute a test point and shade the correct side.
- Check two boundary points to confirm the style.
- Label the shaded region and the test point.
Practice task
Graph y ≤ -2x + 3 with all real x and y. Decide the boundary style, plot two points, choose a test point, shade the correct half-plane, and verify with a boundary point. Then explain in one sentence why your boundary is solid or dashed.
- Isolate y and identify the boundary equation.
- Decide solid or dashed from the inequality symbol.
- Plot the intercept and a second point from the slope.
- Test a point and shade the correct side.
- Verify with a boundary point and state the domain.
How to judge a finished graph
Use the rubric below to review any graphing linear inequalities worksheet response. The rubric focuses on the reasoning and the checks, not on matching a single picture, because shading can be drawn in different styles while still being correct.
- Confirm the boundary equation matches the inequality.
- Confirm the line style matches the symbol.
- Confirm the shaded side matches the test point.
- Confirm at least one boundary check is shown.
- Confirm the domain assumption is stated.
Try this example
Graph y > x - 2 for all real x and y. State the boundary style, two boundary points, a test point, and the shaded side.
Show the worked explanation
The boundary is y = x - 2, dashed because the symbol is strict. The y-intercept is (0, -2); using slope 1 gives (1, -1) and (2, 0). Test (0, 0): 0 > 0 - 2, so 0 > -2, which is true, so shade above the line. Check boundary point (0, -2): 0 > -2 is false, confirming the dashed style. The region extends indefinitely because x and y are unrestricted.
Common mistakes
- Using a solid boundary for a strict inequality such as y > x - 2. Replace the symbol with an equals sign to draw the boundary, but keep it dashed whenever the original symbol is < or >.
- Shading below a line because the y-intercept is negative. Ignore the sign of the intercept and substitute a test point such as (0, 0) into the original inequality to choose the side.
- Testing a point that lies on the boundary line. Choose a point clearly off the line, such as (0, 0) or (1, 0), so the substitution gives a strict true or false result.
Check your work
- Boundary equation correctly derived from the inequality.
- Line style matches the inequality symbol: dashed for strict, solid for inclusive.
- At least two boundary points plotted accurately from intercept and slope.
- Test point is off the boundary and substituted into the original inequality.
- Shaded half-plane matches the test-point result.
- At least one boundary point is checked to confirm the line style.
- Domain assumption for x and y is stated explicitly.
- For systems, only the overlap of all shaded regions is kept.
Questions before you start
How do I know whether the boundary line is solid or dashed?
Use a dashed line for < and > because boundary points do not satisfy the inequality. Use a solid line for ≤ and ≥ because boundary points do satisfy it.
What if the test point gives a false result?
Shade the side opposite the test point. A false substitution means the chosen point is not in the solution region, so the correct region is on the other side of the boundary.
How do I graph a system of linear inequalities?
Graph each boundary with the correct style, shade each half-plane, then keep only the overlap. Test one point from the overlap in every inequality to confirm it satisfies all of them.