Free original resources
Graphing Rational Functions Worksheet: Domain, Asymptotes, Holes
Identify a rational function's domain, vertical and horizontal asymptotes, zeros, and removable discontinuities, then sketch the graph by hand with checked points.
Free resources
Letter & A4
PDF & SVG
Letter & A4
PDF & SVG
Make it yours.
Free · no signup · calculated in your browser
Your free printable kit.
Original reference, student practice and separate worked answers. No account or payment.
Practice worksheet
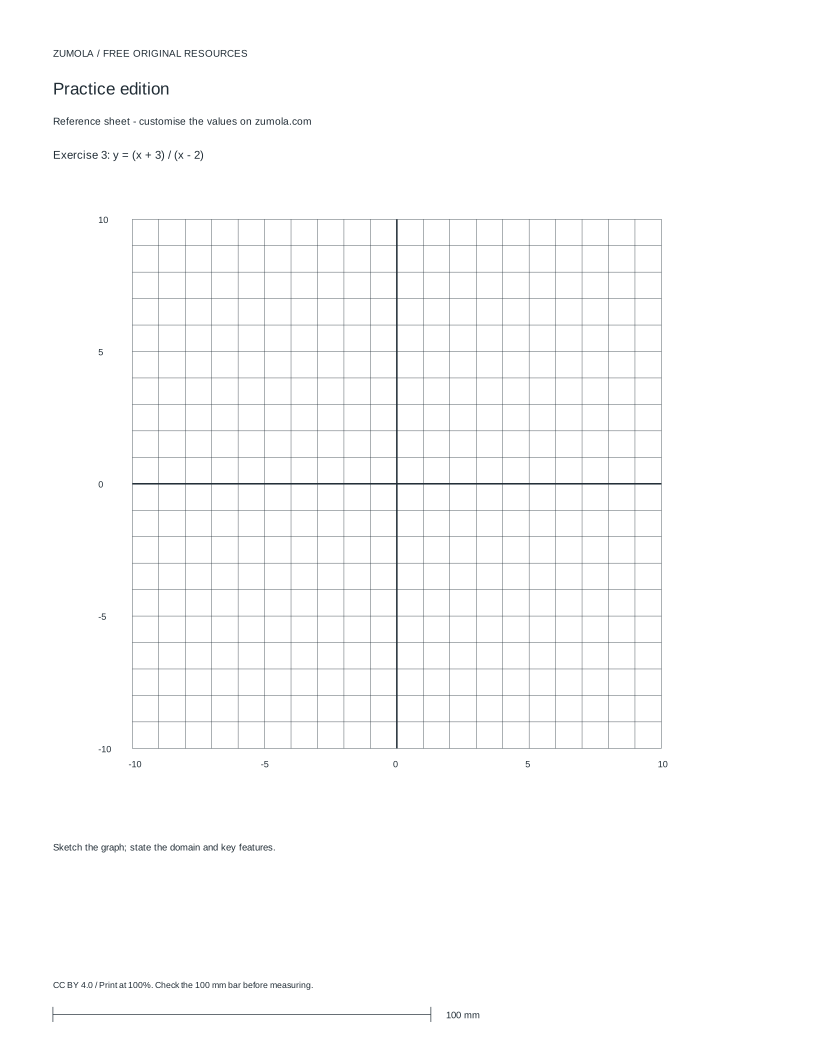
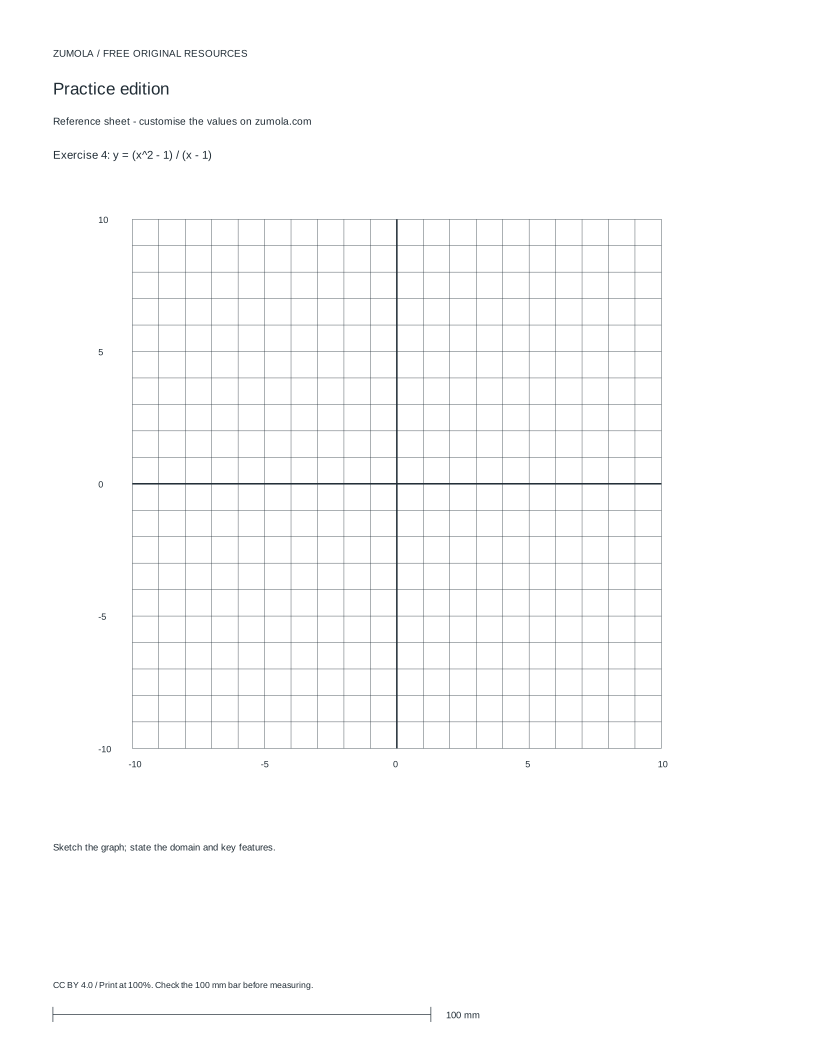
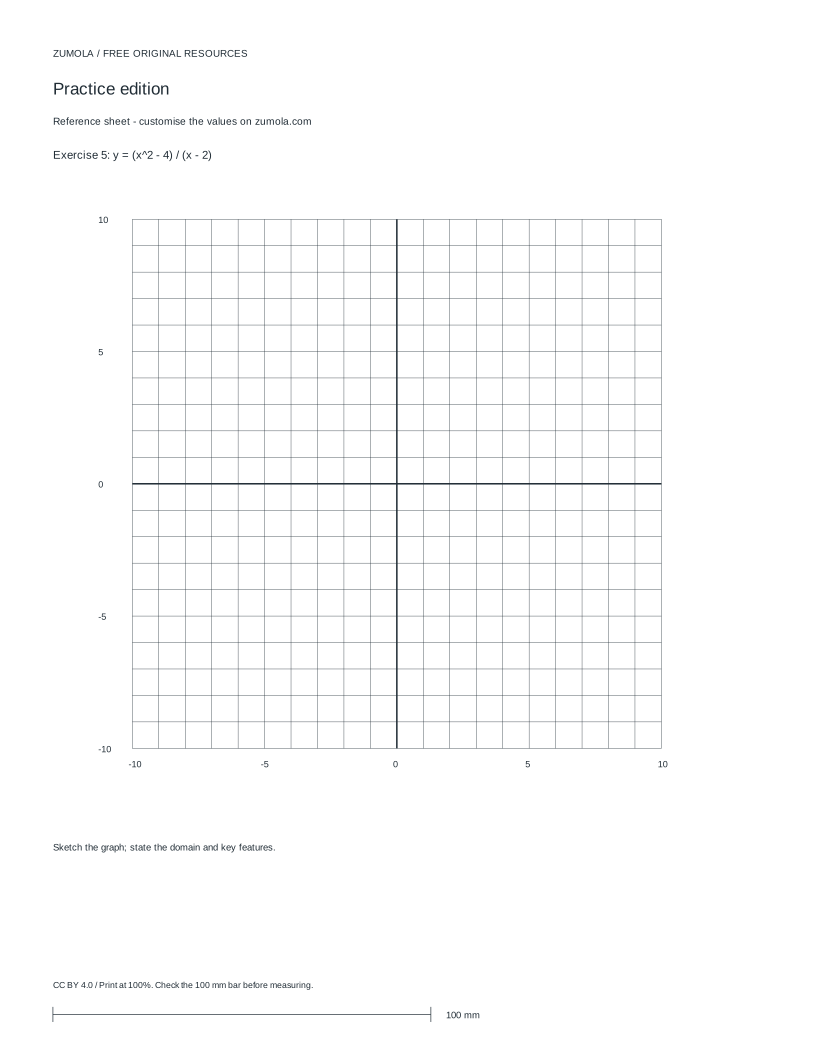
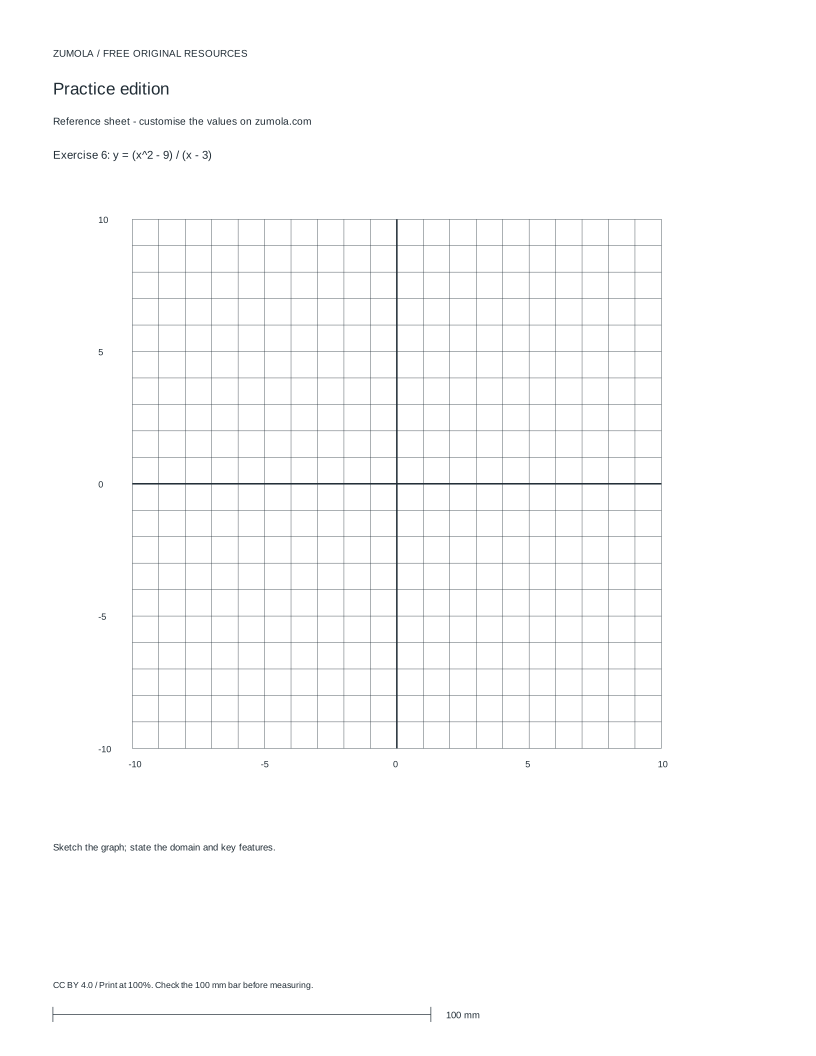
Worked answers / rubric
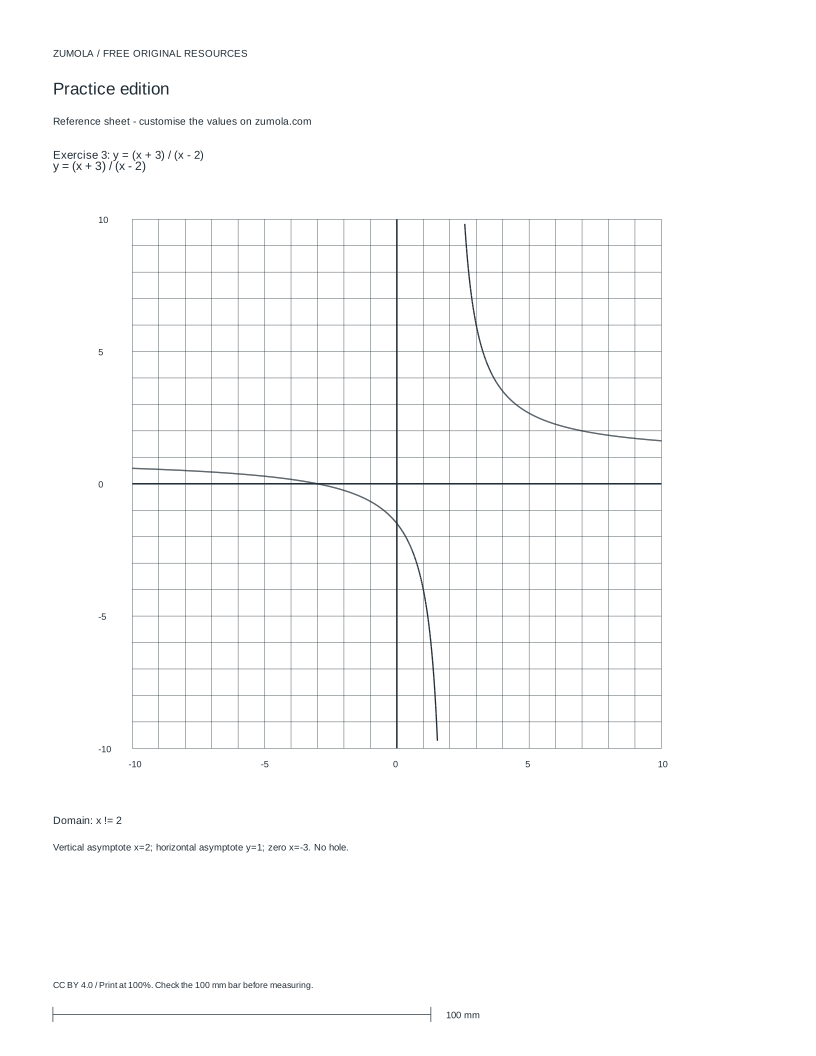
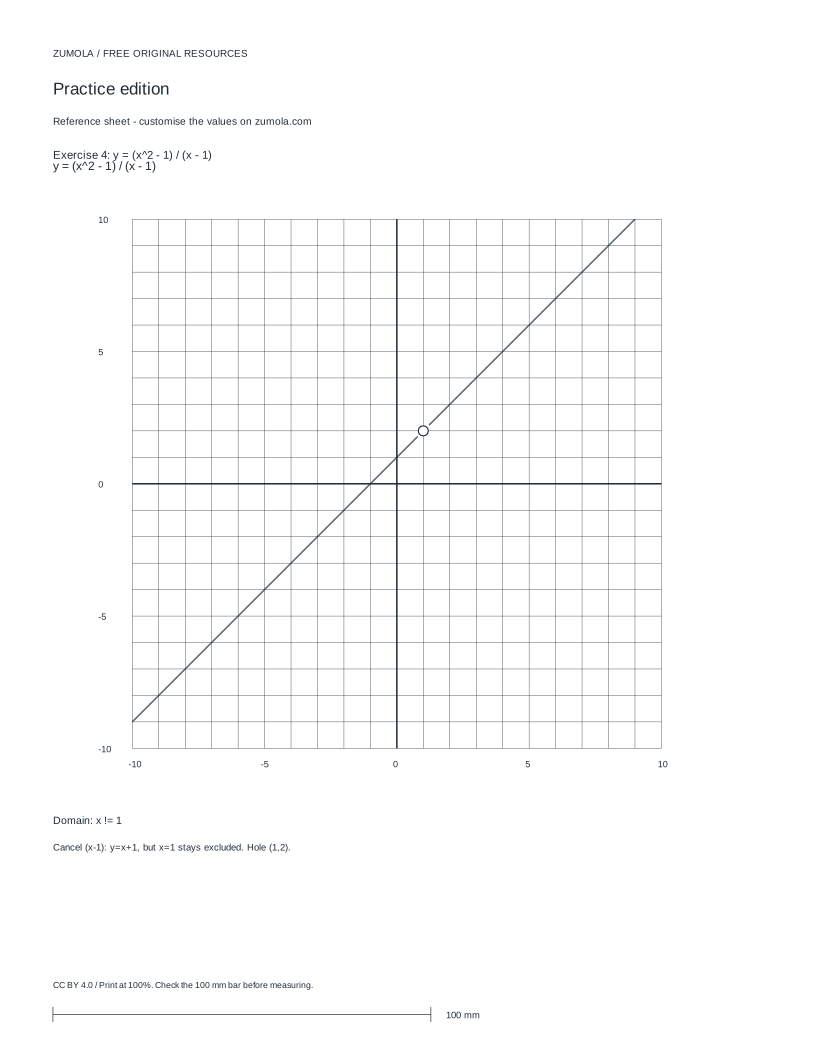
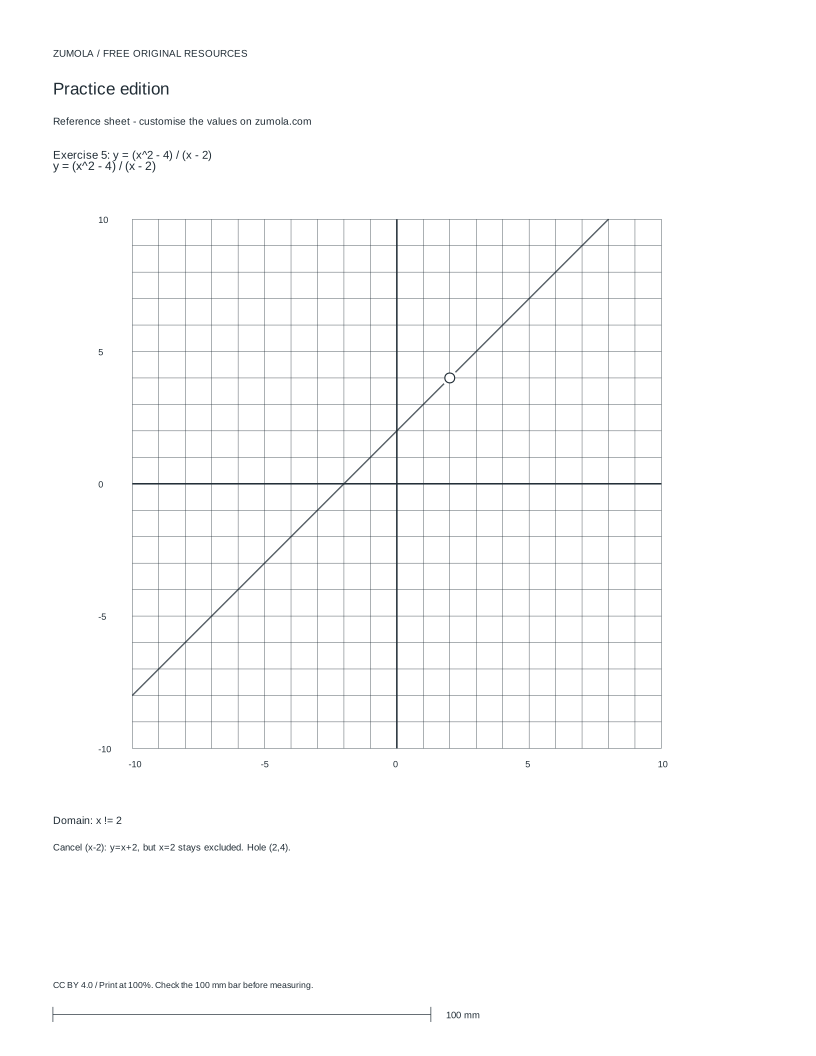
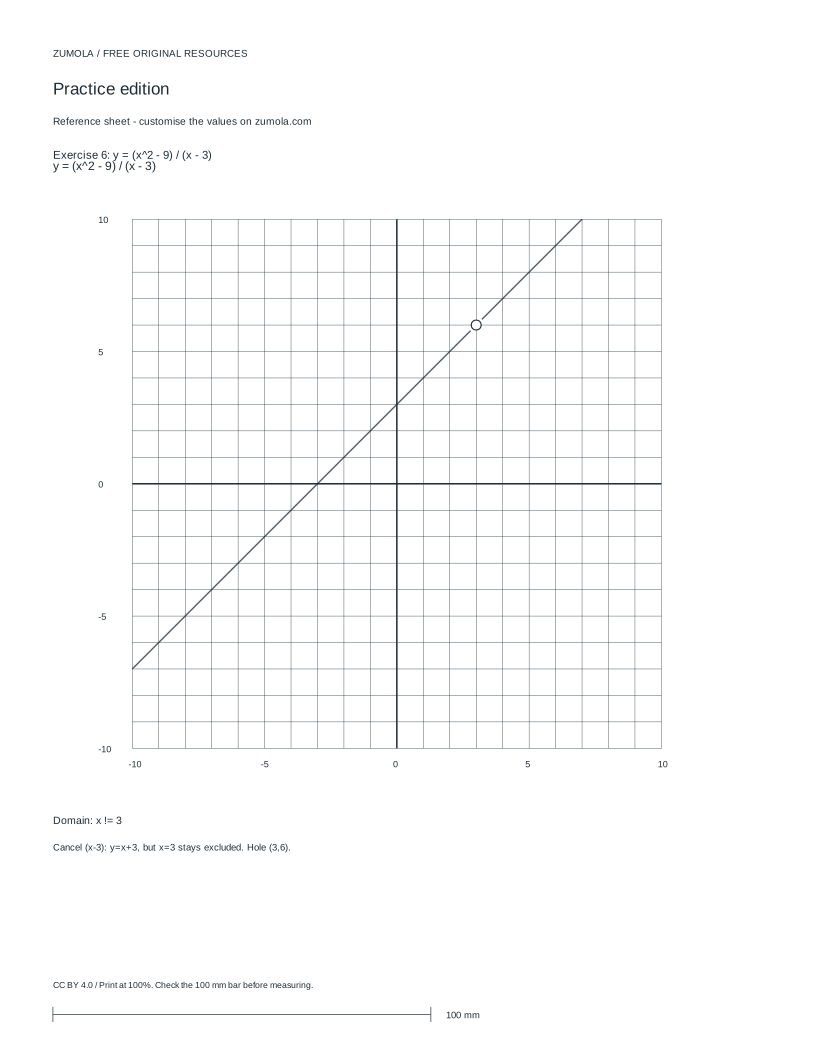
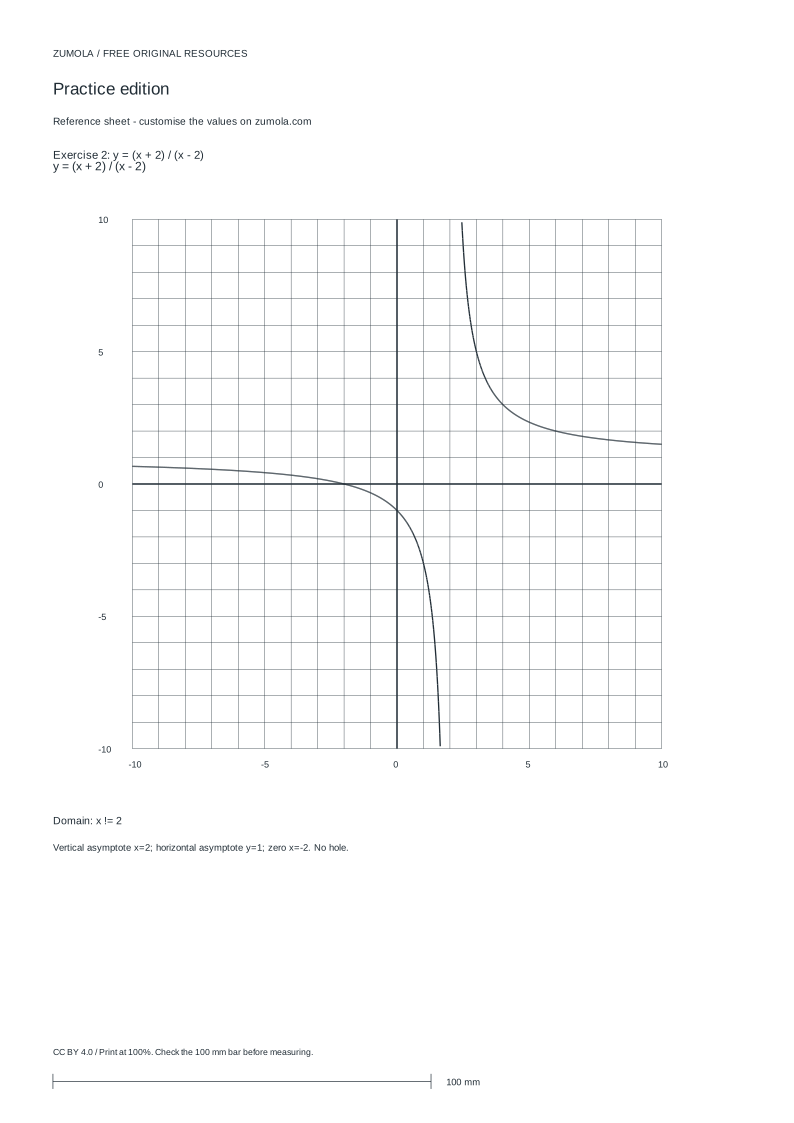
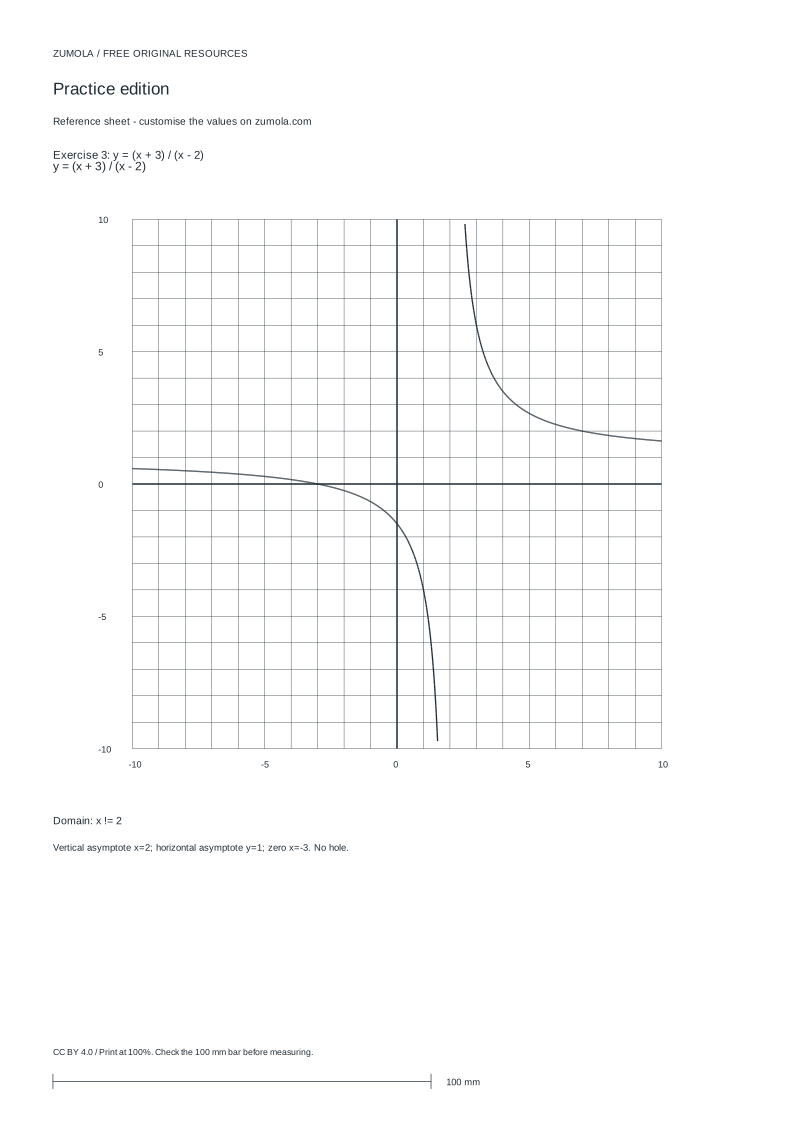
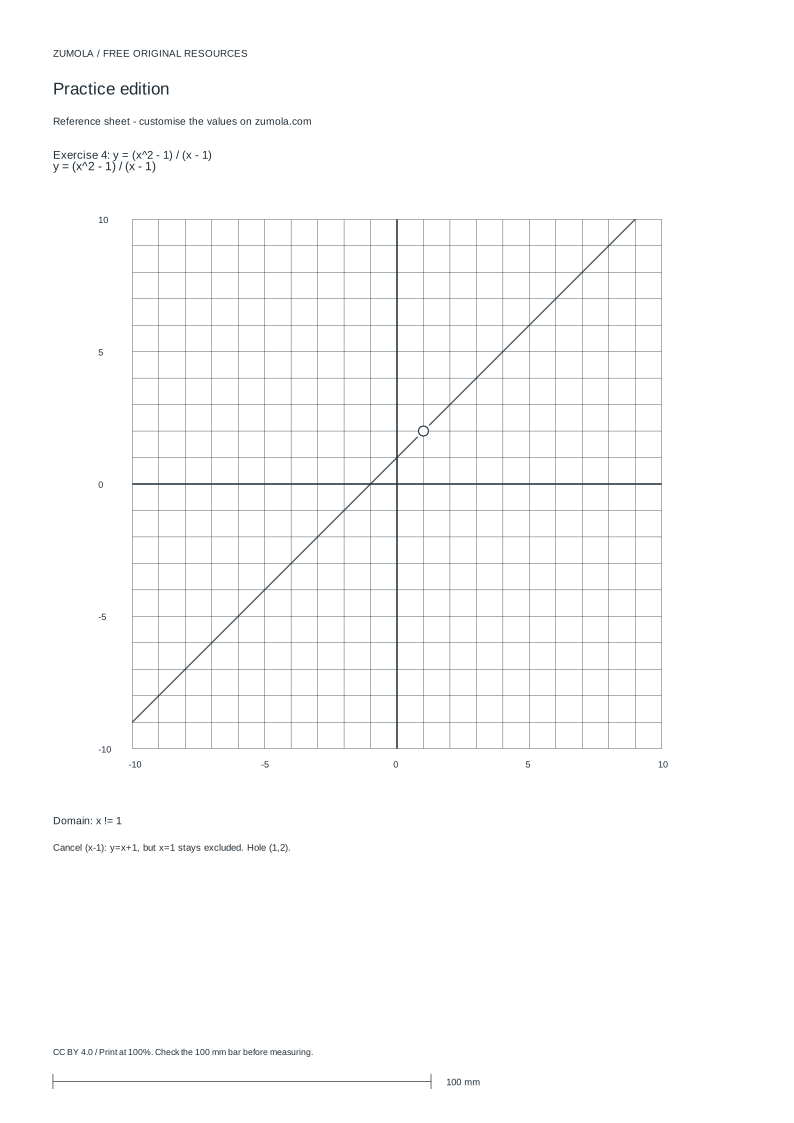
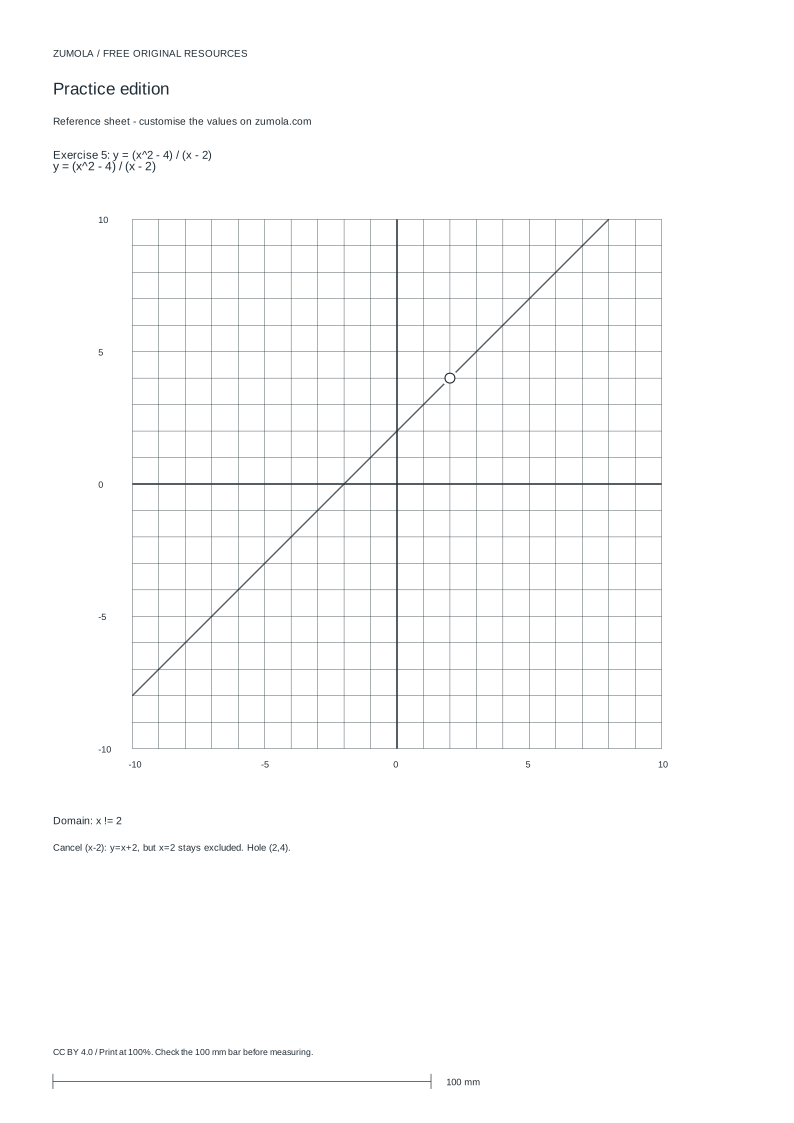
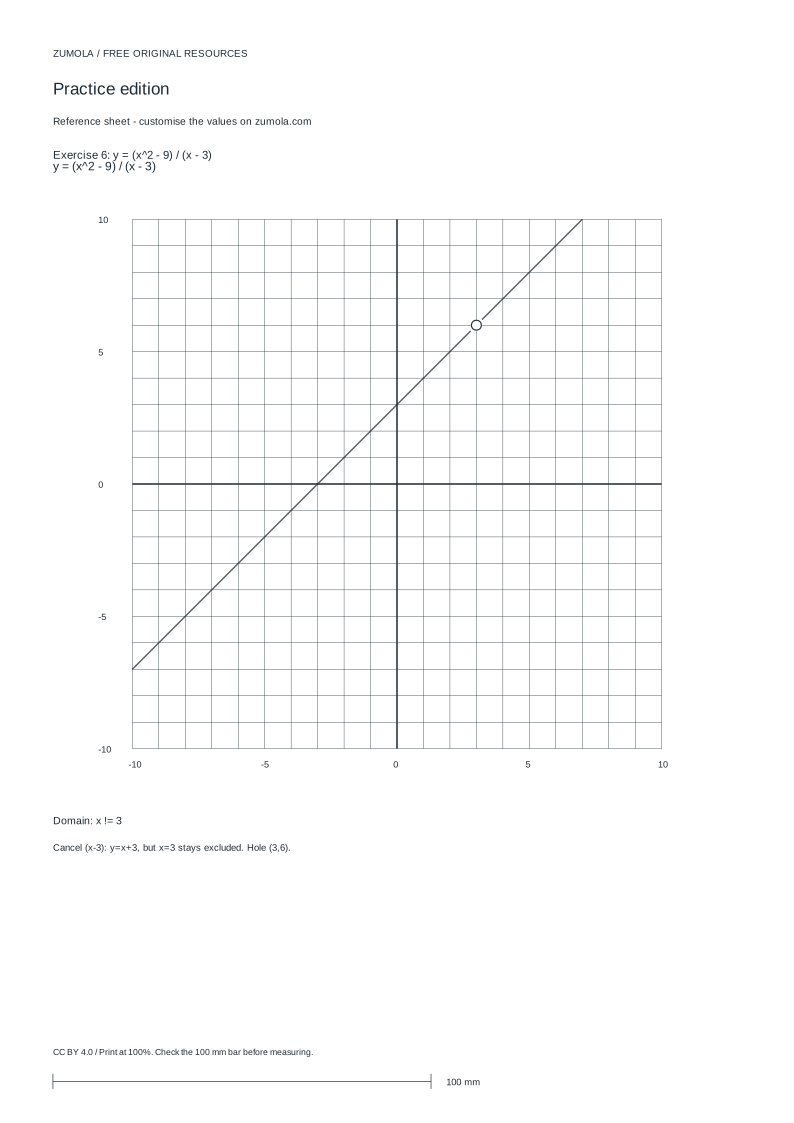
Print at Actual size / 100%. Check the calibration bar before using physical dimensions.
A rational function is a ratio of polynomials, and its graph is shaped by where the denominator is zero and how the numerator behaves near those values. This worksheet page focuses on the analysis that must come before sketching: finding the domain, locating vertical asymptotes, deciding whether a factor cancels to create a hole, and comparing degrees to predict a horizontal asymptote. You then plot a few checked points and intercepts to confirm the sketch.
Start with the domain and cancelled factors
Write the function in factored form before doing anything else. The domain excludes every value that makes the original denominator zero, even if that factor later cancels with the numerator. Cancelling changes the graph's behavior at that value but never restores it to the domain.
After cancelling shared factors, compare what remains. A factor that cancelled leaves a hole at that x-value; a factor still in the denominator leaves a vertical asymptote. Record both, because a sketch that shows an asymptote where a hole belongs is wrong even if the rest of the curve looks reasonable.
- Factor the numerator and denominator completely.
- List every x-value that makes the original denominator zero; these are excluded from the domain.
- Cancel any shared factors and note the x-values where cancellation occurred.
- Classify each excluded value: cancelled factor gives a hole, remaining factor gives a vertical asymptote.
Predict the horizontal asymptote from degrees
Compare the degree of the numerator with the degree of the denominator after cancelling. If the numerator degree is smaller, the horizontal asymptote is y = 0. If the degrees are equal, the asymptote is the ratio of leading coefficients. If the numerator degree is larger, there is no horizontal asymptote, though an oblique asymptote may exist.
State the asymptote as a line, not a number. Writing y = 1 is correct; writing just 1 leaves the reader unsure whether you mean a horizontal or vertical feature.
- Identify the leading term of the numerator and of the denominator.
- Compare degrees and apply the three-case rule.
- Write the result as an equation of a horizontal line, or state that none exists.
Check points, intercepts, and end behavior
Choose x-values on each side of every vertical asymptote and hole, and substitute them into the simplified expression. Plot the resulting points to see whether the curve rises or falls toward each asymptote. Find the y-intercept by substituting x = 0, and find zeros by setting the simplified numerator equal to zero, excluding any value that is a hole.
Near a vertical asymptote, the graph does not touch the line; it approaches it. Near a hole, the curve passes through the missing point's location but the point itself is open. Mark holes with an open circle at the correct height, which you get by substituting the x-value into the simplified expression.
- Substitute x = 0 to find the y-intercept.
- Set the simplified numerator to zero to find x-intercepts, skipping hole values.
- Pick one or two x-values between and beyond asymptotes and compute y.
- Sketch the branches approaching each asymptote and mark holes with open circles.
Try this example
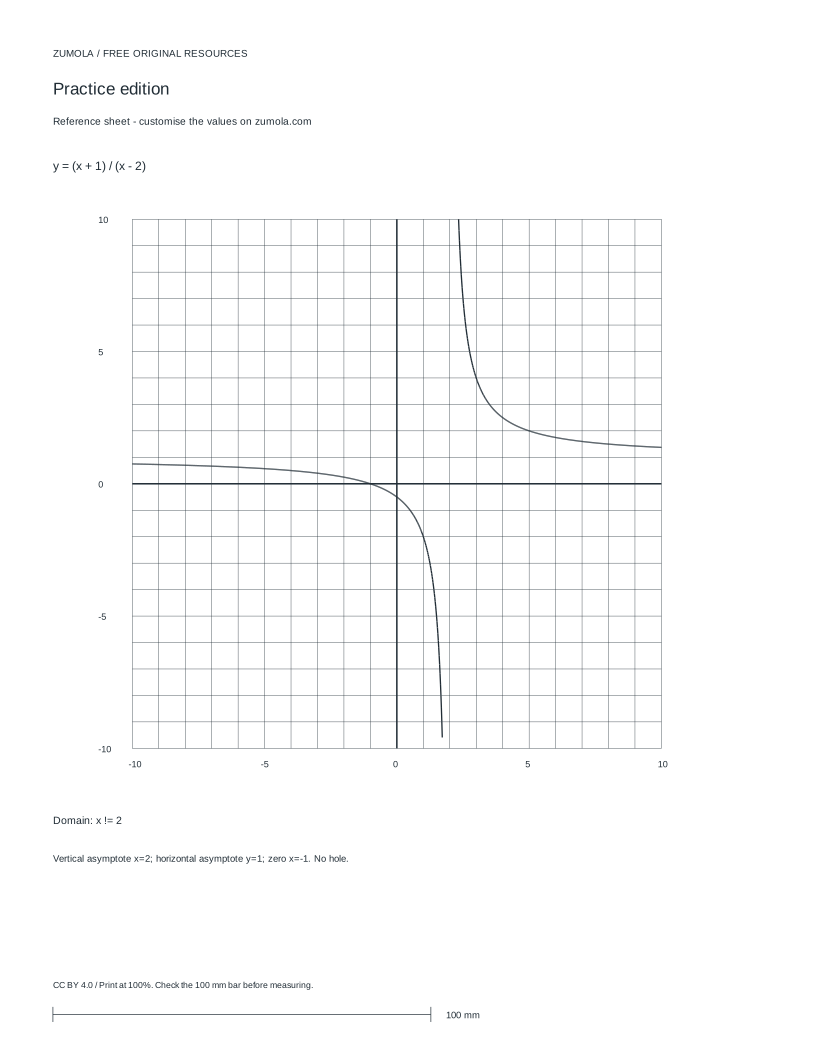
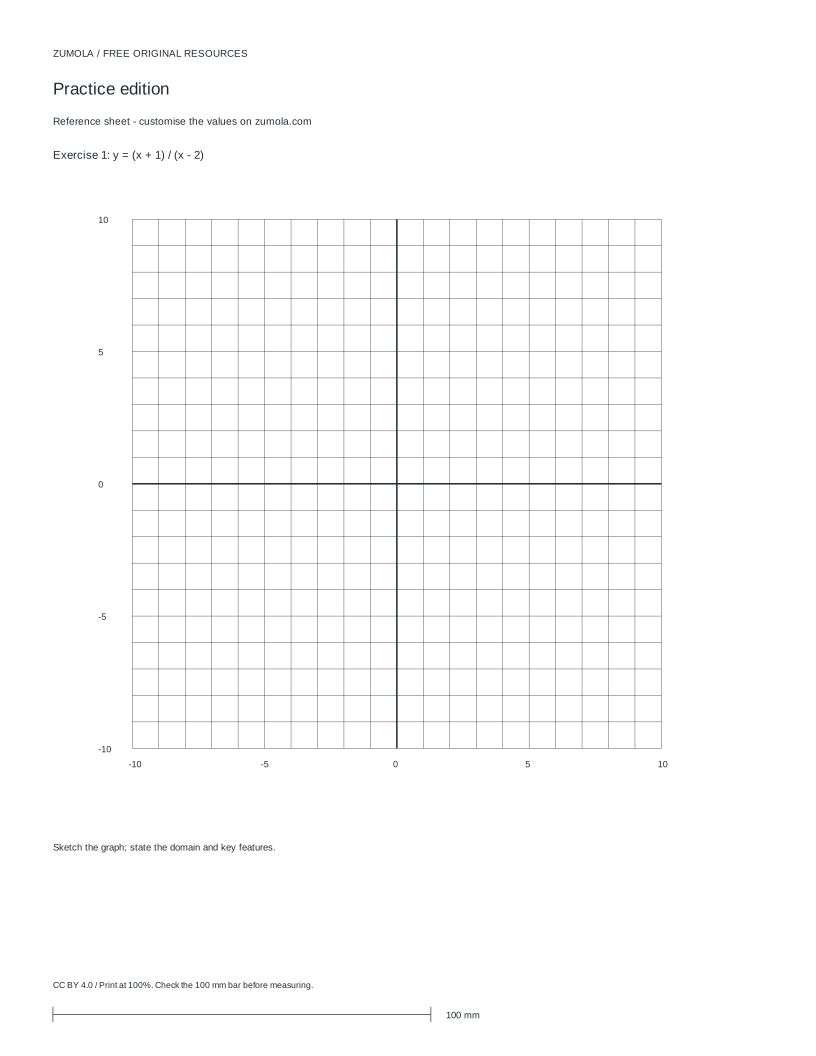
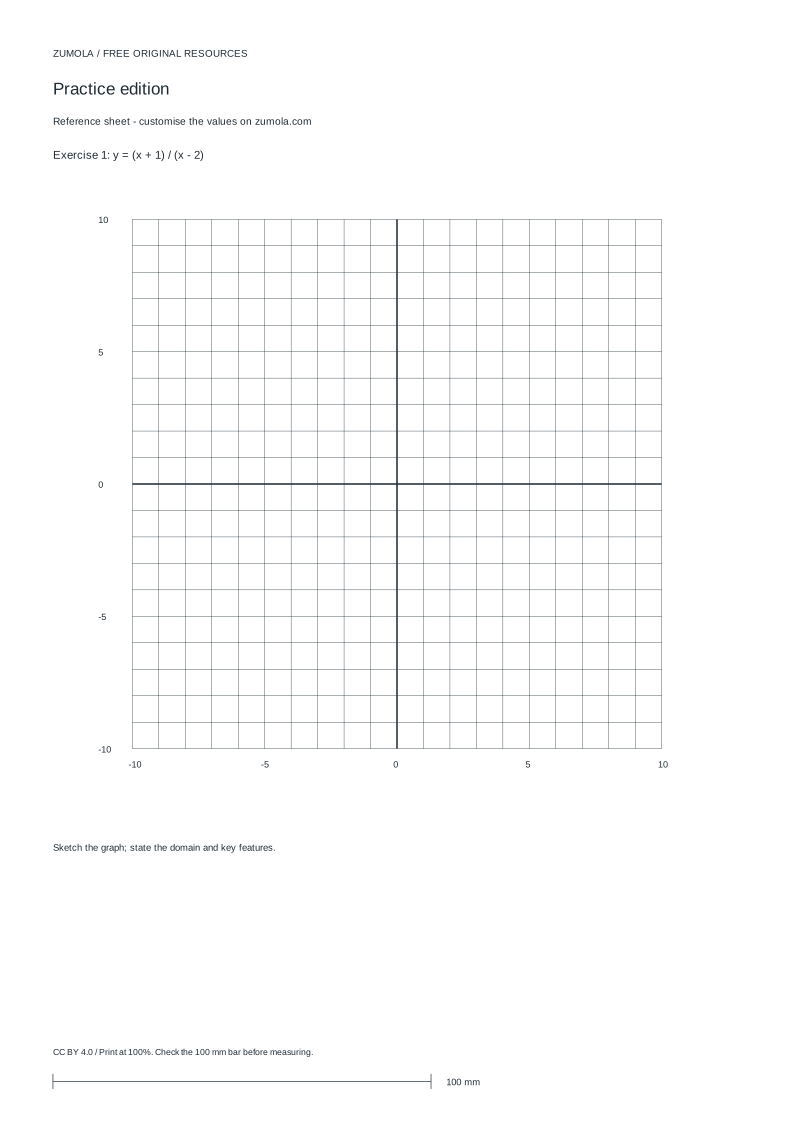
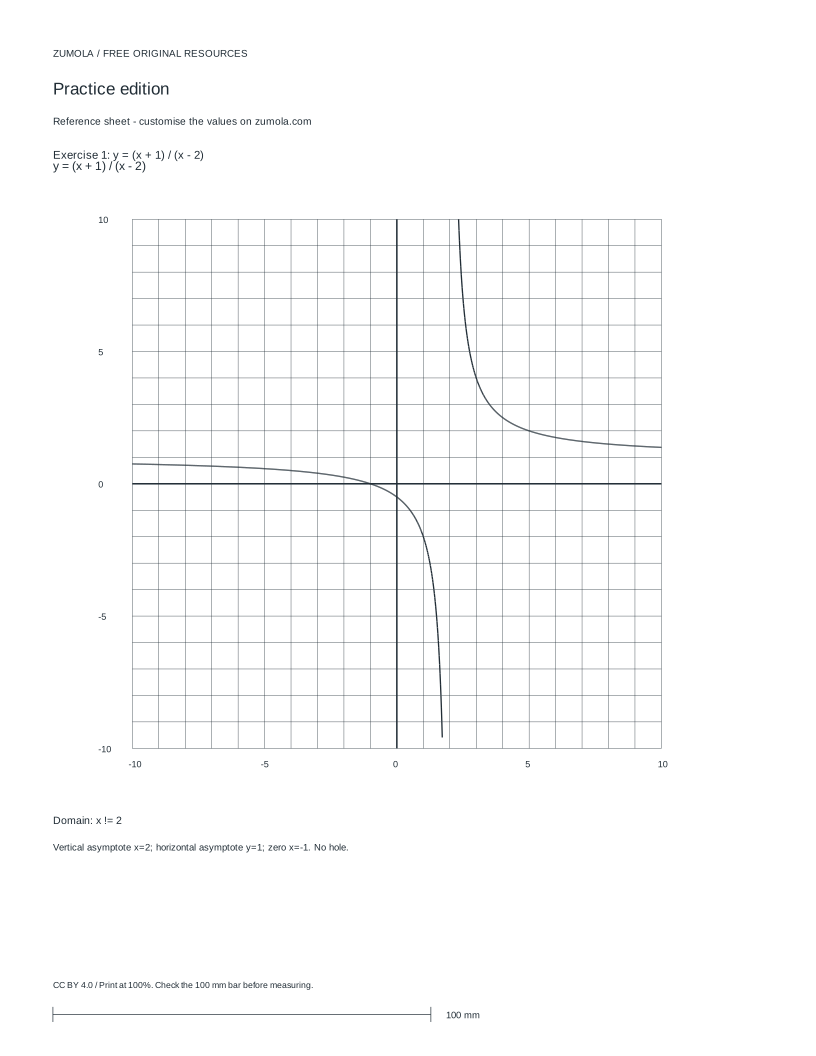
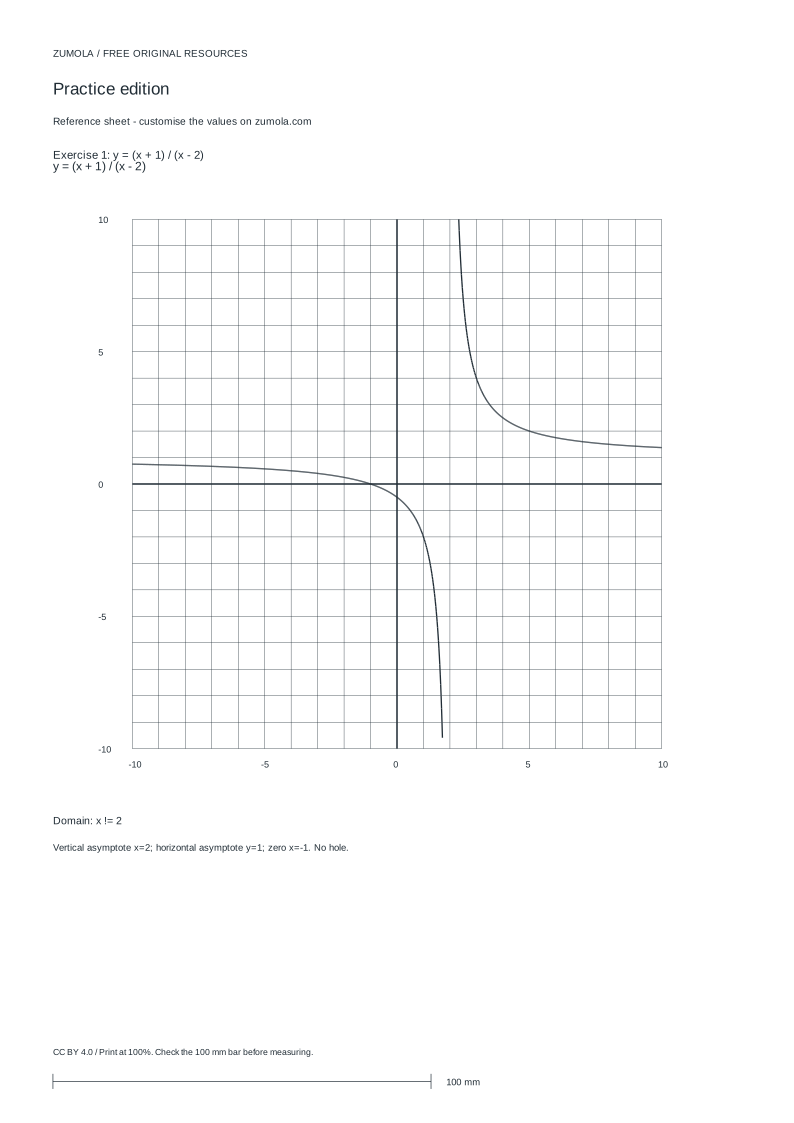
Analyze y = (x + 1) / (x - 2): find the domain, asymptotes, intercepts, and any hole, then describe the sketch.
Show the worked explanation
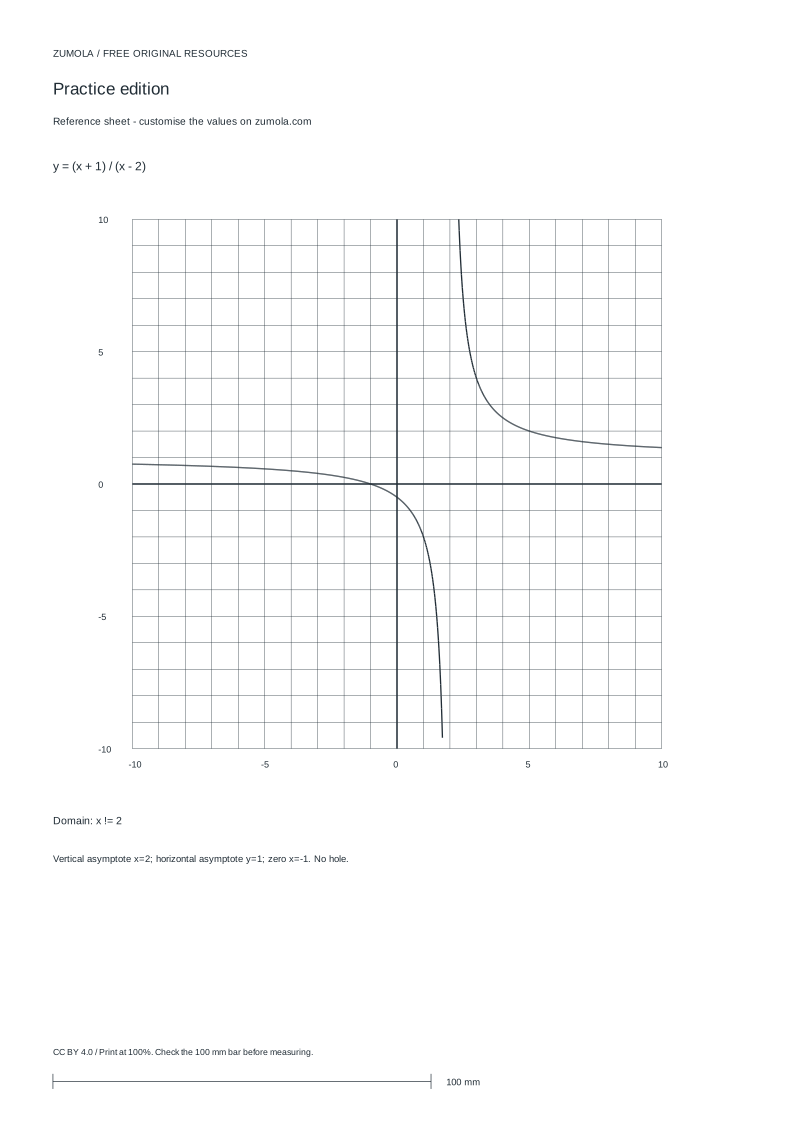
The denominator is zero at x = 2, so the domain is all real x except 2. No factor cancels, so there is a vertical asymptote at x = 2 and no hole. Degrees are equal (1 and 1), so the horizontal asymptote is y = 1, the ratio of leading coefficients. The numerator is zero at x = -1, giving an x-intercept at (-1, 0). Substituting x = 0 gives y = -1/2, so the y-intercept is (0, -1/2). Test x = 3: y = 4, above the asymptote; test x = 1: y = -2, below it. The sketch has two branches, one falling steeply on each side of x = 2, both leveling toward y = 1 at the far left and right.
Common mistakes
- Removing a cancelled x-value from the domain because the factor disappeared. Keep every value that zeroed the original denominator out of the domain, and mark it as a hole rather than an asymptote.
- Drawing a vertical asymptote at a value where a factor cancelled. Recheck the factored form: only factors still present in the denominator after cancelling produce vertical asymptotes.
- Writing the horizontal asymptote as a bare number such as 1. Write it as y = 1 so the line is unambiguous, and state clearly when no horizontal asymptote exists.
Check your work
- Domain lists every value that zeroes the original denominator, including cancelled values.
- Each excluded value is correctly classified as a vertical asymptote or a hole.
- Horizontal asymptote is stated as a line equation, or its absence is justified by degree comparison.
- Intercepts are computed from the simplified expression and holes are excluded from zeros.
- At least two test points, one on each side of each vertical asymptote, are shown and consistent with the sketch.
- Holes are drawn as open circles at the height given by the simplified expression.
Questions before you start
Does a hole belong in the domain?
No. The original denominator is zero there, so the value is excluded. The simplified expression may be defined at that x, but the original function is not.
Can a graph cross its horizontal asymptote?
Yes. A horizontal asymptote describes end behavior as x grows large in either direction; the curve may cross that line at finite x-values.
What if the numerator degree is larger than the denominator degree?
There is no horizontal asymptote. Check for an oblique asymptote by polynomial division, and describe end behavior from the quotient.