Free original resources
Sine and Cosine Graphing Worksheets: Amplitude, Period, and Phase Shift
Learn to graph sine and cosine by identifying amplitude, period, and phase shift. Includes a worked example, common mistakes, and a rubric for checking your sketch.
Free resources
Letter & A4
PDF & SVG
Letter & A4
PDF & SVG
Make it yours.
Free · no signup · calculated in your browser
Your free printable kit.
Original reference, student practice and separate worked answers. No account or payment.
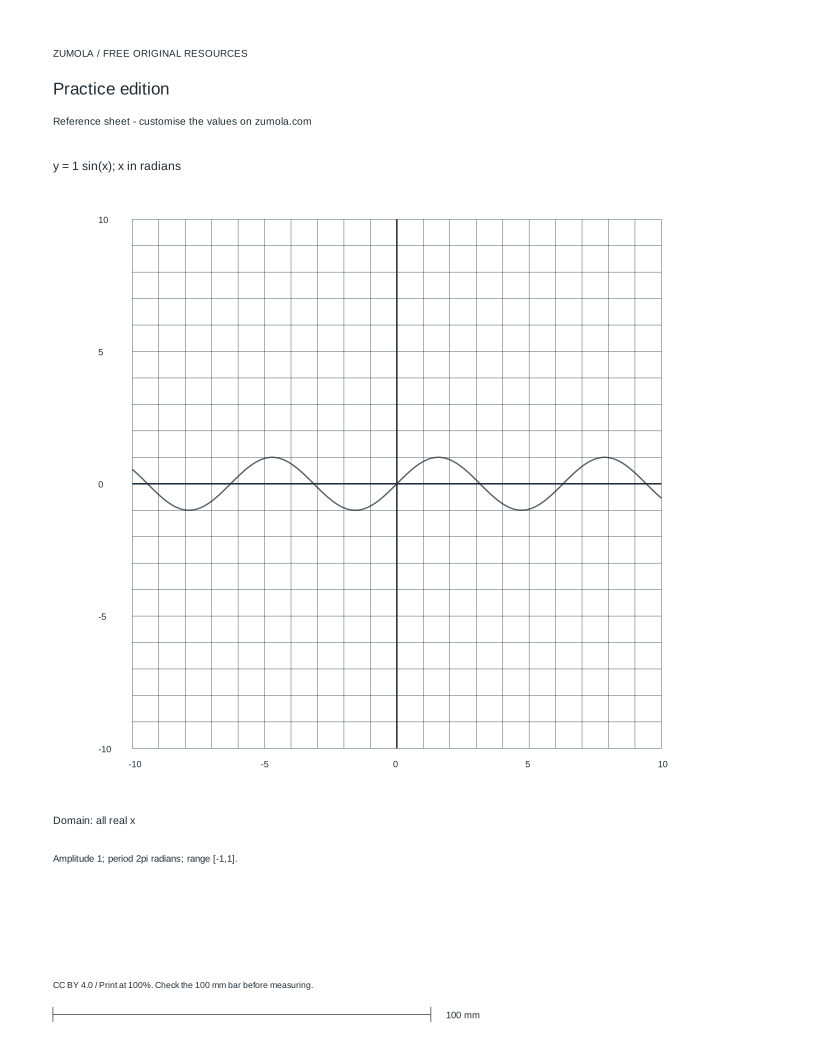
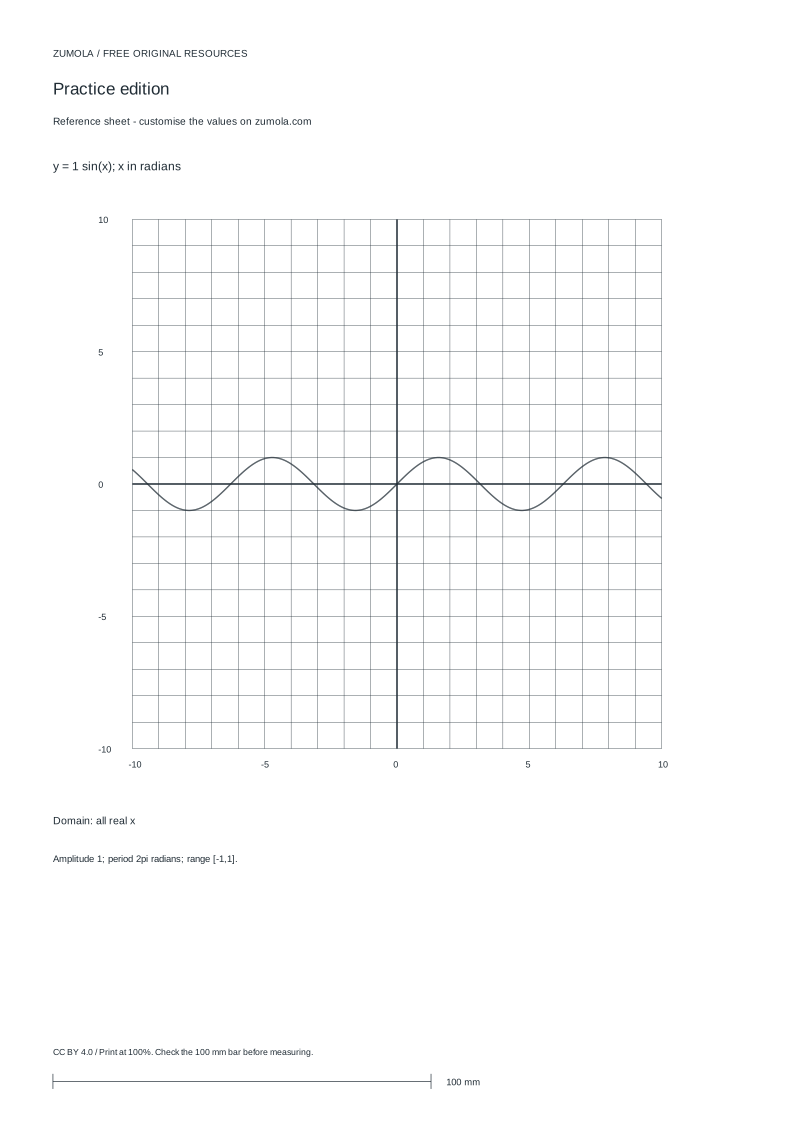
Practice worksheet
Worked answers / rubric
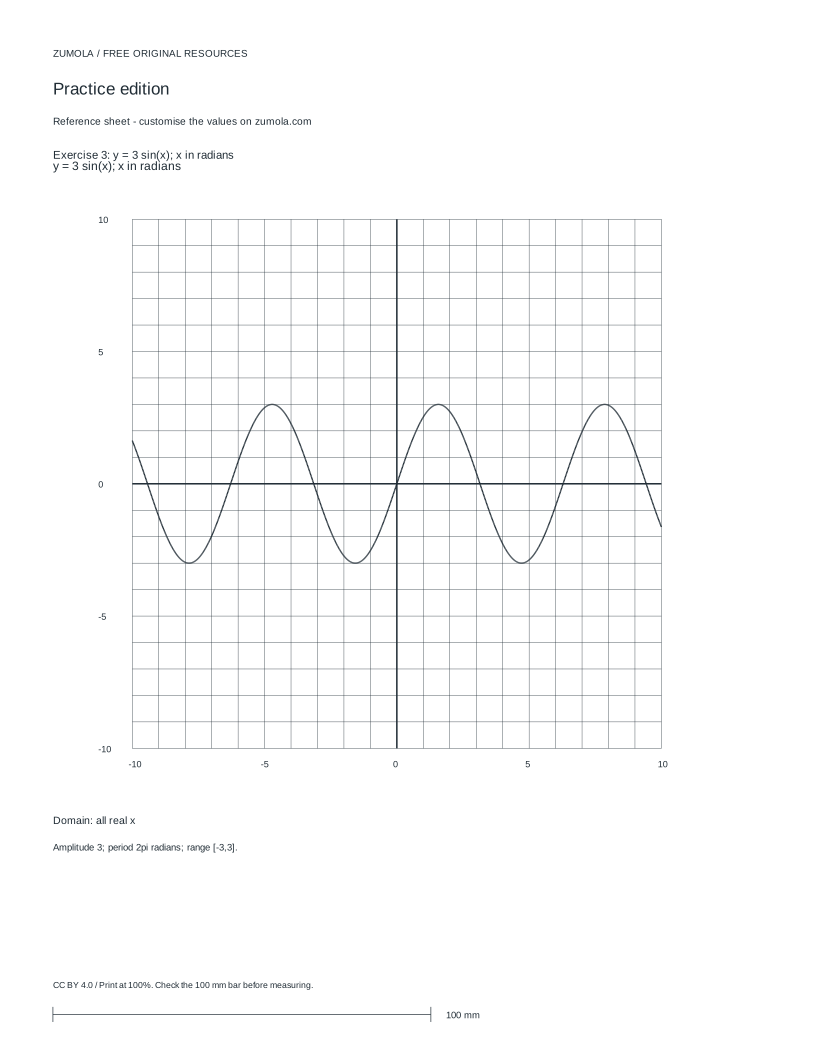
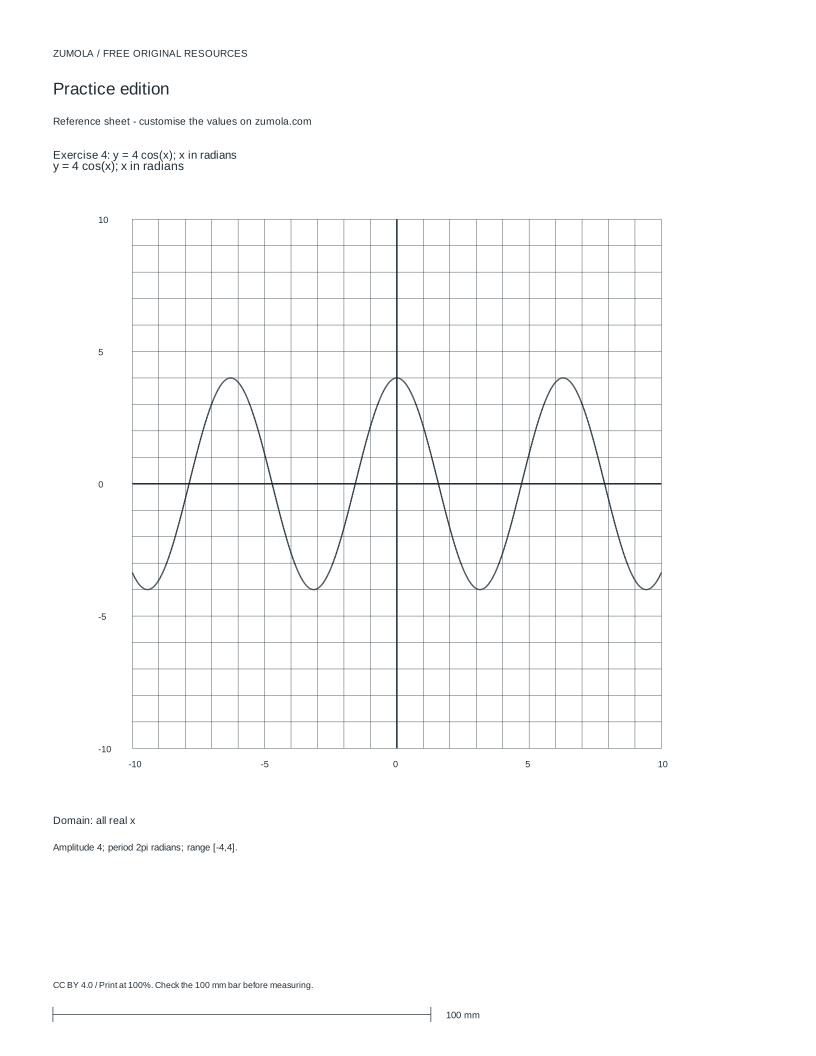
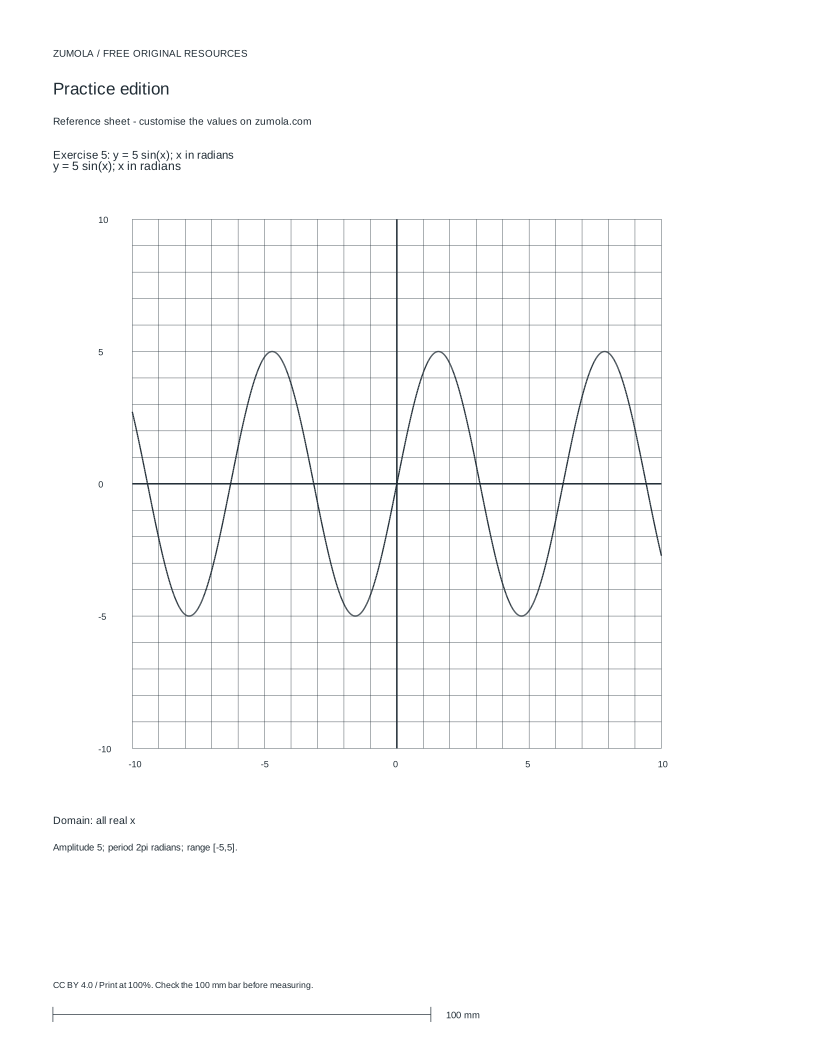
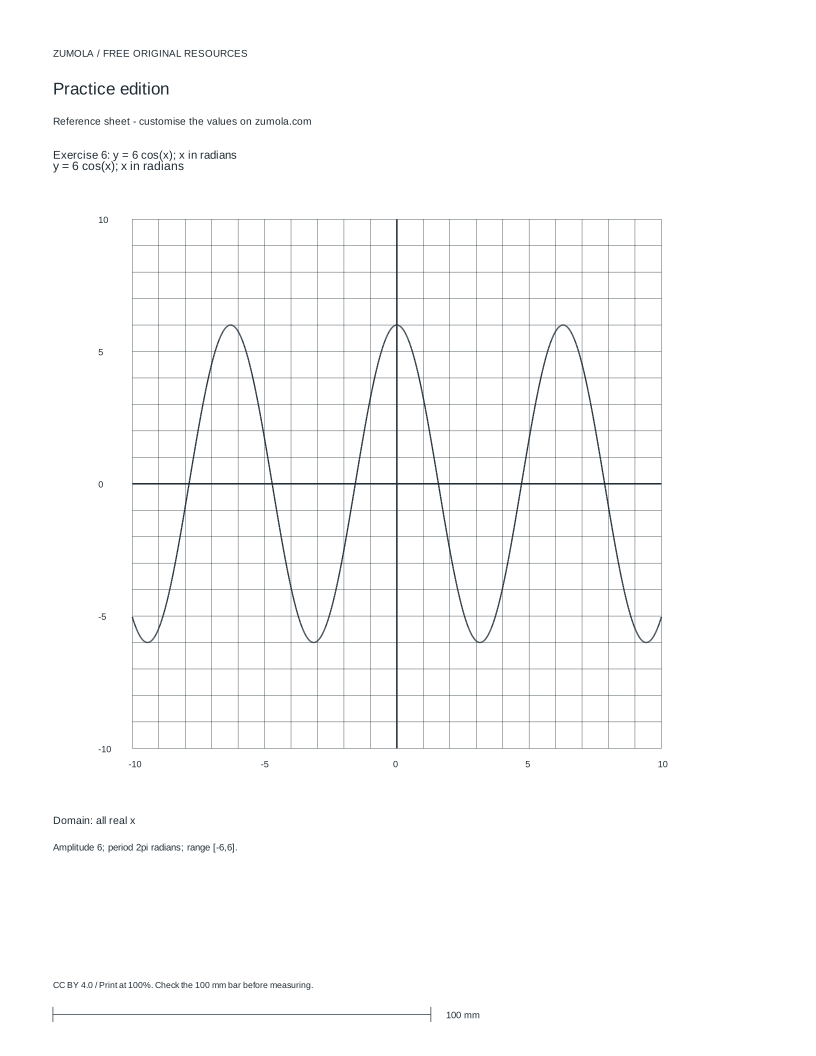
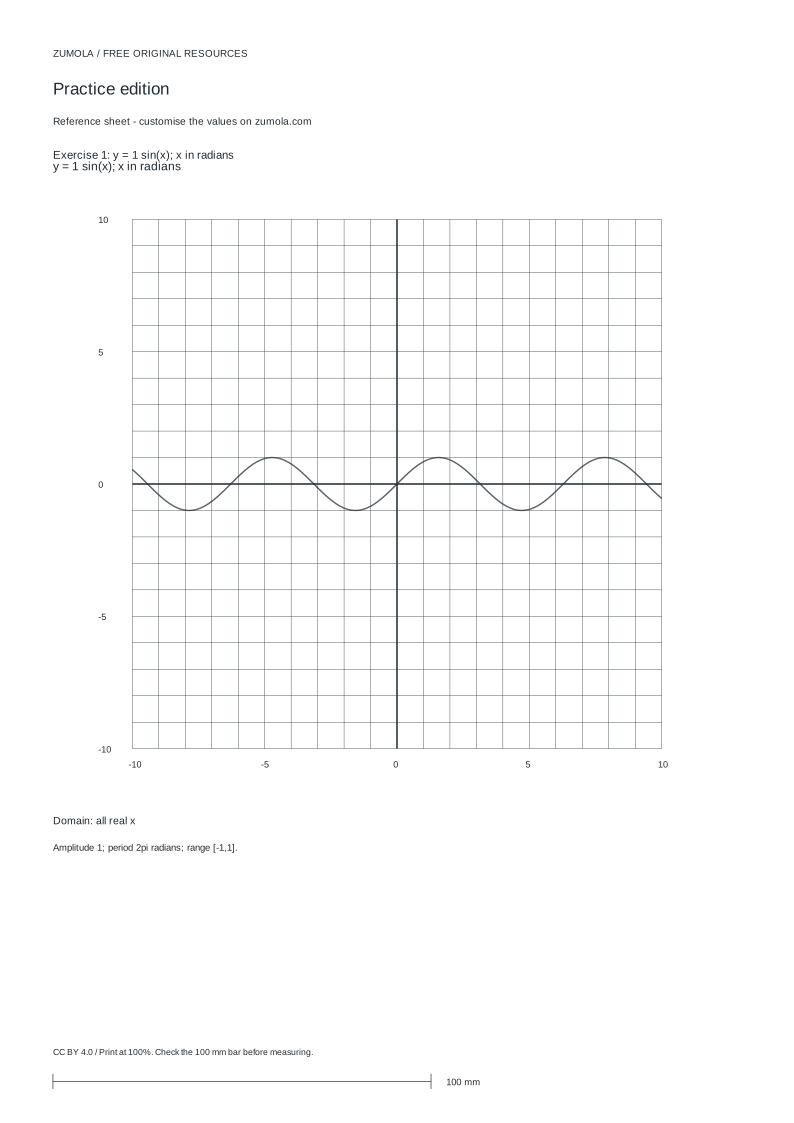
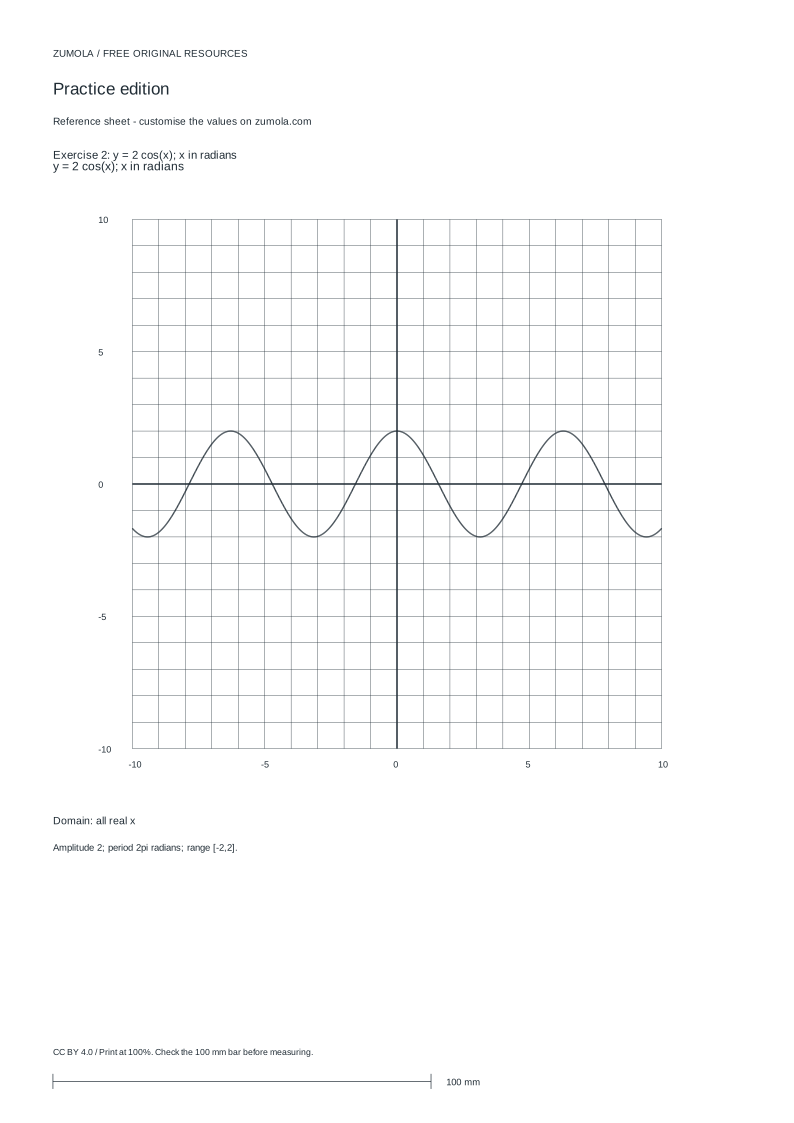
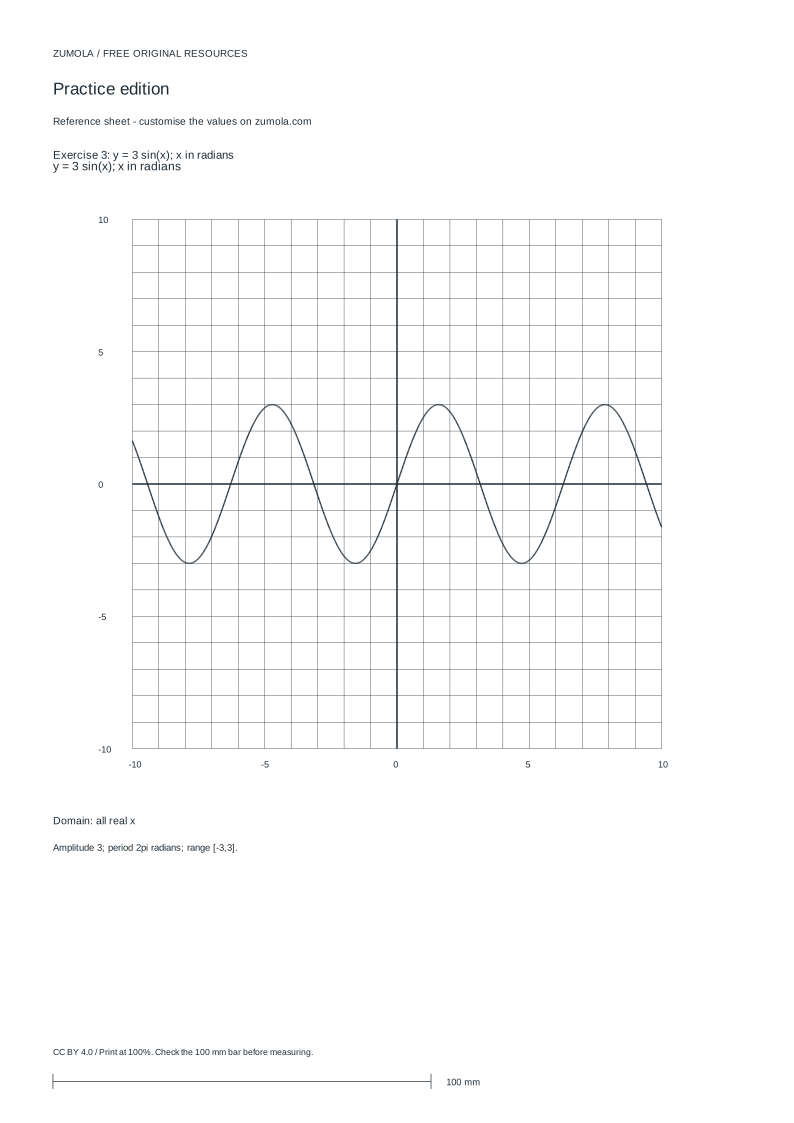
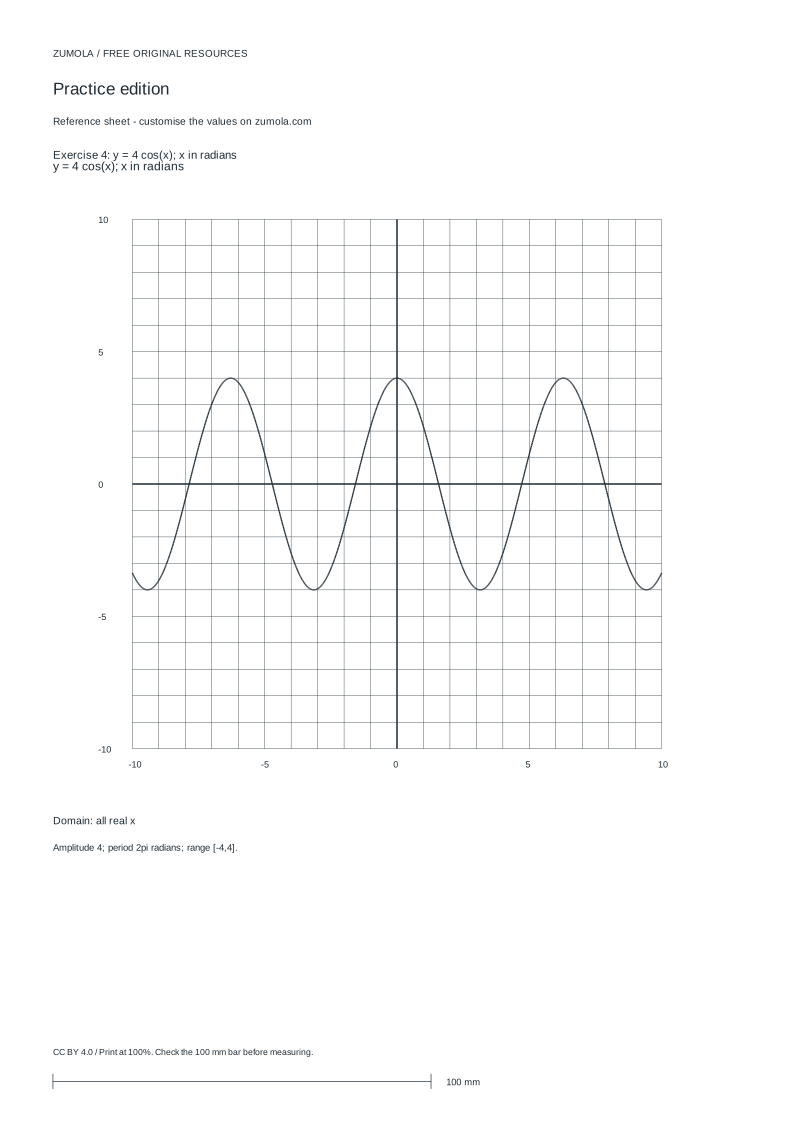
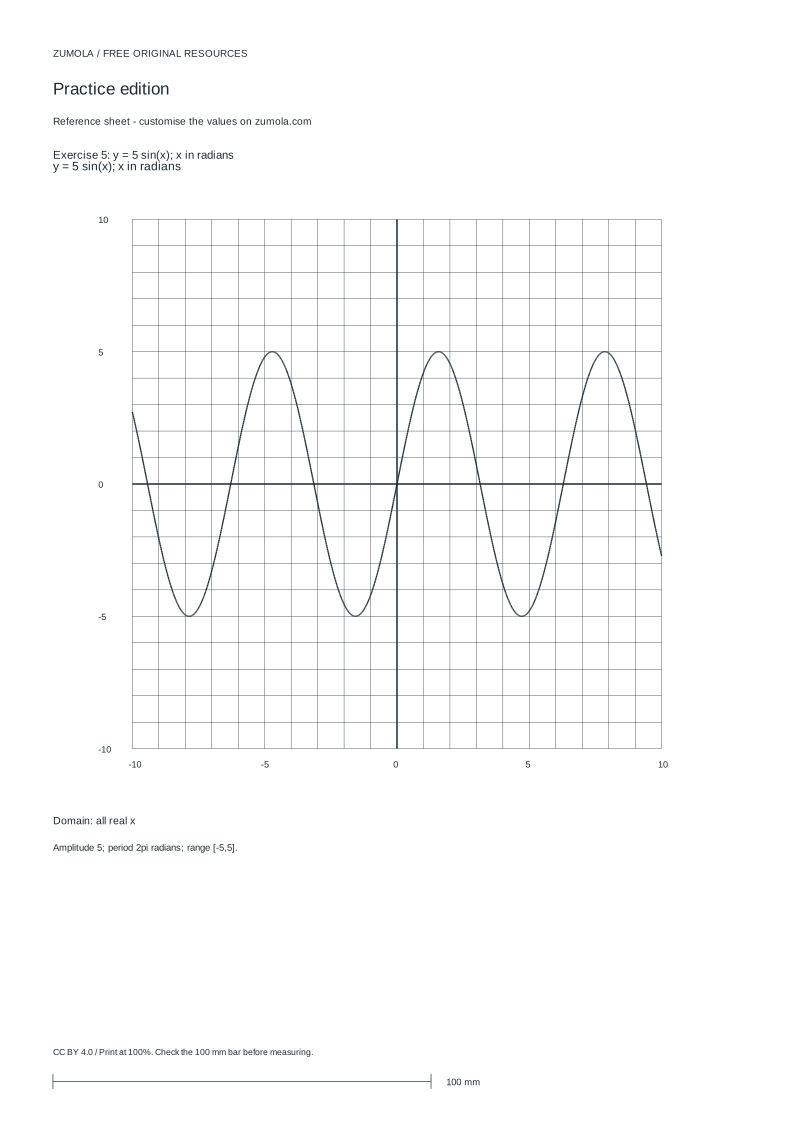
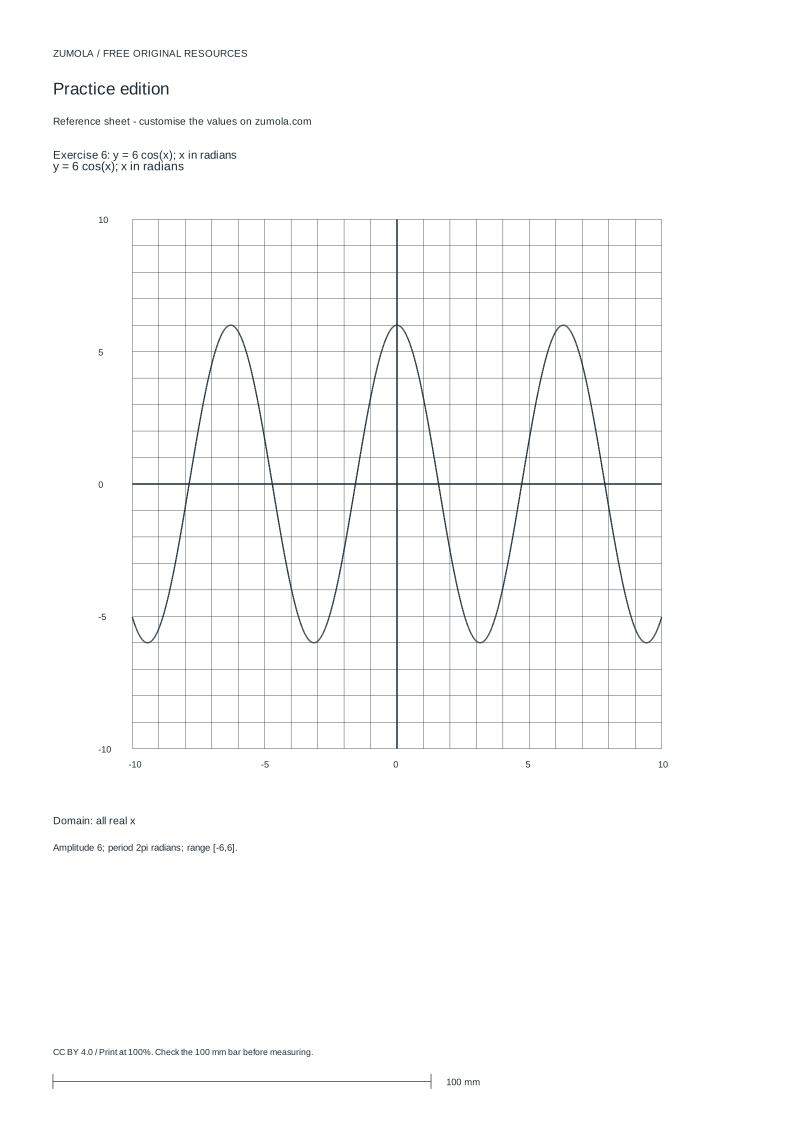
Print at Actual size / 100%. Check the calibration bar before using physical dimensions.
Graphing sine and cosine is not about memorizing a shape; it is about reading four numbers from an equation and using them to place key points on a coordinate grid. This page explains how amplitude, period, phase shift, and vertical shift control the curve. You will practice plotting one full cycle, checking intercepts and extrema, and verifying that your graph matches the equation. The method works for any sine or cosine function written in standard form, and it prepares you to interpret trigonometric graphs accurately.
Read the equation before you draw
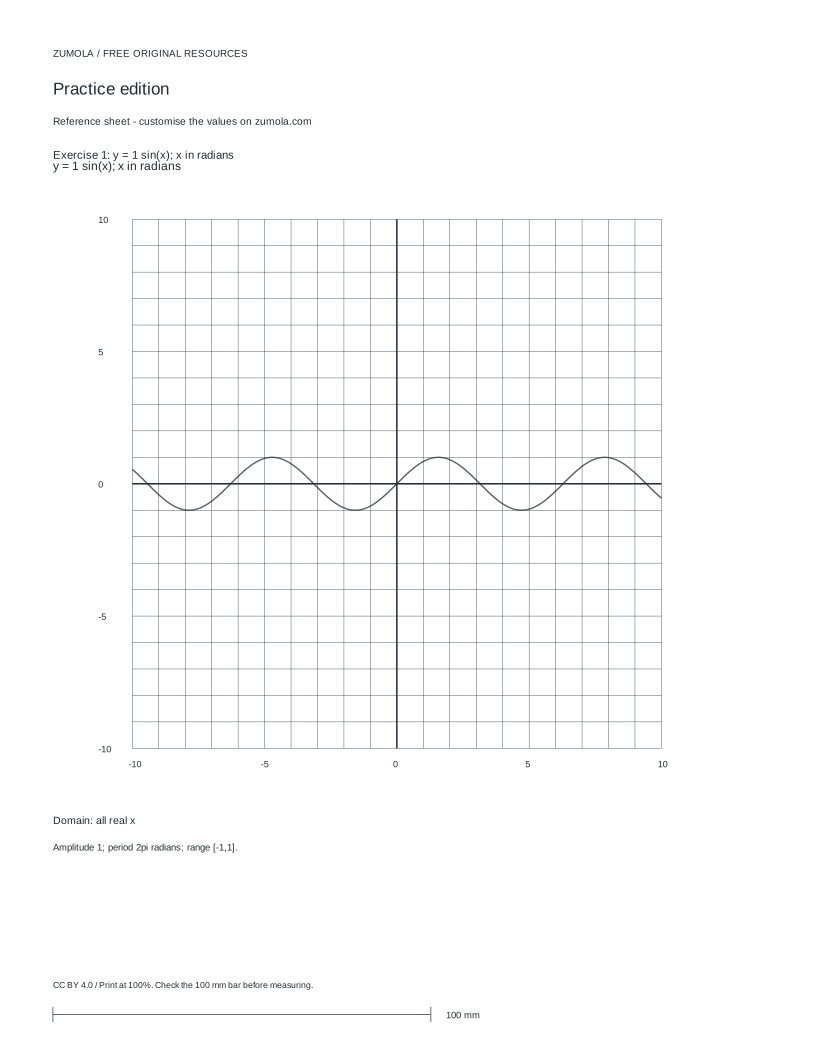
Write the function in the form y = A sin(B(x - C)) + D or y = A cos(B(x - C)) + D, with x measured in radians. The amplitude is |A|. The period is 2π / |B|. The phase shift is C units to the right when C is positive, or to the left when C is negative. The vertical shift is D, which moves the midline up or down. For y = 1 sin(x), A = 1, B = 1, C = 0, and D = 0, so the amplitude is 1, the period is 2π radians, and the range is [-1, 1].
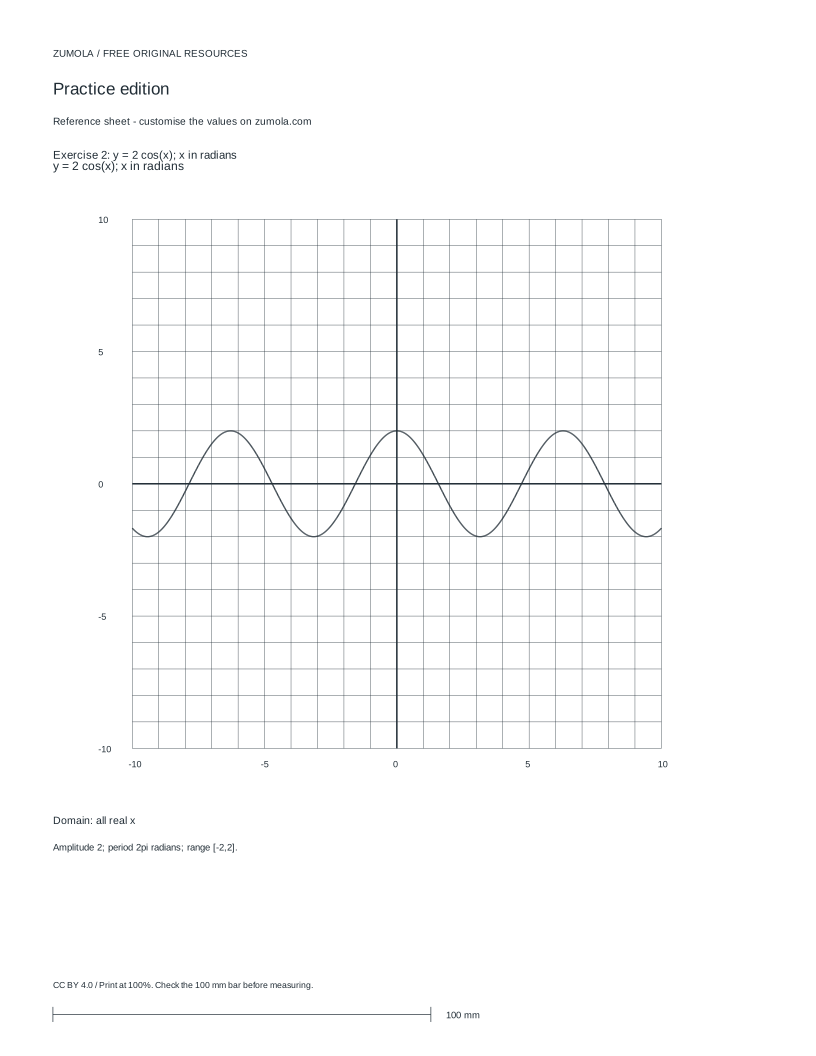
A full cycle of sine starts at the midline, rises to the maximum, returns to the midline, falls to the minimum, and returns to the midline. Cosine starts at its maximum, falls to the midline, reaches the minimum, rises to the midline, and returns to the maximum. Use these five key points per cycle: start, quarter-period, half-period, three-quarter period, and end. Plot them first, then connect with a smooth curve. The domain of both sine and cosine is all real numbers, so there are no asymptotes or endpoints to open or close.
- Identify A, B, C, and D from the equation.
- Compute amplitude |A| and period 2π / |B|.
- Mark the midline y = D on the grid.
- Divide one period into four equal intervals to locate key x-values.
- Plot the five key points for one cycle, then extend the pattern in both directions.
Place key points accurately
For sine, the key y-values in one cycle are D, D + |A|, D, D - |A|, and D. For cosine, they are D + |A|, D, D - |A|, D, and D + |A|. The x-values begin at the phase shift C and increase by one quarter of the period each time. If the phase shift is negative, start to the left of the y-axis. Always label the midline and the maximum and minimum levels so a reader can check your scale.
When B is negative, use |B| for the period and treat the sign as a reflection across the x-axis combined with the phase shift. A negative A also reflects the graph across the midline. Do not confuse amplitude with maximum value: amplitude is the distance from the midline to an extremum, while the maximum is D + |A|. For example, y = 3 cos(2x) - 1 has amplitude 3, period π, midline y = -1, maximum 2, and minimum -4.
- Draw and label the midline y = D.
- Mark the maximum y = D + |A| and minimum y = D - |A|.
- Starting at x = C, add quarter-period steps to get five x-values.
- Assign the sine or cosine pattern of y-values to those x-values.
- Check that the curve returns to the starting height after one full period.
Check intercepts, extrema, and domain
After sketching, verify at least one x-intercept and one extremum by substituting into the equation. For y = sin(x), x = 0 gives y = 0, and x = π/2 gives y = 1. For y = cos(x), x = 0 gives y = 1, and x = π gives y = -1. These independent checks catch scale errors and misplaced phase shifts. Because sine and cosine are defined for all real x, there are no vertical asymptotes and no restricted endpoints; the graph continues periodically in both directions.
A blank coordinate grid is not an answer by itself. The learning goal is to produce a labeled curve that matches a specific equation, with amplitude, period, midline, and phase shift visible. If a worksheet provides only blank axes, write the equation you are graphing and mark the key values before drawing. This keeps the task about function behavior rather than decoration.
- Substitute one x-value from your key points into the equation.
- Confirm the computed y-value matches your plotted point.
- Check that the distance between consecutive maxima equals the period.
- State the domain as all real numbers and note that no asymptotes exist.
- Label amplitude, period, midline, and phase shift on the finished graph.
Try this example
Graph one full cycle of y = 2 sin(3(x - π/6)) + 1 for x in radians. State the amplitude, period, phase shift, midline, maximum, and minimum.
Show the worked explanation
Amplitude is |2| = 2. Period is 2π / |3| = 2π/3. Phase shift is π/6 to the right. Midline is y = 1. Maximum is 1 + 2 = 3; minimum is 1 - 2 = -1. One cycle starts at x = π/6 and ends at x = π/6 + 2π/3 = 5π/6. Divide the period into four equal steps of (2π/3)/4 = π/6. The five key x-values are π/6, π/3, π/2, 2π/3, and 5π/6. Because the function is sine with positive A, the y-values are midline, maximum, midline, minimum, midline: 1, 3, 1, -1, 1. Plot these points, connect with a smooth wave, and extend the pattern. Check x = π/2: 3(π/2 - π/6) = 3(π/3) = π, and 2 sin(π) + 1 = 1, matching the plotted midline point.
Common mistakes
- Using the coefficient A as the maximum value instead of the amplitude. Treat |A| as the distance from the midline to an extremum; the maximum is D + |A| and the minimum is D - |A|.
- Plotting sine and cosine with the same starting point. Start sine at the midline and cosine at the maximum (when A is positive), then follow the quarter-period key points.
- Drawing asymptotes or stopping the graph at the edge of the grid. Remember that sine and cosine have domain all real x and no asymptotes; extend the periodic pattern beyond the plotted cycle.
Check your work
- Amplitude is correctly identified as |A| and shown as the distance from midline to extremum.
- Period is correctly computed as 2π / |B| and used to space key points.
- Phase shift and vertical shift are labeled and match the equation.
- Five key points per cycle are plotted at quarter-period intervals.
- The curve is smooth, periodic, and extended beyond one cycle.
- At least one point is verified by substitution into the equation.
- Domain is stated as all real numbers with no asymptotes or endpoints.
Questions before you start
How do I find the period from the equation?
For y = A sin(B(x - C)) + D or y = A cos(B(x - C)) + D, the period is 2π divided by the absolute value of B. For example, B = 2 gives a period of π radians.
What is the difference between phase shift and vertical shift?
Phase shift moves the graph left or right along the x-axis and is controlled by C. Vertical shift moves the midline up or down along the y-axis and is controlled by D.
Do sine and cosine graphs have asymptotes?
No. Sine and cosine are defined for all real numbers, so their graphs are smooth waves with no vertical asymptotes and no restricted endpoints.