Free printable resources · Original practice
1 inch graph paper.
Room to begin.
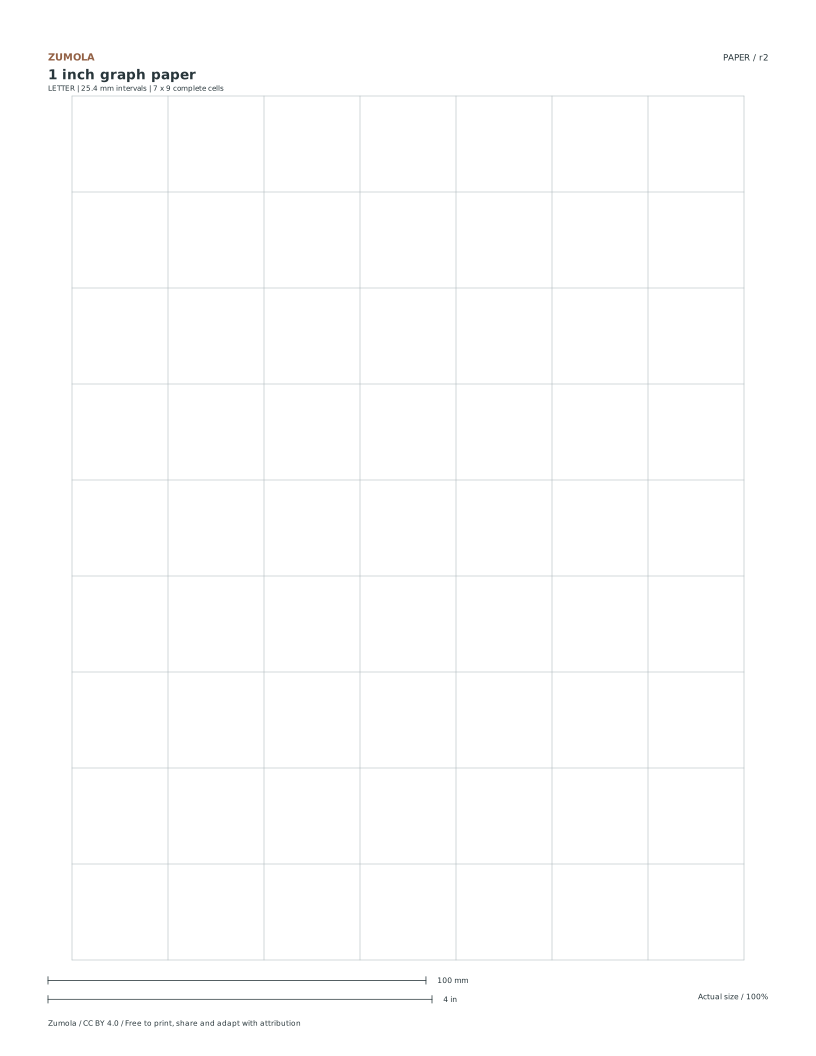
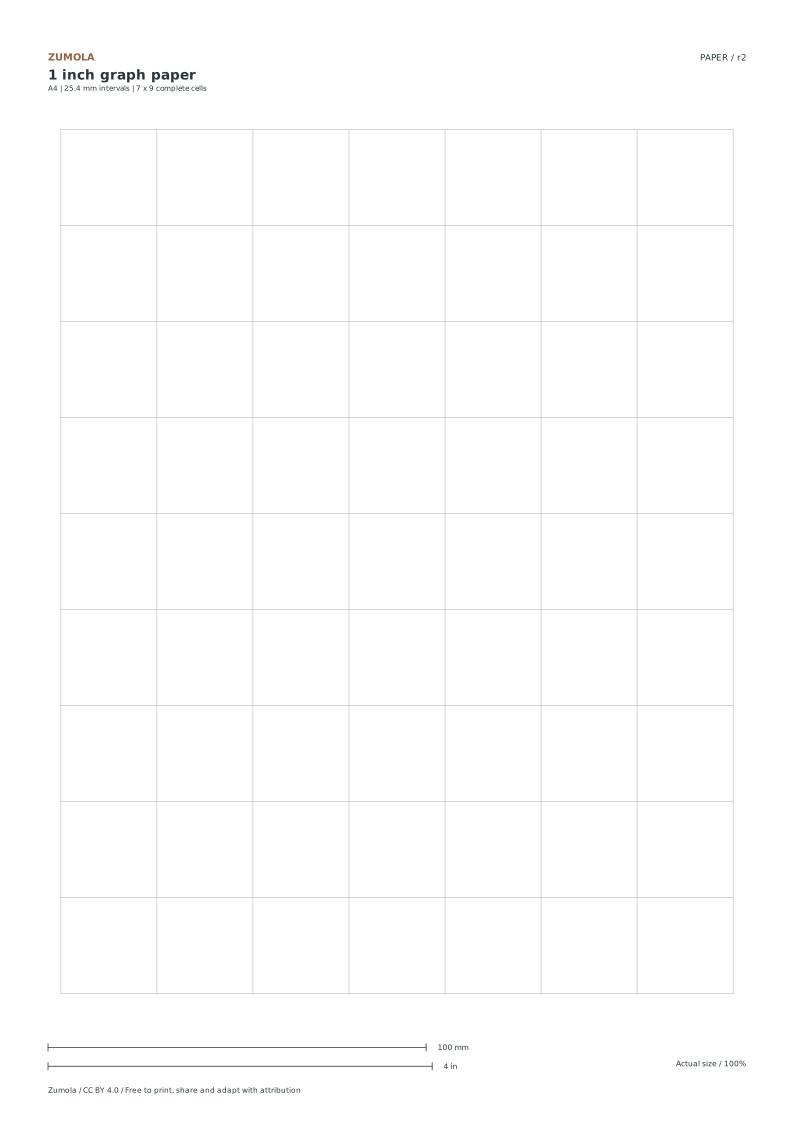
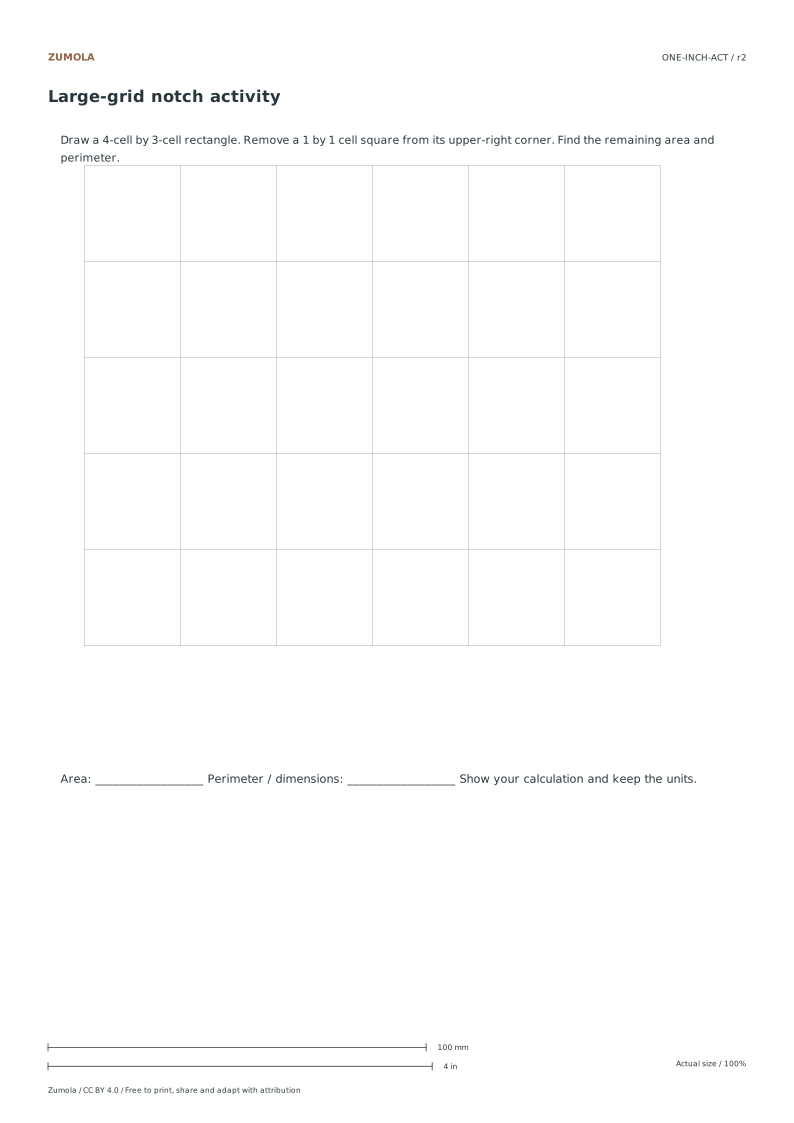
Print 25.4 mm squares and practice area and perimeter with an original corner-notch shape. Both paper sizes keep the same physical interval.
7 columns × 9 rows.
Letter & A4.
Activity + answer included.
More ways to practice
Why the 25.4 mm interval matters for beginners
A one-inch grid is a physical promise: each complete cell between two lines is 25.4 mm across. Beginners benefit because counting whole cells is easier than reading a fine scale, and area becomes visible as a count rather than a formula applied to numbers. The trade-off is resolution. A shape smaller than one cell cannot be placed precisely, so plan tasks where the interesting decisions happen at cell boundaries.
Keep the distinction between grid geometry and drawing content clear. The grid tells you where lines sit; it does not tell you what a shape means. A corner notch on a rectangle is a geometric construction, not an anatomical or engineering claim. State your assumptions, such as lines having negligible width for counting purposes, before you measure.
- Confirm the calibration bar measures correctly at 100% print scale before trusting any count.
- Count only complete cells between printed lines; treat a cell crossed by the paper margin as unavailable.
- Record the grid interval as 25.4 mm and keep all measurements in millimetres or whole cells, not mixed units.
A scale sanity check before you draw
Before committing to a layout, test whether your sheet behaves as expected. Count the complete cells across the usable width and multiply by 25.4 mm. Compare that product with a direct ruler measurement of the same span. A small difference is normal because line width and paper edge effects exist; a large difference means the print scale is wrong or the sheet was cropped.
This check is diagnostic, not a guarantee. It catches gross errors such as printing at fit-to-page, which shrinks the interval, and it catches trimming that removed part of the grid. It cannot certify your printer, so treat the result as evidence about this sheet only.
- Count complete cells across the usable width and multiply by 25.4 mm.
- Measure the same span with a ruler in millimetres.
- If the two values disagree by more than a cell, reprint at 100% and repeat the check.
Judging the result with a rubric
Grid drawing has many valid outcomes, so an exact answer key is the wrong tool. Use a rubric that names what a good attempt does: cells counted consistently, units stated, assumptions written down, and the drawing matching the stated plan. Two students can produce different shapes and both pass if their reasoning is visible and their counts are correct.
Apply the rubric to the worked example below as a model. The point is not to reproduce that shape but to show the standard of explanation expected: every number traceable to a count, every unit named, and every boundary condition stated.
- Check that each measurement names its unit.
- Check that cell counts match the drawn shape.
- Check that assumptions about line width and margins are written, not implied.
Try this example
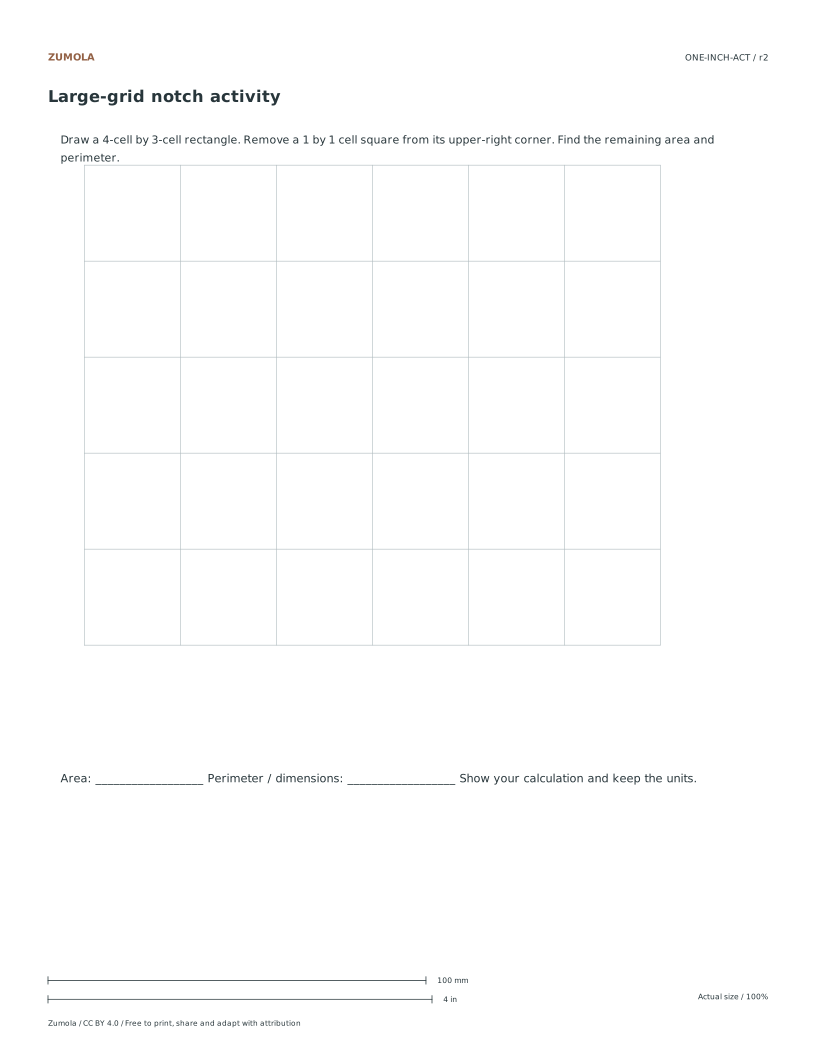
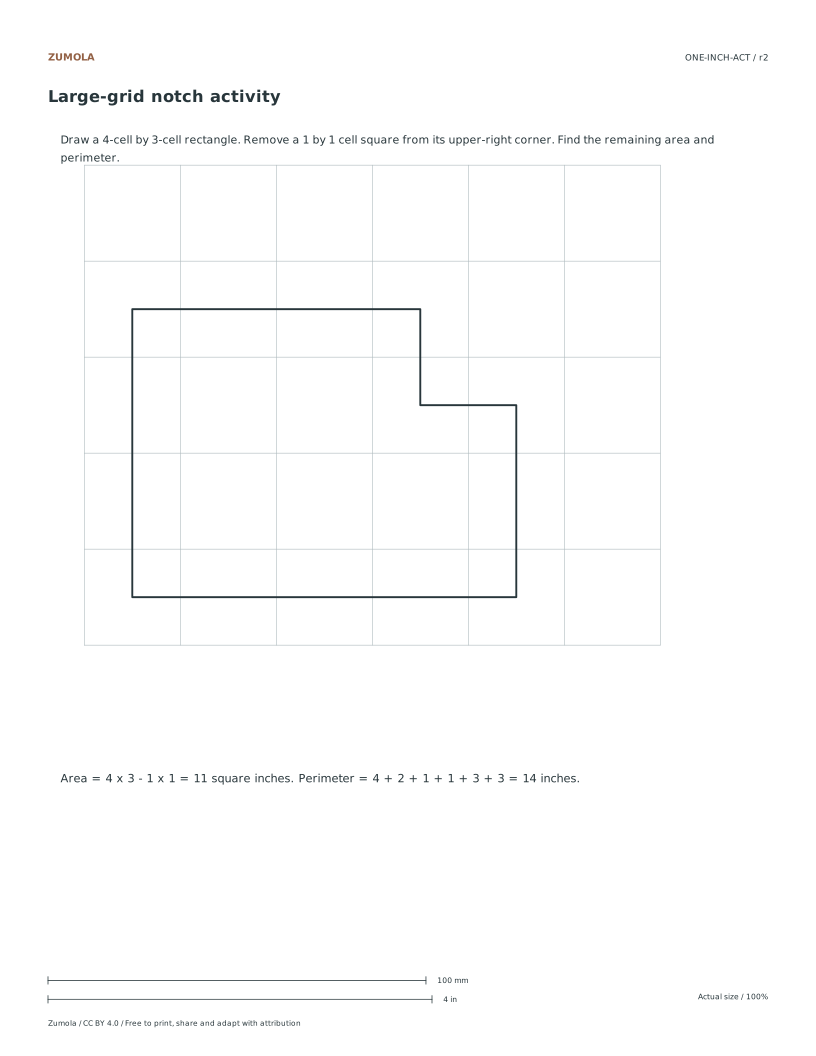
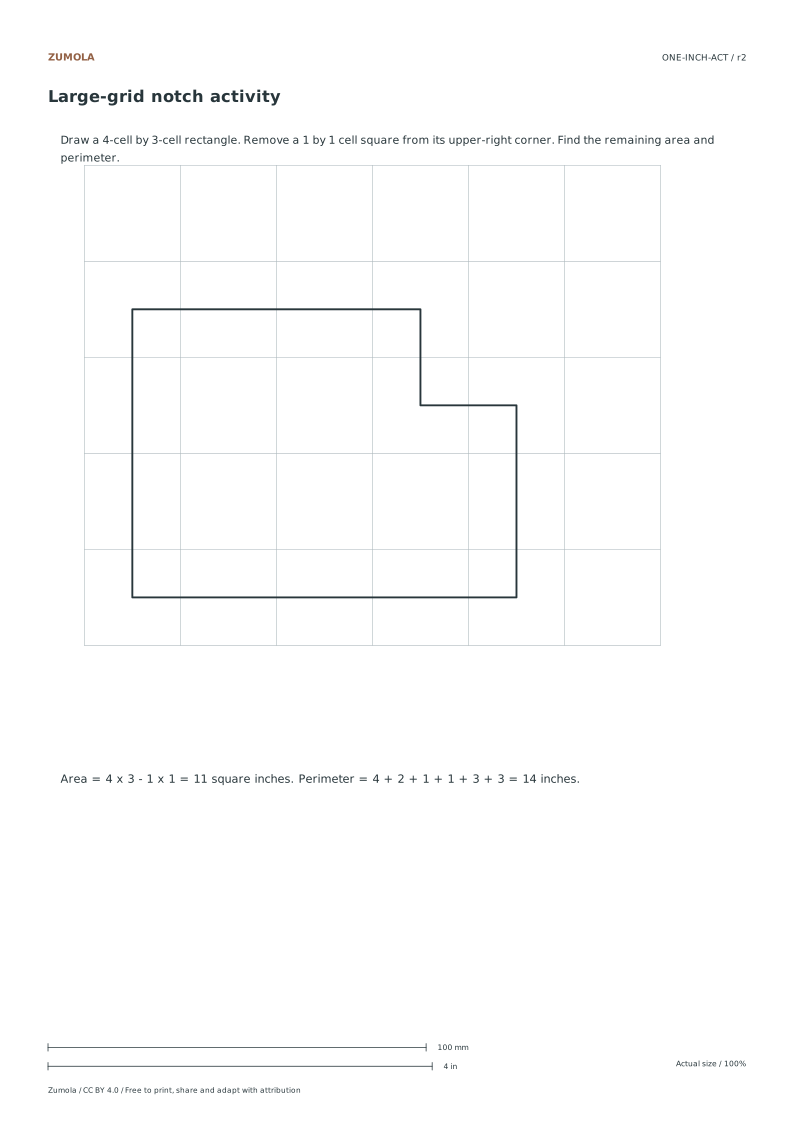
On a verified one-inch sheet, draw a rectangle 4 cells wide and 3 cells tall, then remove a 1-cell square from one corner. Report the area in square millimetres.
Show the worked explanation
The full rectangle covers 4 × 3 = 12 cells. Removing one corner cell leaves 11 complete cells. Each cell is 25.4 mm by 25.4 mm, so one cell is 25.4 × 25.4 = 645.16 square millimetres. Eleven cells give 11 × 645.16 = 7096.76 square millimetres. State that line width is ignored and that all counted cells lie inside the usable inset.
Common mistakes
- Printing with fit-to-page enabled, which shrinks the 25.4 mm interval. Select 100% or actual size, print the calibration bar, and measure it before counting cells.
- Counting a cell that is cut by the paper margin as usable. Mark the inset boundary and count only cells fully inside it.
- Treating one drawn shape as the only correct answer. Score against a rubric covering counts, units, assumptions, and match to the stated plan.
Check your work
- Every measurement states its unit, using millimetres or whole cells consistently.
- Cell counts match the drawn outline, with partial cells handled by a stated rule.
- Assumptions about line width, margins, and print scale are written explicitly.
- The drawing matches the plan described in words, even if the shape differs from another valid attempt.
- The calibration check result is recorded before any measurement is trusted.
Questions before you start
How wide is one cell on this paper?
One complete cell between two printed lines is 25.4 mm, provided the sheet was printed at 100% and the calibration bar checks out.
Can I use the grid to measure area without a formula?
Yes for whole-cell shapes. Count complete cells inside the outline; for partial cells, state how you are treating them rather than guessing silently.
Why does my ruler disagree slightly with the cell count?
Printed line width and paper edge effects cause small differences. A disagreement larger than one cell suggests a scale or cropping problem, so reprint and recheck.