Free original resources
Ternary Graph Paper: Plotting Three-Part Compositions That Sum to 100%
Learn to read and place points on ternary graph paper where three components sum to 100%. Covers axis direction, grid intervals, and a checked worked example.
Free resources
Letter & A4
PDF & SVG
Letter & A4
PDF & SVG
Make it yours.
Free · no signup · calculated in your browser
Your free printable kit.
Original reference, student practice and separate worked answers. No account or payment.
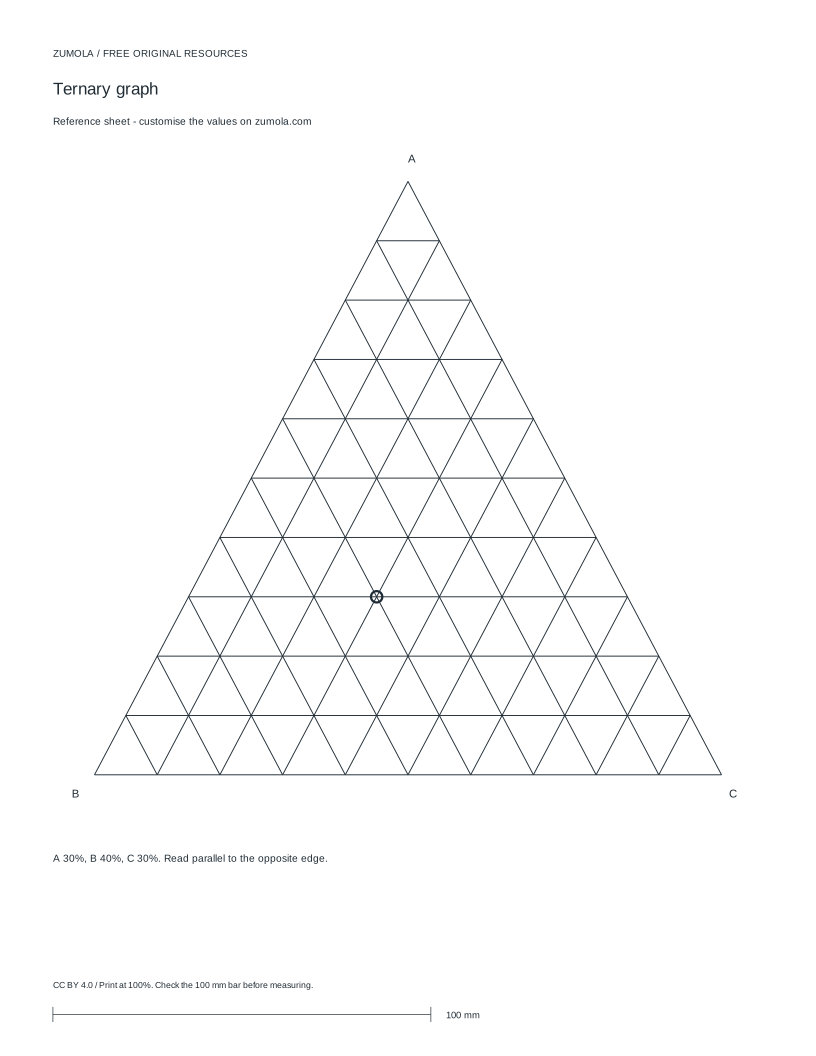
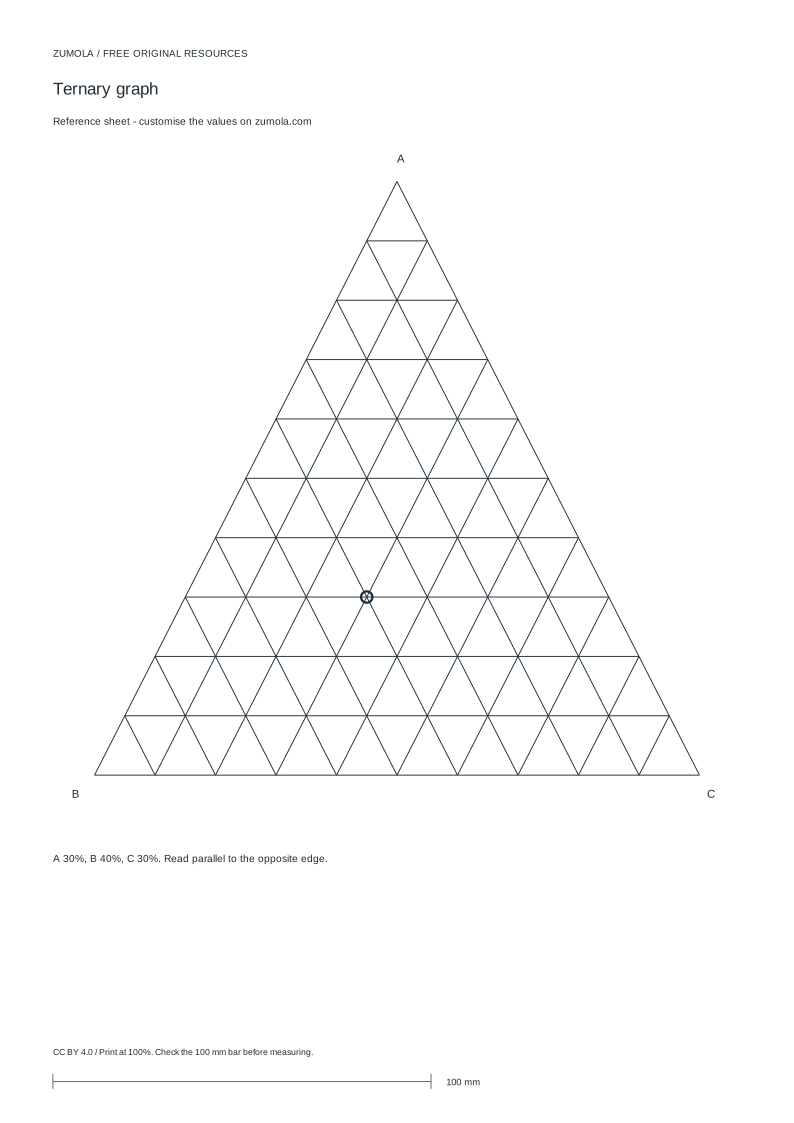
Practice worksheet
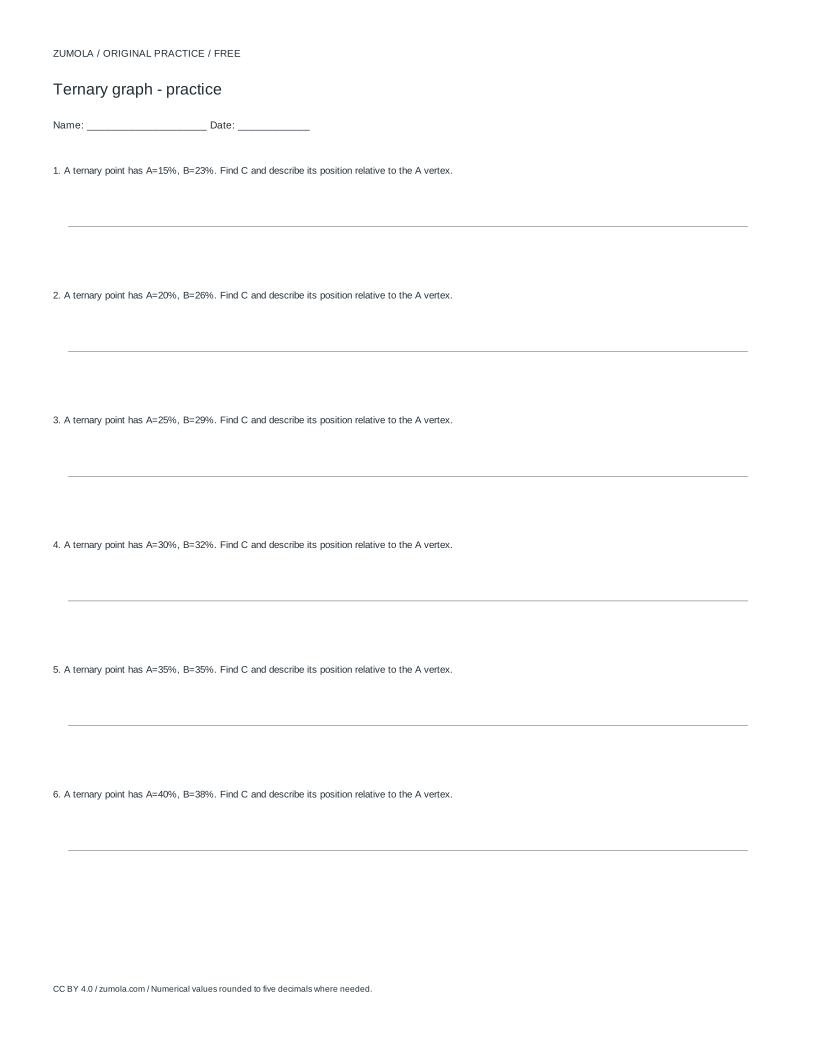
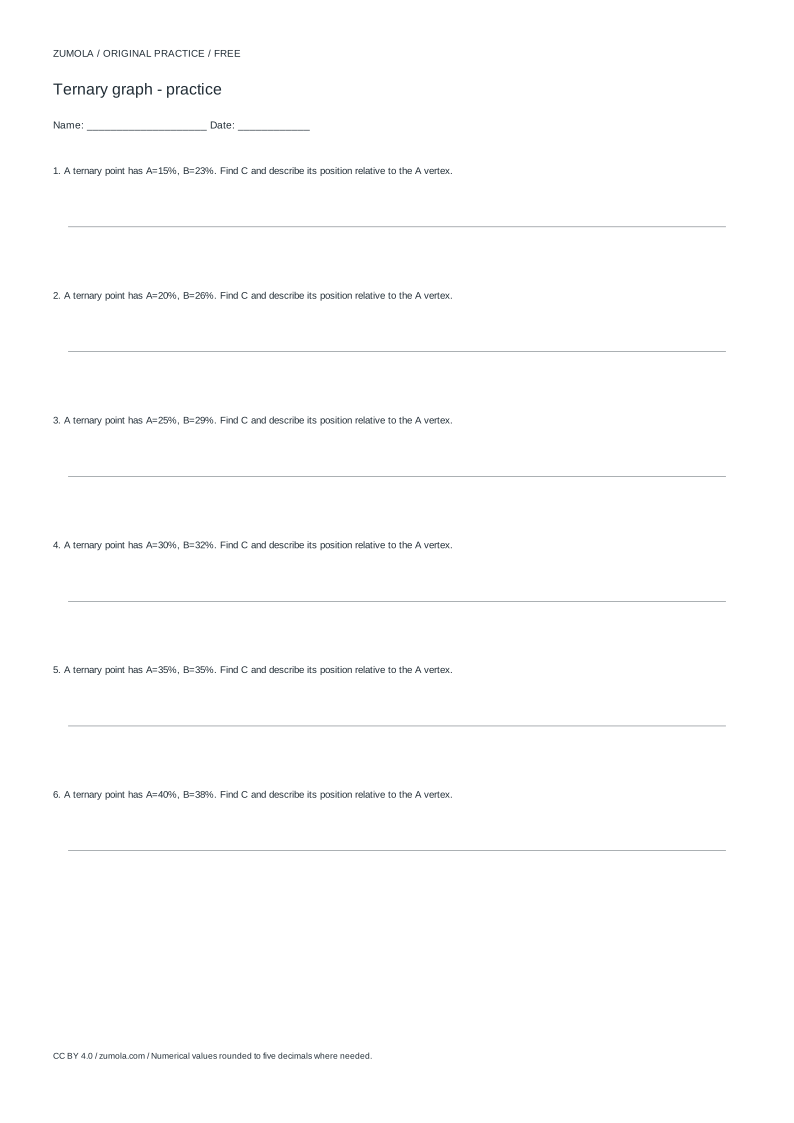
Worked answers / rubric
Print at Actual size / 100%. Check the calibration bar before using physical dimensions.
Ternary graph paper shows three components that always add to 100%, drawn inside an equilateral triangle. Each corner represents one component at its maximum, and each side opposite a corner marks where that component is zero. This page explains how the three axes run, how to read grid intervals, and how to place a point from a composition such as 30, 40, 30. It also covers the errors that most often shift a point to the wrong spot.
How the three axes work
A ternary plot uses an equilateral triangle. Each vertex is a pure component: the top vertex is component A at 100%, the lower-left vertex is B at 100%, and the lower-right vertex is C at 100%. Any point inside the triangle is a mixture of all three.
The key rule is direction. The percentage of A is read along lines parallel to the side opposite the A vertex, which is the bottom edge. Moving from that bottom edge up toward the top vertex raises A from 0% to 100%. The percentage of B is read along lines parallel to the side opposite the B vertex, the right edge. The percentage of C is read along lines parallel to the side opposite the C vertex, the left edge.
Because the three values must total 100%, only two numbers are independent. Once A and B are fixed, C is determined. Grid lines at a chosen interval, such as every 10%, form a triangular lattice. Each family of parallel lines belongs to one component, so a point sits where three lines cross, one from each family.
- Identify which vertex stands for each component and label them before plotting.
- Decide the grid interval, for example 10%, and note that each family of parallel lines belongs to one component.
- Start from the side opposite the component you are reading and count inward toward its vertex.
- Plot two components, then confirm the third equals 100% minus their sum.
Reading and placing a point
To place a composition, work component by component. For A, find the line parallel to the bottom edge at the A value and move toward the top vertex. For B, find the line parallel to the right edge at the B value. For C, find the line parallel to the left edge at the C value. All three lines meet at one point if the values sum to 100%.
A useful check is the side test. A point with A equal to 0% lies on the bottom edge. A point with B equal to 0% lies on the right edge. A point with C equal to 0% lies on the left edge. If your plotted point sits on an edge, one component should read exactly zero.
When the interval is 10%, values that are not multiples of 10 fall between grid lines. Estimate the fraction of the gap carefully and keep the same reading direction for all three components. Mixing directions, such as counting B from the wrong side, is the most common cause of a misplaced point.
- Read A by counting from the bottom edge toward the top vertex.
- Read B by counting from the right edge toward the lower-left vertex.
- Read C by counting from the left edge toward the lower-right vertex.
- Verify the three readings add to 100% before finalizing the point.
Worked example: 30, 40, 30
Suppose the components are A = 30%, B = 40%, and C = 30%. They sum to 100%, so the point is valid. With a 10% interval, each value lands on a grid line, which makes the placement easy to check.
Find the A line: the line parallel to the bottom edge at 30%, counted up from the bottom. Find the B line: the line parallel to the right edge at 40%, counted from the right edge toward the lower-left vertex. Find the C line: the line parallel to the left edge at 30%, counted from the left edge toward the lower-right vertex. The three lines cross at a single point.
As a sanity check, the point should sit closer to the B vertex than to the A or C vertices, because B is the largest share at 40%. It should be equidistant in composition terms from the A and C sides, since A and C are equal at 30%. If your point looks closer to A than to C, recheck the direction you used for one of those axes.
- Confirm 30 + 40 + 30 = 100 before plotting.
- Mark the 30% A line parallel to the bottom edge.
- Mark the 40% B line parallel to the right edge.
- Mark the 30% C line parallel to the left edge.
- Place the point where all three lines intersect and confirm it is nearest the B vertex.
Printing and scale notes
Ternary paper is usually printed at full size so the grid spacing stays consistent. Before relying on a printed sheet for measurement, print a calibration bar and check it with a ruler. If the bar measures short or long, adjust the print scaling rather than stretching the drawing afterward.
The triangle geometry assumes an equilateral shape. If a printed sheet is distorted, the parallel grid lines will no longer meet at consistent angles, and readings will drift. Keep the sheet flat and avoid scaling that changes width and height differently.
Numbers on a schematic chart are abstract coordinate units unless a unit is stated. Do not assume that a grid interval of 10% corresponds to a physical distance on the page; the percentage is a composition value, not a length.
- Print a calibration bar and measure it with a ruler before using the sheet.
- Adjust print scaling if the bar is off, then reprint.
- Check that the triangle looks equilateral and the grid lines stay parallel.
- Record compositions as percentages, not as measured lengths.
Try this example
Plot the composition A = 30%, B = 40%, C = 30% on ternary paper with a 10% grid interval, and state where the point should sit relative to the vertices.
Show the worked explanation
The values sum to 100%, so the point is valid. The A line is parallel to the bottom edge at 30%, counted upward. The B line is parallel to the right edge at 40%, counted from the right edge. The C line is parallel to the left edge at 30%, counted from the left edge. The three lines meet at one point. Because B is the largest share, the point lies nearest the B vertex, and because A and C are equal, it is balanced between the A and C sides.
Common mistakes
- Counting a component from the wrong side of the triangle. Always start from the side opposite that component's vertex and count toward the vertex.
- Plotting three values that do not sum to 100%. Add the three values first; if the total is not 100%, adjust one value before plotting.
- Assuming a printed sheet is accurate without checking scale. Print a calibration bar, measure it, and correct print scaling before plotting.
Check your work
- All three component values are labeled and their sum is confirmed as 100%.
- Each axis is read from the correct opposite side toward its vertex.
- The plotted point lies at the intersection of the three component lines.
- The point's position is consistent with the largest and smallest component values.
- Any printed sheet is checked with a calibration bar before measurement.
Questions before you start
Why do only two numbers need to be given?
Because the three components must total 100%, the third value is fixed once the other two are known. Giving all three is a useful check but not strictly necessary.
Where does a component equal to zero sit?
On the side opposite that component's vertex. For example, a point with A equal to 0% lies on the bottom edge.
Can I use a ternary plot for values that do not sum to 100%?
No. Ternary coordinates assume a fixed total. Normalize your values to percentages that sum to 100% before plotting.