Free printable resources · Original practice

Engineering paper.
Make room for the working.

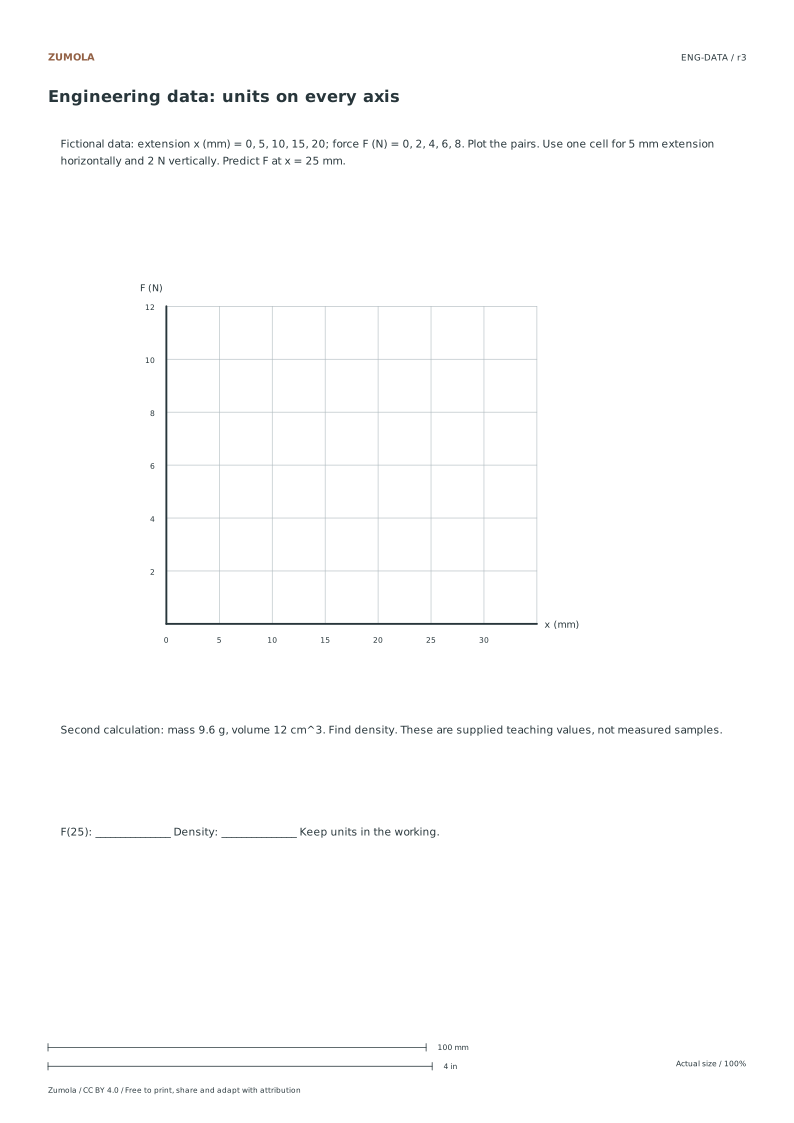
Choose a calculation layout with a labeled header and notes strip. Add your own axis units, then work through the fictional data and density exercise.

5 per inch or 5 mm.
Plotting exercise + answers.

A printable task with a way to check it

Choose a calculation layout with a labeled header and notes strip. Add your own axis units, then work through the fictional data and density exercise.

Choose US Letter or A4, then download the PDF for printing or the SVG for editing. Keep the student worksheet separate from its answer or reference completion. All files, including the answers, are free without signup.

Choose your paper and download

Download paper size

Every worksheet and answer is free. No signup.

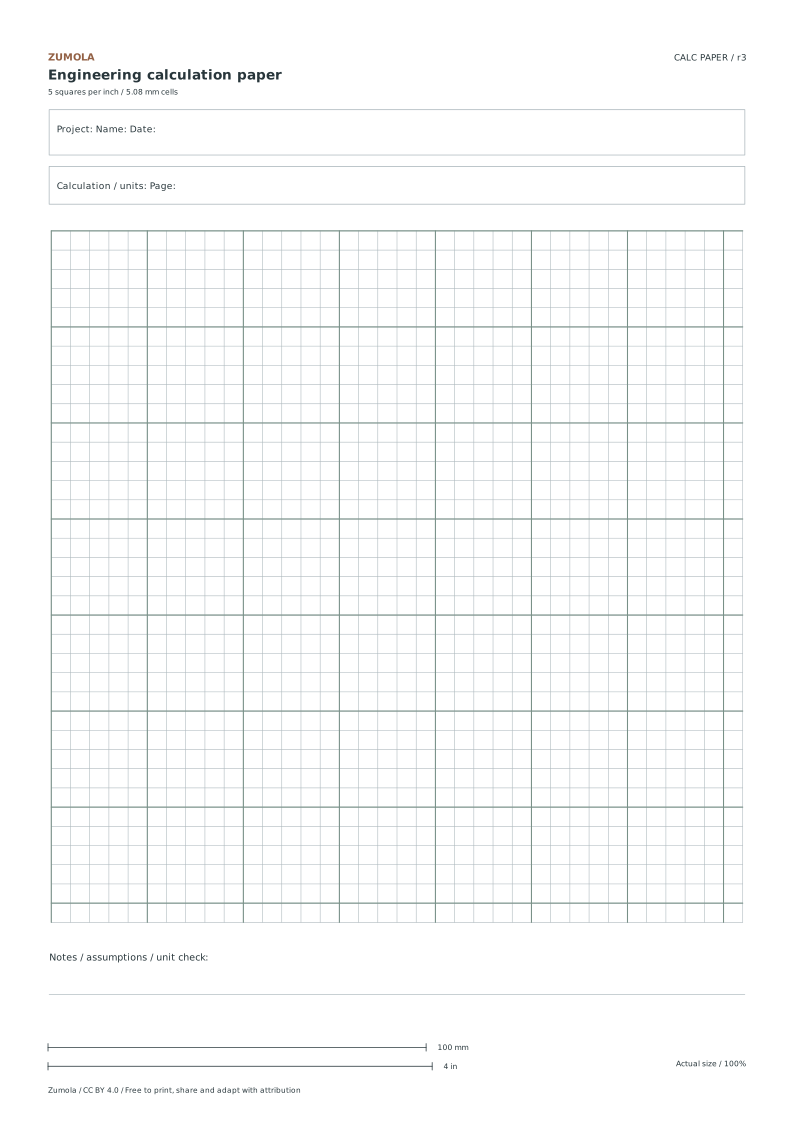
Engineering paper: 5 squares per inch preview
Free original resource

Engineering paper: 5 squares per inch

Original blank printable. Choose Letter or A4; print at actual size.

1 page per file · free · CC BY 4.0

All paper sizes & editable formats
US Letter

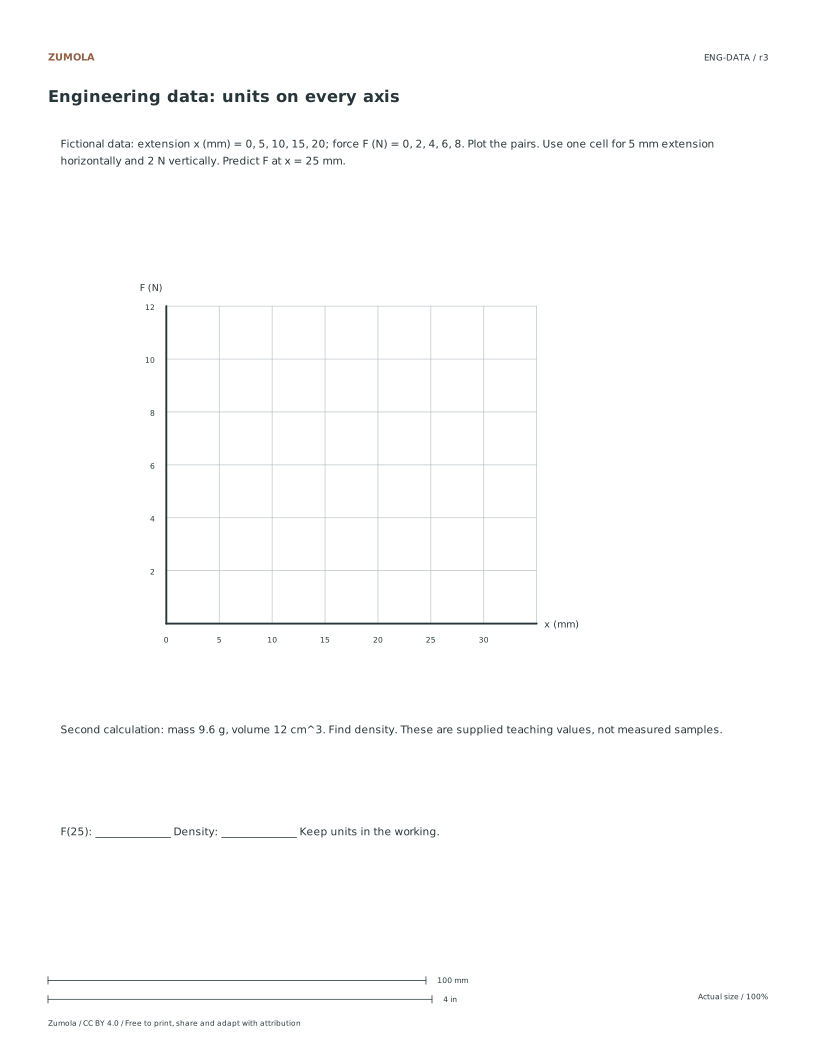
From a data table to a labeled line

Extension x (mm)Force F (N)
00
52
104
156
208

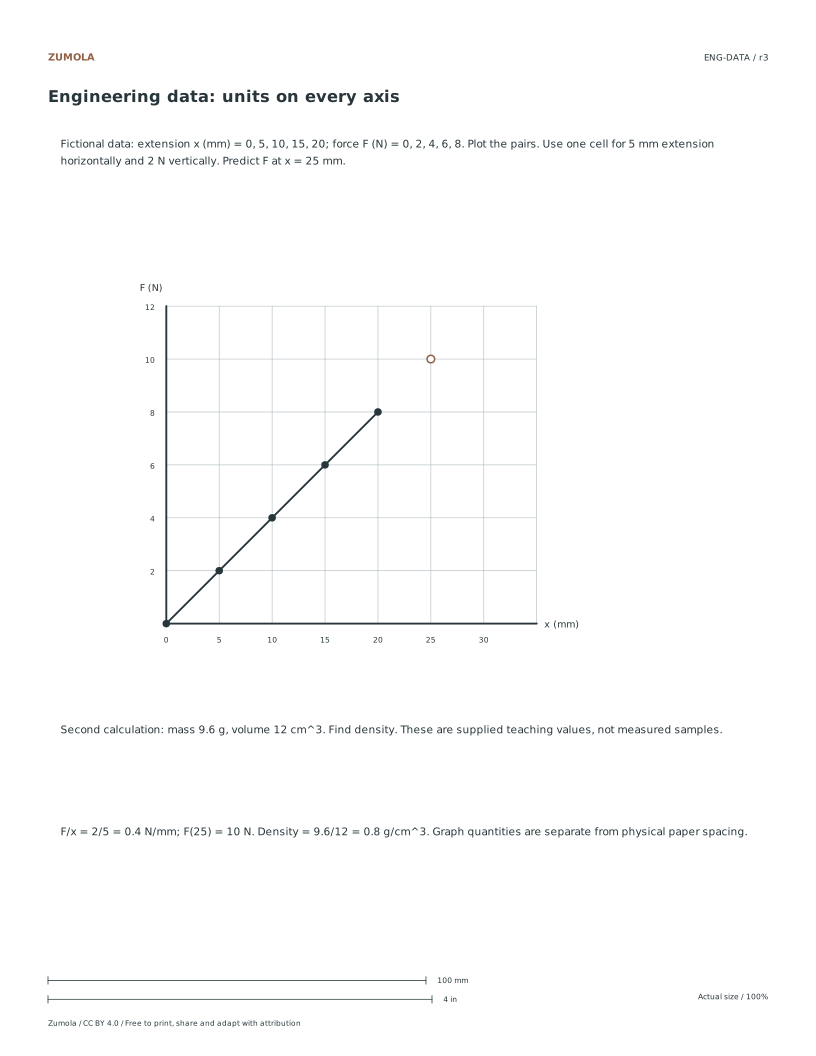
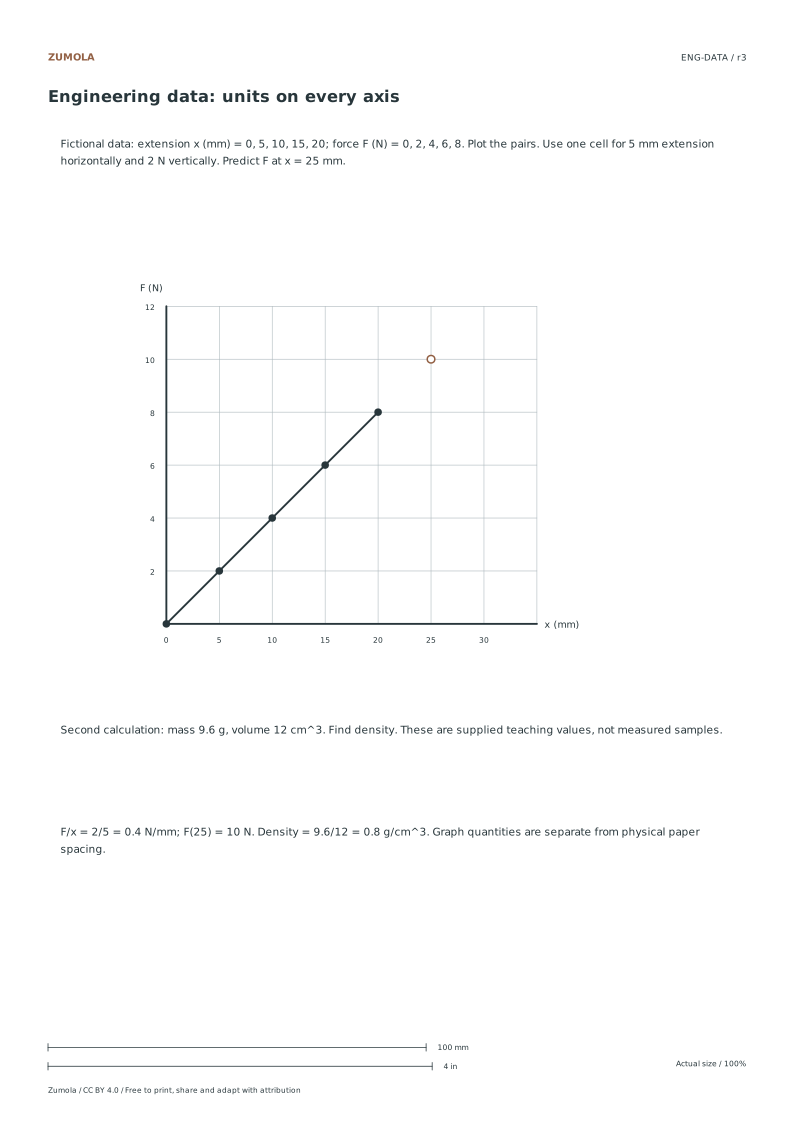
The fictional force increases by 2 N for each 5 mm extension. The slope is 0.4 N/mm; extending the stated linear pattern predicts 10 N at 25 mm. This is an arithmetic model in a worksheet, not a measured material law.

A separate calculation gives mass 9.6 g and volume 12 cm³. Density = mass / volume = 9.6 / 12 = 0.8 g/cm³. Keep the cubic unit in the denominator. Use the notes space to show the substitution and result.

Blank paperFine intervalMajor interval
5 squares per inch5.08 mm25.4 mm (1 inch)
Metric engineering5 mm25 mm

These print the grid on the front as ordinary vector lines. They are calculation sheets, not a claim to reproduce translucent commercial engineering pads with reverse-side printing. Use a pencil for working and a darker mark for the final result, and write the scale before plotting on a fresh blank sheet.

Work through the page

  1. Selecting the Correct Grid Variant

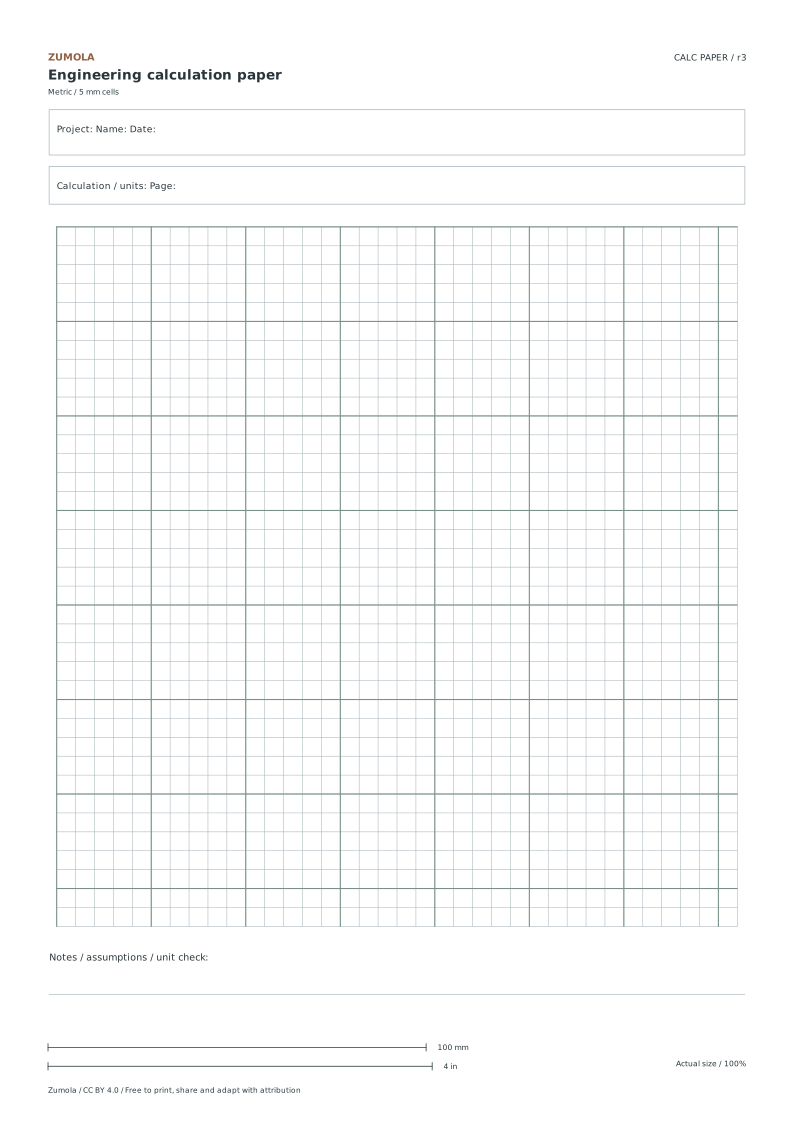
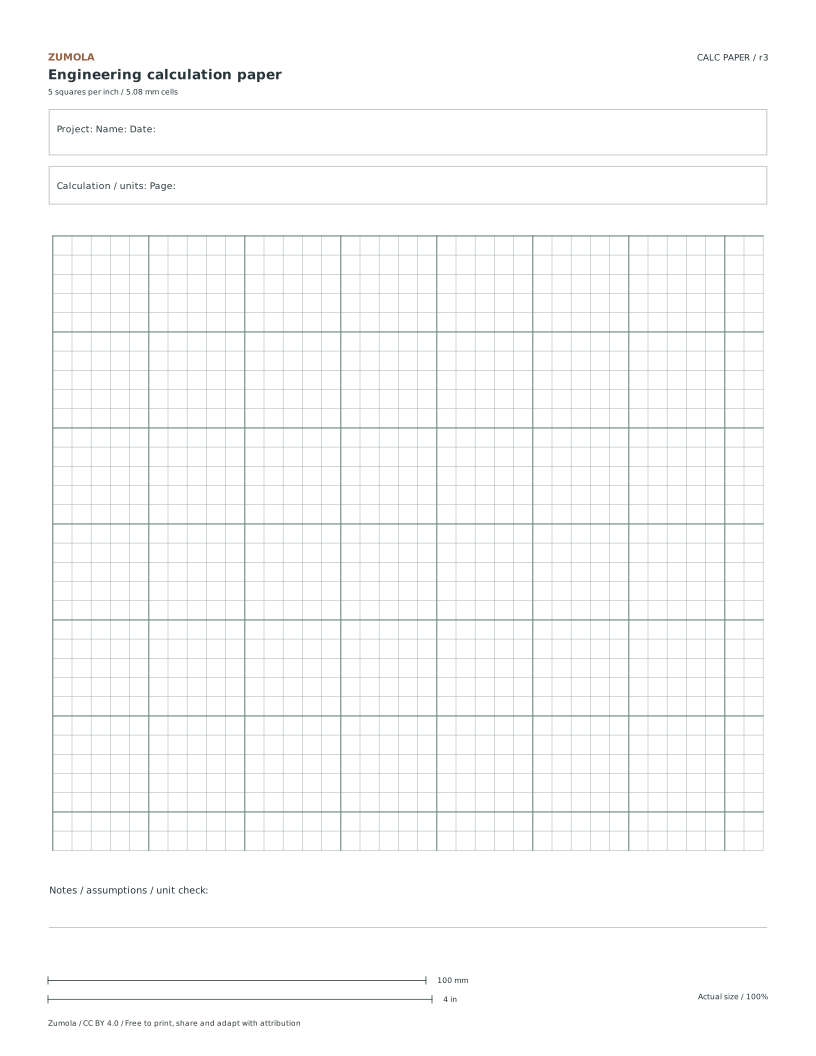
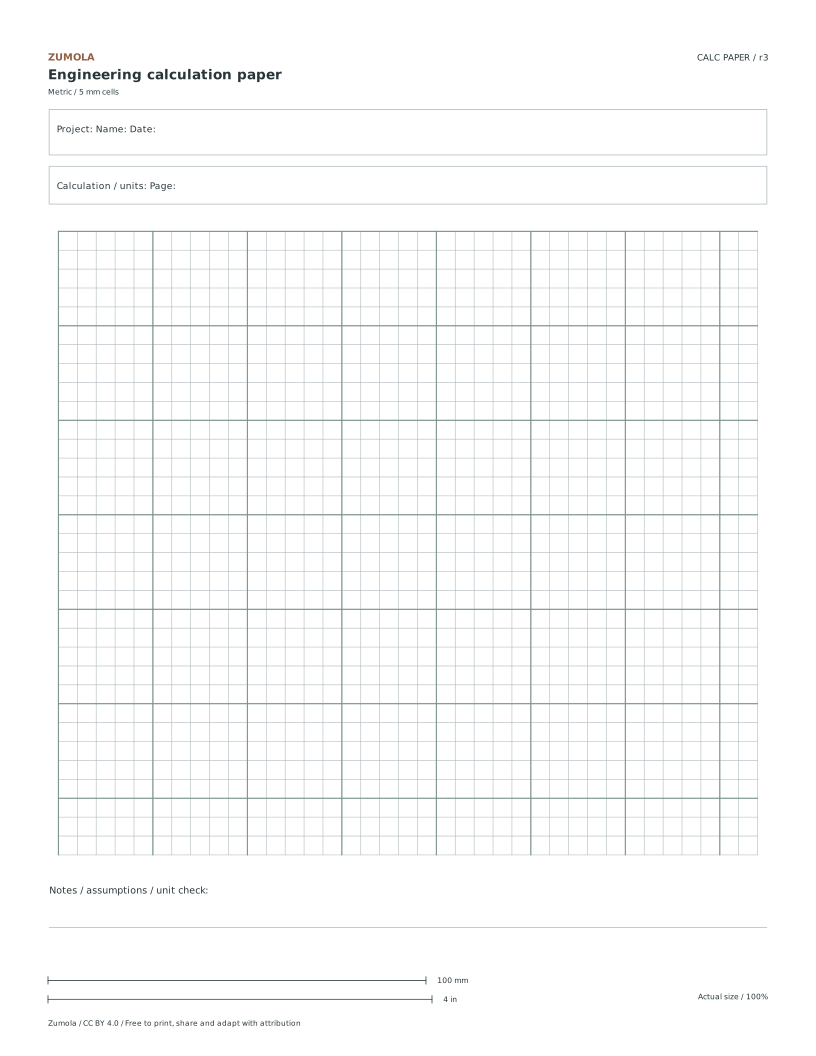
    Choose physical paper spacing independently from your data units. The five-squares-per-inch paper has 5.08 mm cells and a heavier line every 25.4 mm. The metric version has 5 mm cells with a heavier line every 25 mm. Either can hold a plot in millimeters, seconds, newtons or another labeled quantity. Both layouts include Project, Name, Date and Page fields plus a notes strip. Pick the version that is convenient for your ruler or class, and state the axis scale explicitly instead of assuming that a physical paper square defines the measured quantity.

  2. Mapping Data to Grid Cells

    The separate data worksheet provides its own larger plotting plane with 14 mm cells for readable labels. On that chart, one horizontal cell represents 5 mm of extension and one vertical cell represents 2 N of force. Plot the five fictional data pairs, then extend the linear pattern to x = 25 mm. The slope is 2 N / 5 mm = 0.4 N/mm, so F = 0.4x gives 10 N at that point. The 14 mm physical chart spacing does not change those data units. On blank engineering paper, select a new cell-to-data mapping and label it before plotting.

  3. Verifying Density Calculations

    Use the worksheet to practice arithmetic and data layout by calculating density from given mass and volume values. Divide the mass of 9.6 grams by the volume of 12 cubic centimeters to derive a density of 0.8 grams per cubic centimeter. This exercise focuses on correct numerical handling and spatial organization rather than physical measurement validation. The worked answer serves as a reference for checking arithmetic precision. Ensure that units are clearly labeled in the header or notes area to maintain clarity. This task reinforces the importance of consistent unit usage and accurate division in engineering contexts, providing a structured environment for practicing fundamental calculation skills without relying on external measurement tools.

Small checks that catch common errors

Watch forCheck instead
Confusing the physical grid spacing with the data axis scale when plotting points.Remember that one horizontal cell represents five millimeters of extension and one vertical cell represents two Newtons of force, distinct from the physical cell dimensions.
Assuming metric paper can only show metric quantities.Either physical grid can show any stated units. Label both axes and record the quantity represented by each interval.
Treating the density calculation as a validated engineering design measurement.Recognize that the mass and volume values are fictional data for an arithmetic exercise, not results from real-world physical measurements.

Print a test sheet before a full pack

Use the PDF that matches the paper loaded in your printer. Choose Actual size / 100% and turn off Fit, Shrink and browser headers. The SVG keeps millimeter dimensions, but an editor or browser can rescale it; the PDF is the simpler print path. Measure any calibration bars with a separate physical ruler when the exercise depends on printed size. A screen preview does not establish physical scale.

Packs combine the same individual pages; they are not extra different exercises. Print a student copy first and keep references nearby for review. Letter and A4 preserve the stated grid spacing or model definition while their surrounding white space can differ. Color is optional: the references also use line position, text or relative lightness to explain the result.

Useful answers

What file formats are available for the printable resource?

The resource is available in PDF and SVG formats, compatible with both Letter and A4 paper sizes for flexible printing options.

How many major interval lines appear on the grid?

Major interval lines appear every five cells in both the imperial and metric variants, helping to visually group data points for easier reading.

What information should be entered in the header fields?

Use the Project, Name, Date and Page fields for your calculation record. Put assumptions, conversions and the meaning of each plotted interval in the notes strip.

Are the answers and editable files free too?

Yes. Every linked PDF, SVG, worksheet and answer is free without signup. The original Zumola resources use CC BY 4.0: credit Zumola, link the license and indicate changes. Analytics consent is not required to download or use them.

Keep practicing

Further reading: NIST: exact inch conversion. The downloadable diagrams and exercises are original Zumola work.

More ways to practice

Choose the axis type before you draw

Every plot starts with a decision about axis type. A linear axis adds equal physical distance for equal numerical change, so a step of 2 occupies the same space everywhere. A logarithmic axis adds equal physical distance for equal multiplicative change, so each decade (1 to 10, 10 to 100) occupies the same space. Logarithmic axes reject zero and negative values because no power of ten produces them.

Mixed plots are common: a linear x-axis with a logarithmic y-axis suits data that grows multiplicatively. State the type beside each axis label so a reader never has to guess. If your data includes a zero or a negative value, a log axis cannot represent it; either switch to linear or explain the exclusion in the notes strip.

Ternary coordinates follow a different rule: the three components must sum to a constant, usually 100 percent. Check the sum before plotting any point, because a row that sums to 98 or 103 will land in the wrong place even if each individual value looks reasonable.

  1. List the minimum and maximum of each variable, including any zero or negative values.
  2. Decide linear or logarithmic per axis; reject log if any value is zero or negative.
  3. For ternary data, add the three components and confirm they equal the chosen constant.
  4. Write the axis type and units next to each axis label before drawing the first point.

A scale check you can do in seconds

Before plotting, confirm that your chosen scale fits the sheet. Count the major divisions available on each axis and multiply by the value per division. If the product is smaller than your data range, the plot will run off the edge. If it is much larger, the data will crowd into a corner and small differences will vanish.

A useful habit is to pick a scale where the largest value lands near the far end of the axis but not beyond it. Then verify one intermediate point by hand: read its position off the grid and convert back to a number. If the conversion does not match the table, the scale or the axis type is wrong.

Keep the notes strip for recording the scale factor and axis type. That single line lets a reader reconstruct your reasoning without asking you.

  1. Multiply major divisions by value per division for each axis.
  2. Compare the product with your data range; adjust the scale if the range overflows or crowds.
  3. Plot one intermediate point, read it back from the grid, and compare with the table value.
  4. Record scale factor and axis type in the notes strip.

Judging a finished sheet with a rubric

Engineering plots have many valid appearances, so an exact-answer check is the wrong tool. Use a rubric instead: does each axis carry a label, unit, and type? Does the scale fit the data without overflow? Are points placed consistently with the table? Is the notes strip complete enough for another person to reproduce the plot?

A sheet can be visually plain and still pass every criterion, or decorative and fail several. Judge the communication, not the ornament.

  1. Check axis labels, units, and axis type on both axes.
  2. Confirm the scale fits the data range with no overflow.
  3. Spot-check two points against the table.
  4. Confirm the notes strip records scale and axis type.

Try this example

Plot four points on a linear x-axis from 0 to 8 with 8 major divisions, and a linear y-axis from 0 to 40 with 8 major divisions. Data: (1, 5), (3, 15), (5, 25), (7, 35).

Show the worked explanation

Each x division equals 1 unit and each y division equals 5 units. Point (1, 5) sits one division right and one division up. Point (3, 15) sits three divisions right and three up. Point (5, 25) sits five right and five up. Point (7, 35) sits seven right and seven up. Reading (5, 25) back from the grid gives five divisions times 1 and five divisions times 5, matching the table, so the scale is consistent.

Common mistakes

Check your work

Questions before you start

Can I mix a linear axis with a logarithmic axis on one sheet?

Yes. State the type beside each axis label so the reader knows which rule applies where.

Why does a logarithmic axis reject zero?

No power of ten equals zero, so zero has no position on a log scale. Negative values are rejected for the same reason.

How do I know my ternary data is valid?

Add the three components; they must equal the chosen constant, typically 100 percent, before any point is plotted.
Explore this theme →

Keep exploring

Worksheet preview

Full printable sheet preview

Fit-to-screen preview. Download the PDF to print at actual size.