Use base-10 spacing on both axes. Plot two exact data sets and separate the exponent of a power relation from the physical angle of a line.
Choose US Letter or A4, then use the PDF for printing or SVG for editing. Student worksheets and answer or reference files stay separate. Every linked file is free without signup.
Choose your paper and download
Download paper size
Every worksheet and answer is free. No signup.
Free original resource
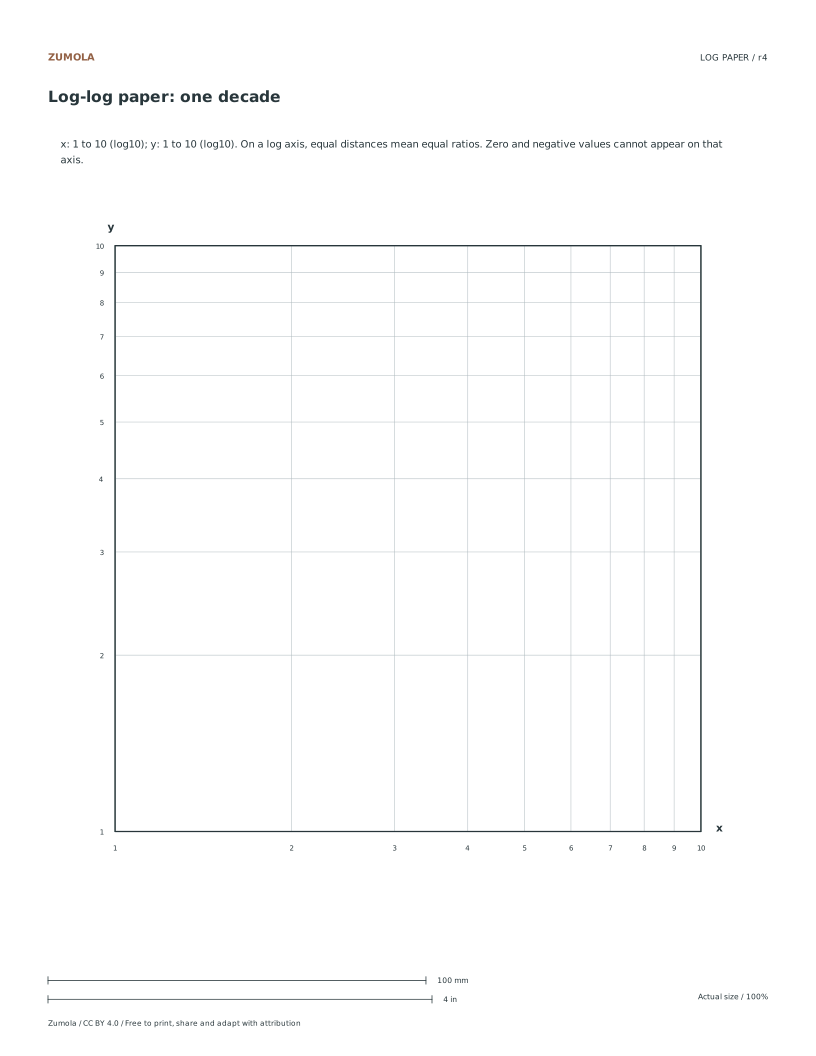
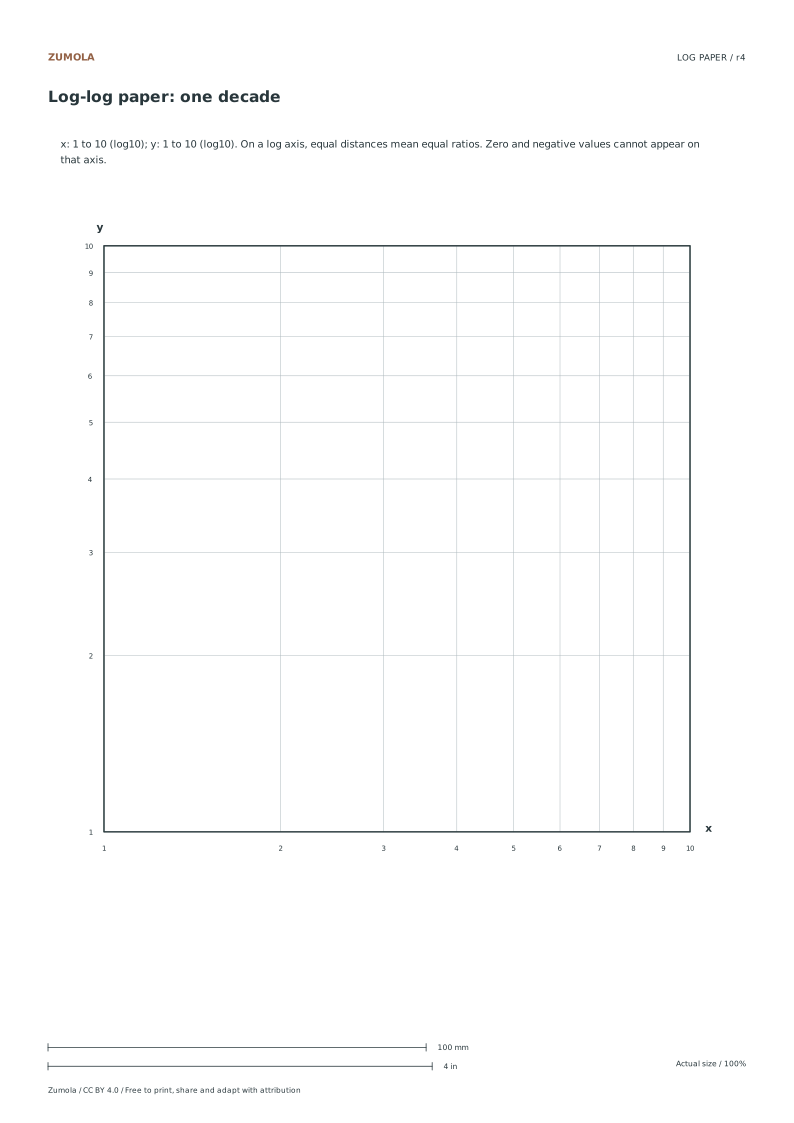
Log-log paper: one decade
Original blank grid. Letter or A4. Free PDF and SVG.
Use the student pack first, then compare the reference or answer. Packs are PDFs; individual sheets below also include editable SVG files. The paper choice applies to every download.
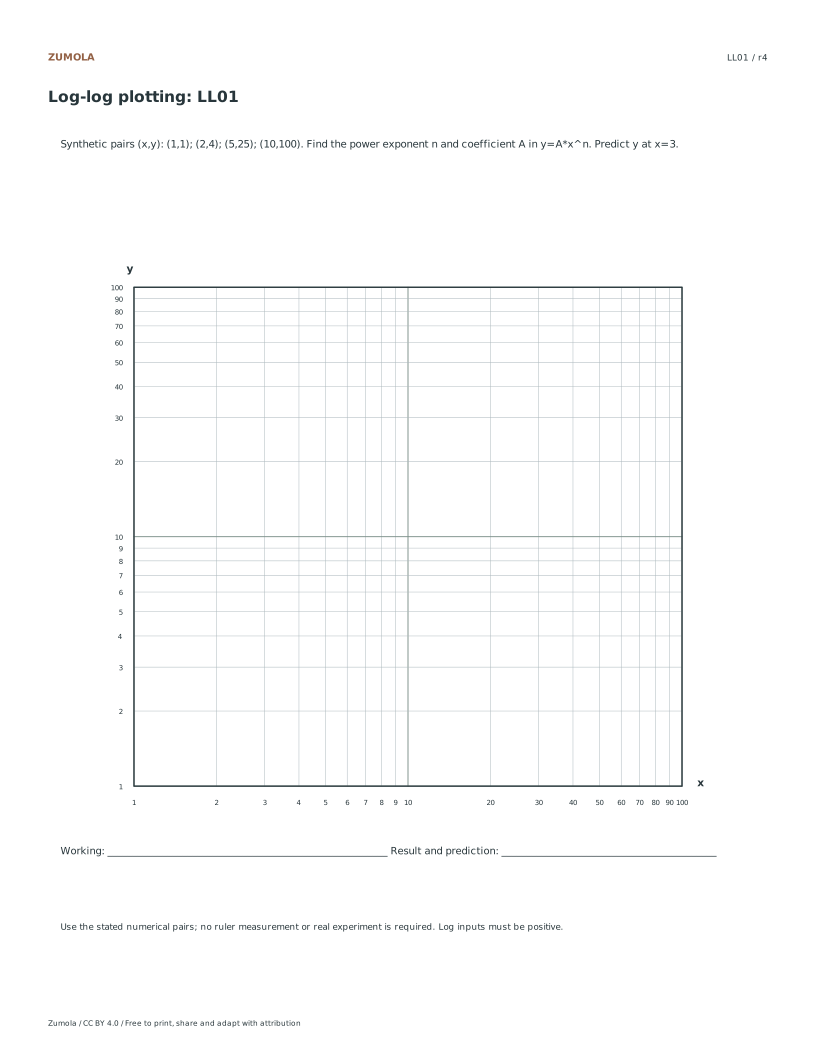
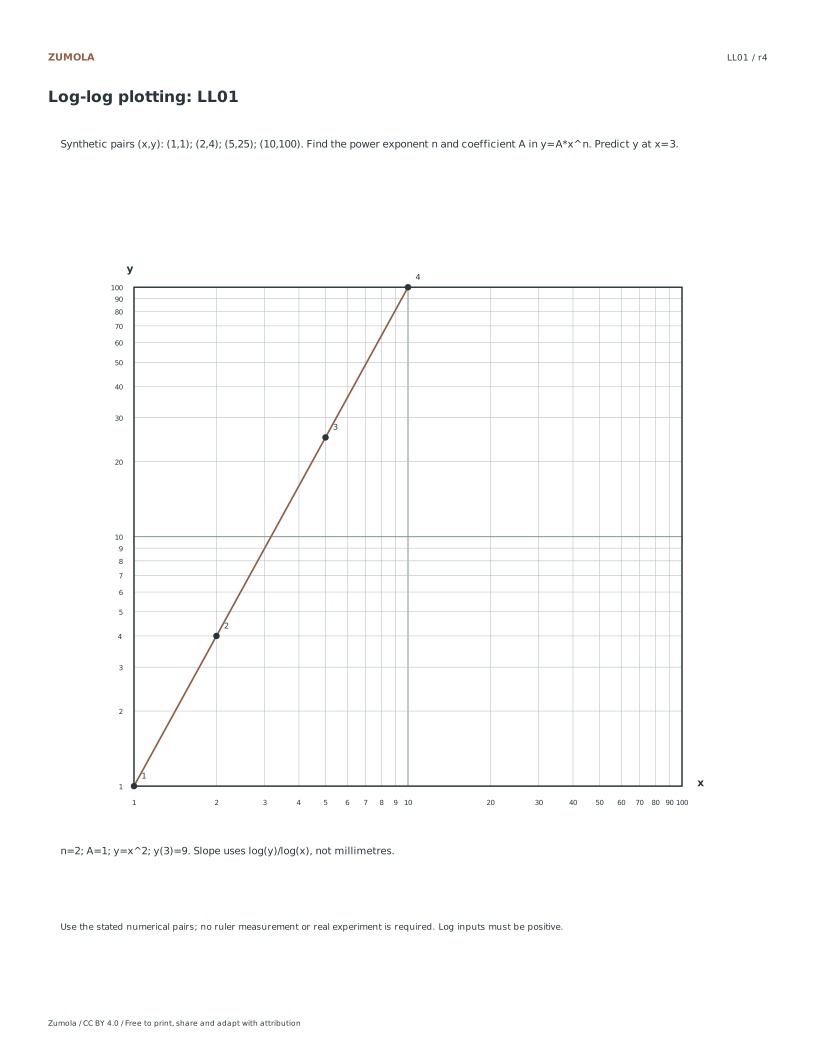
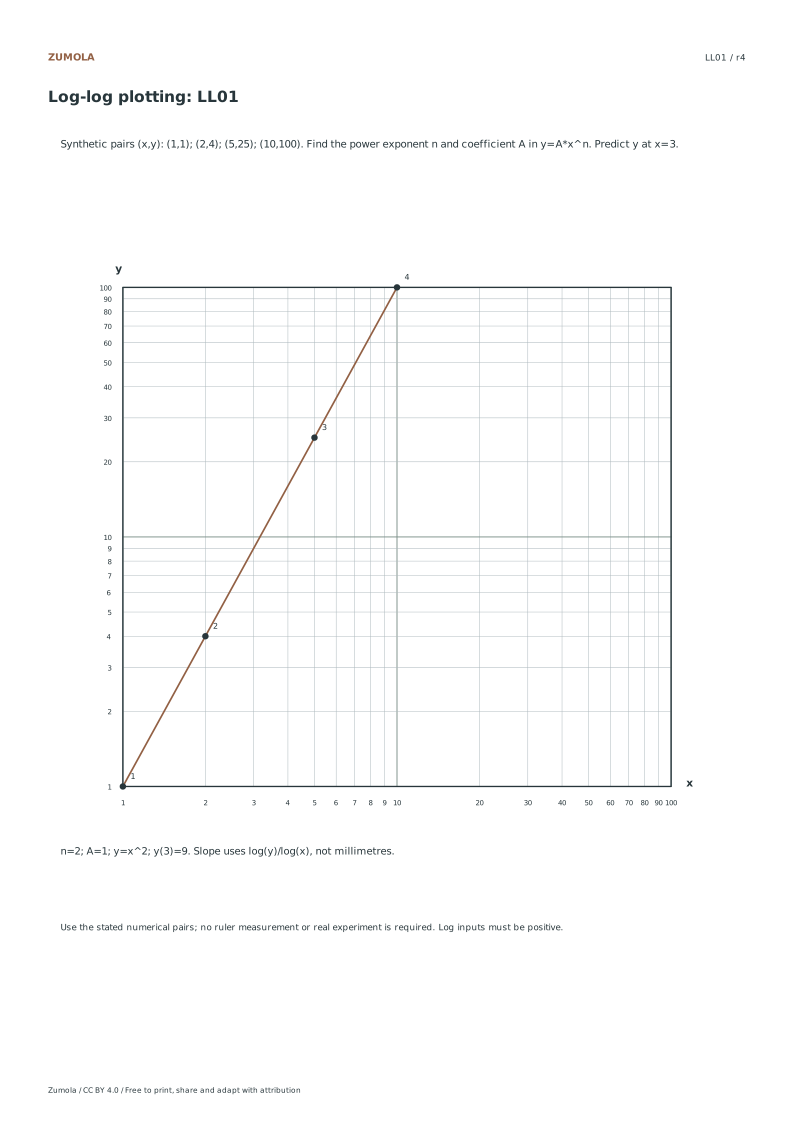
n=2; A=1; y=x^2; y(3)=9. Slope uses log(y)/log(x), not millimetres.
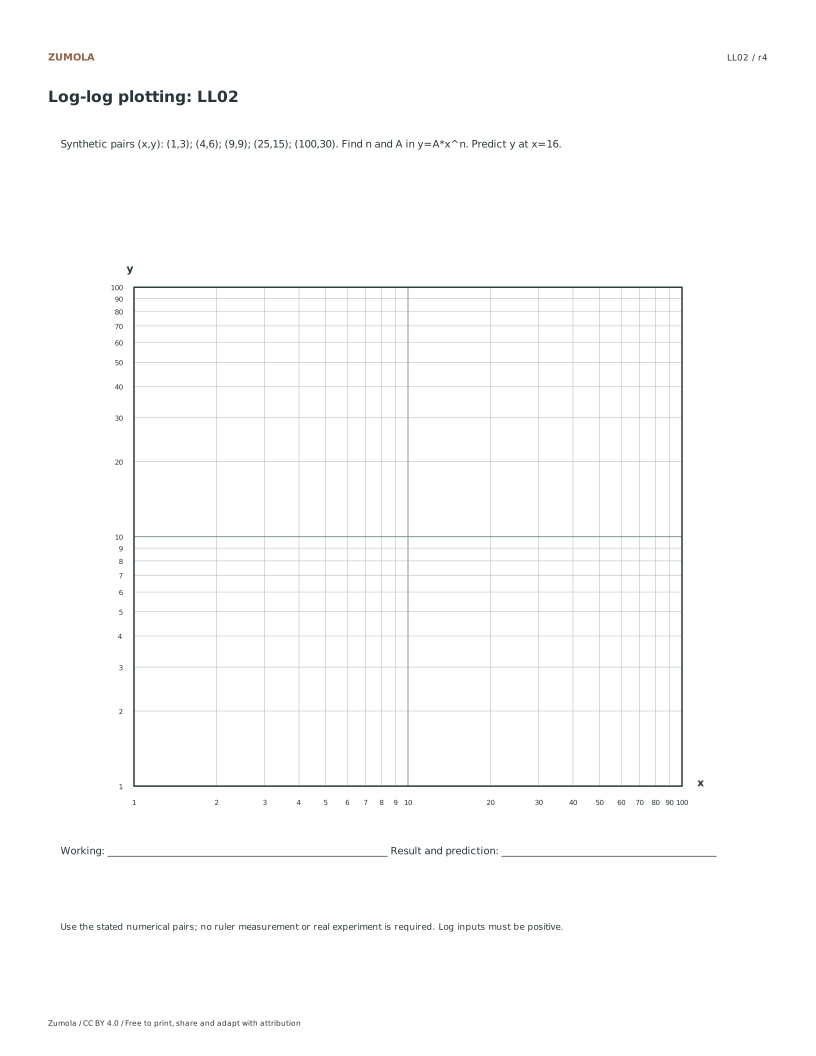
LL02
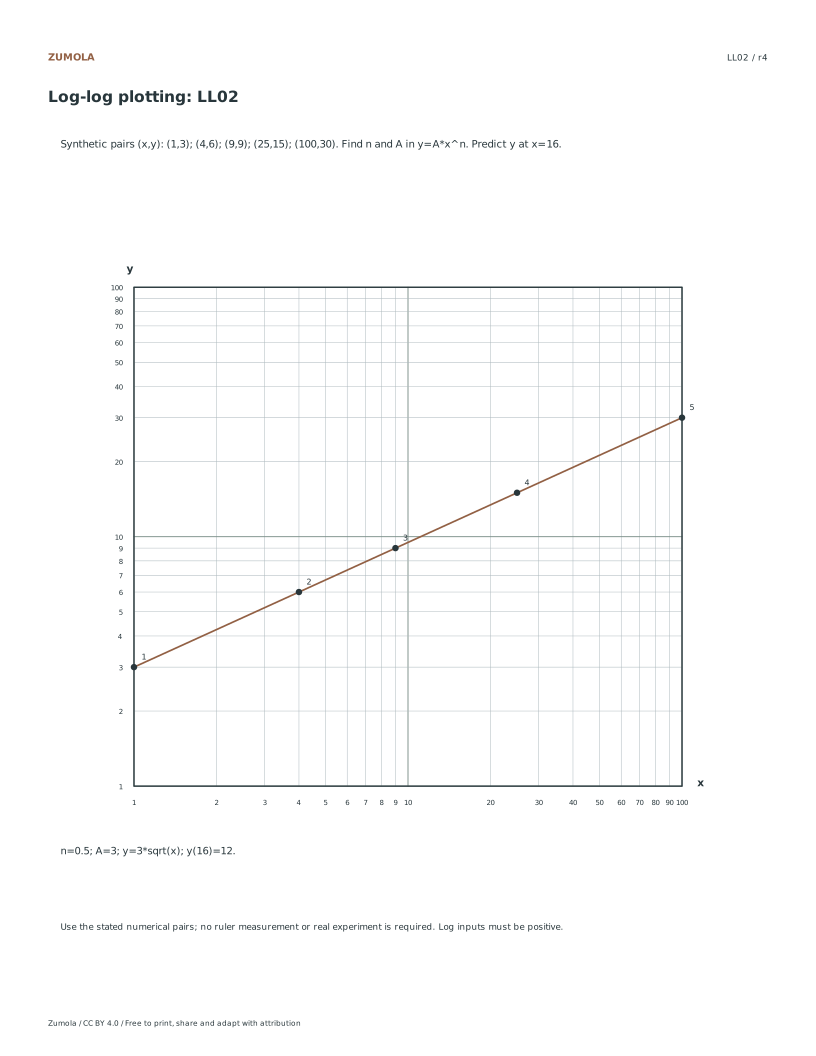
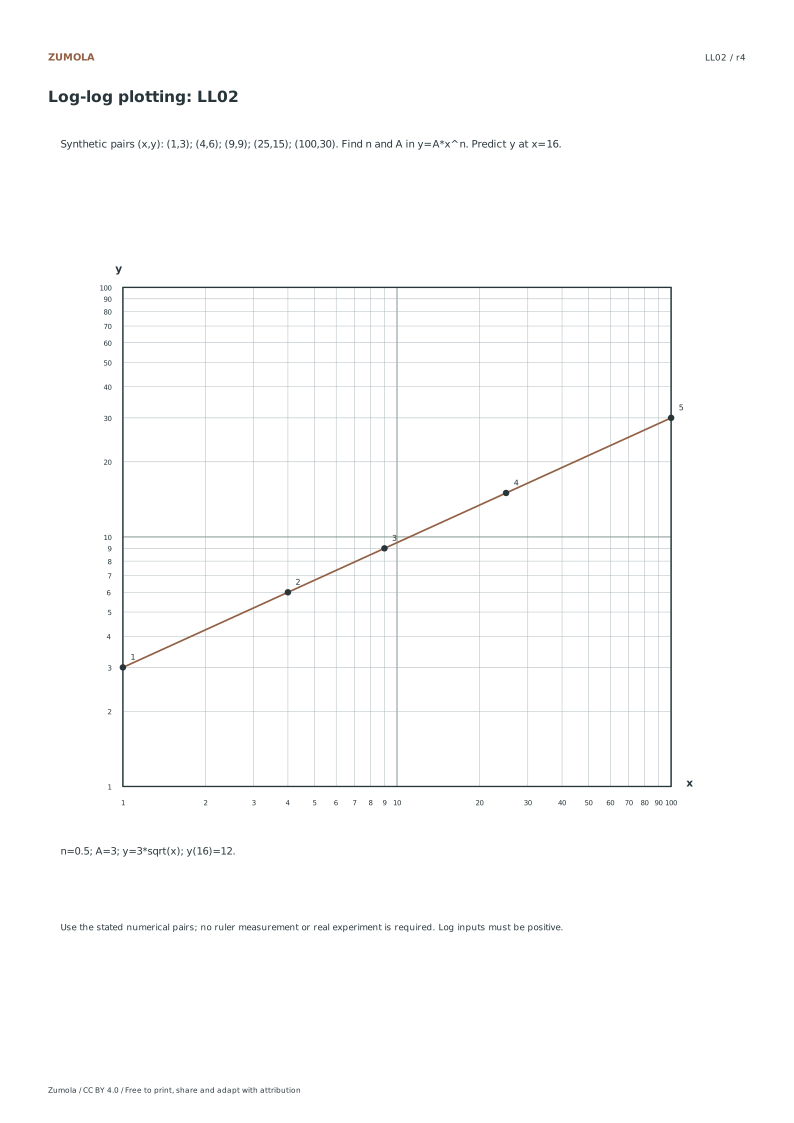
(1,3); (4,6); (9,9); (25,15); (100,30)
n=0.5; A=3; y=3*sqrt(x); y(16)=12.
A decade measures a ratio
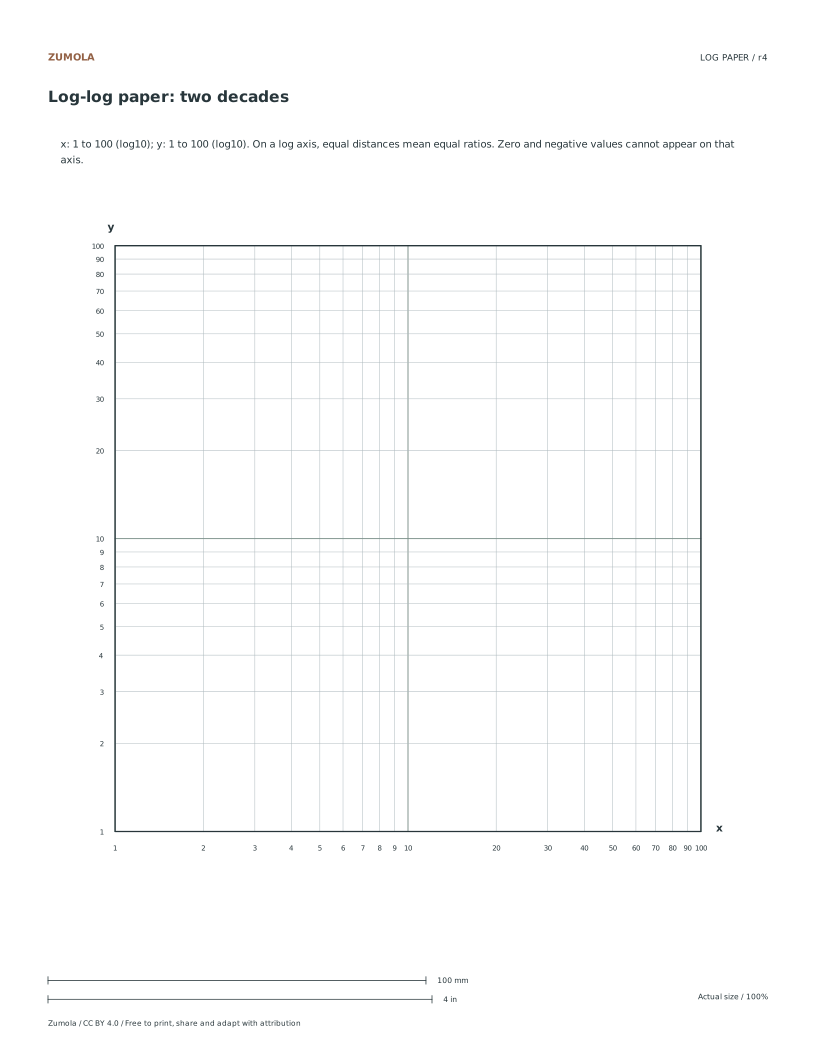
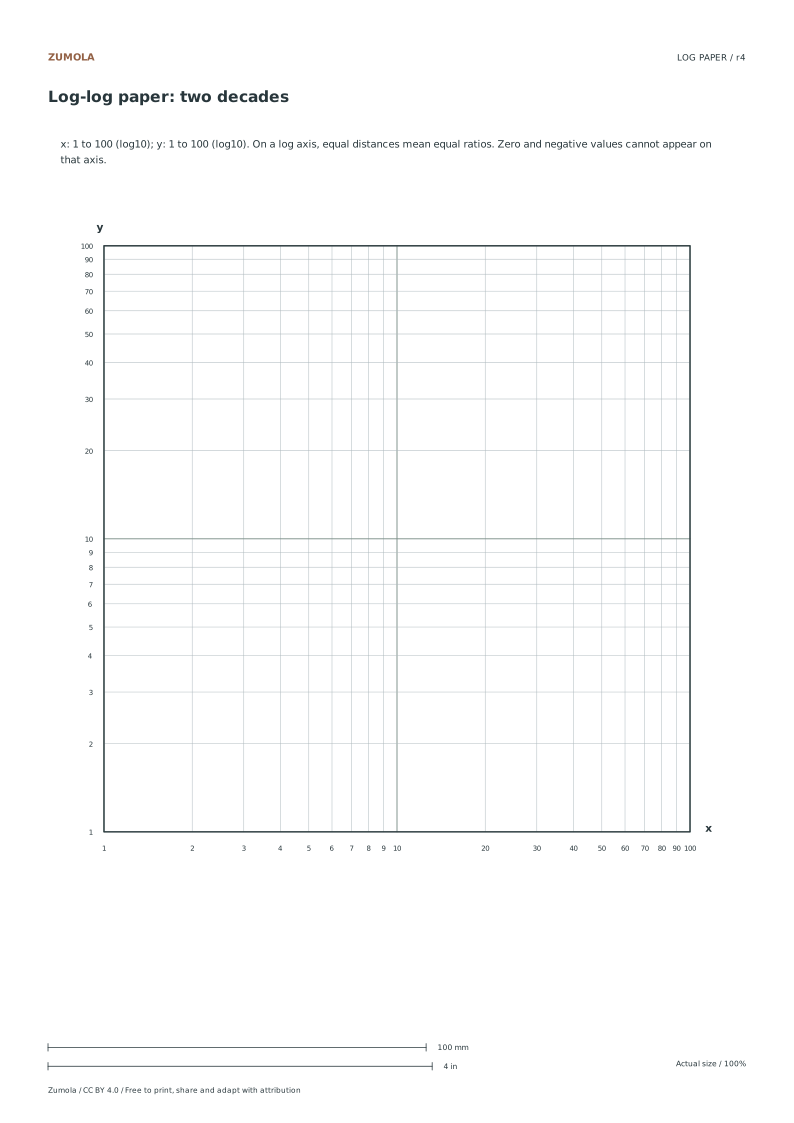
A value v on the 1–10 axis lies at fraction log10(v) of the decade width. Thus 2 is at about 30.103%, 5 at 69.897%, and √10 ≈ 3.162 at the physical midpoint. Repeating the same mantissas in the next decade places 20, 50 and 100 using the same pattern between 10 and 100.
For LL01, compare (2,4) and (10,100): n = log10(100/4) / log10(10/2) = log10(25)/log10(5) = 2. Since y = A x² and the point (1,1) is supplied, A = 1. At x = 3 the result is 9. For LL02, y = 3√x gives exponent 1/2 and coefficient 3; at x = 16 the result is 12.
These are exact synthetic exercises. A line through a few measured observations would not establish a universal power law by itself. If the paper covers different numbers of decades horizontally and vertically, its physical line angle also changes without changing the exponent.
Work through the page
Understanding Tick Placement
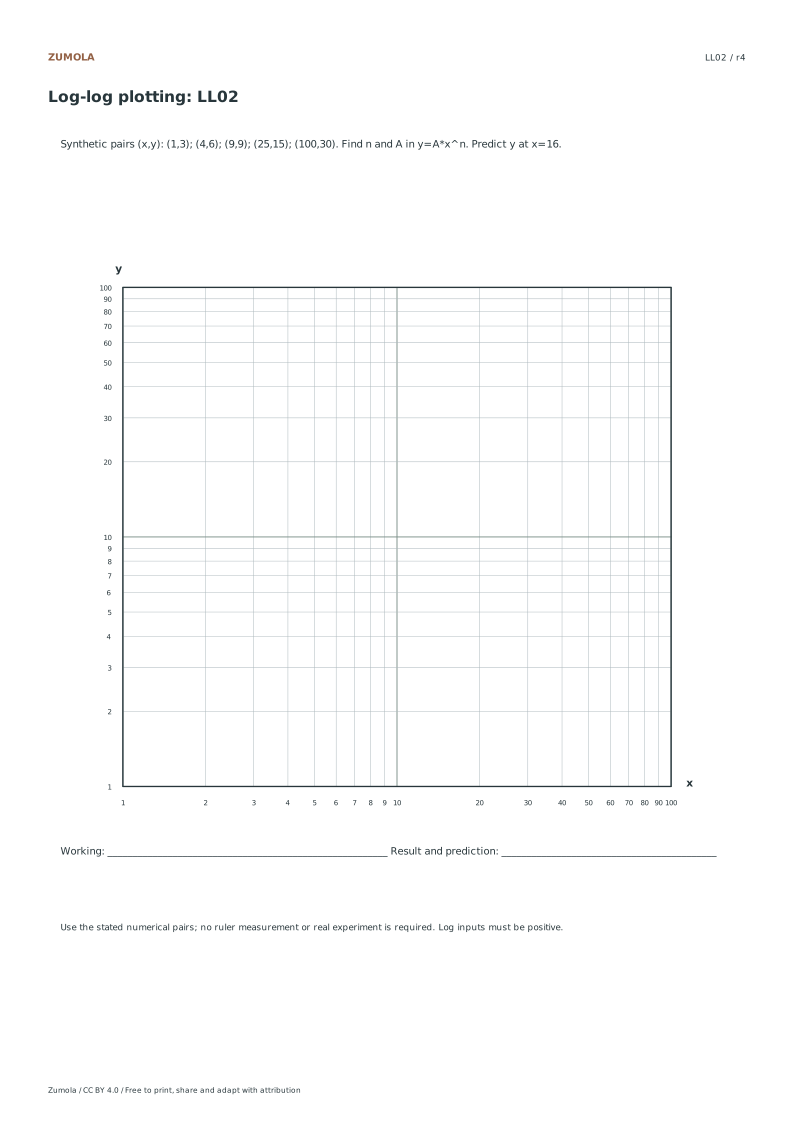
When plotting on these sheets, remember that minor ticks follow a logarithmic progression rather than a linear one. The position of any value v is calculated using the formula t equals the log of v minus the log of the minimum, divided by the log of the maximum minus the log of the minimum. This means the number five does not sit halfway between one and ten. You must locate ticks based on their logarithmic distance from the decade start. This spacing ensures that equal physical distances on the paper represent equal multiplicative factors, which is essential for correctly interpreting the data points you plot on the provided grid.
Interpreting Worksheet Data
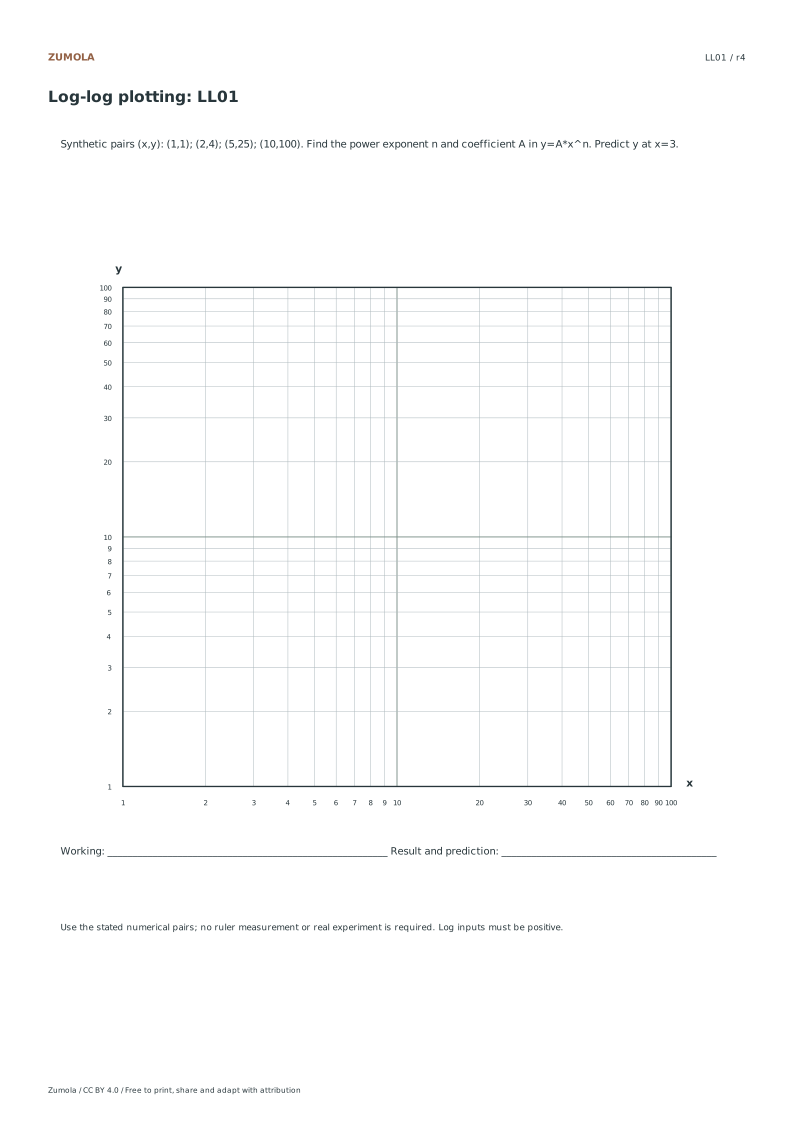
The two included worksheets provide synthetic exact data rather than empirical fitted laws. Worksheet LL01 plots x values of one, two, five, and ten against y values of one, four, twenty-five, and one hundred, representing the equation y equals x squared. Worksheet LL02 uses x values of one, four, nine, twenty-five, and one hundred against y values of three, six, nine, fifteen, and thirty, representing y equals three times the square root of x. Since these are exact synthetic points, both relationships become straight lines in log-log coordinates. Plot the stated pairs, then compare the transformed slope; the worksheets are not asking you to infer a law from noisy observations.
Calculating Slope Correctly
On log-log paper, the slope of your plotted line represents the exponent of the relationship, not the physical angle of the line on the paper. For the LL01 worksheet, the slope corresponds to an exponent of two, while for LL02, it corresponds to an exponent of zero point five. The coefficient is one for the first worksheet and three for the second. Do not measure the angle with a protractor to find the exponent. Instead, calculate the change in the log of y divided by the change in the log of x to determine the correct mathematical exponent.
Checks that catch common errors
Watch for
Check instead
Assuming the number five is located at the physical midpoint between one and ten on the axis.
Locate five using the logarithmic formula, as it sits closer to ten than to one due to the non-linear spacing of minor ticks within each decade.
Using linear interpolation to estimate values between logarithmic ticks on the grid.
Remember that interpolation within logarithmic decades is not linear. Use the logarithmic position formula to find intermediate values accurately rather than estimating by eye.
Measuring the physical angle of the plotted line to determine the exponent.
Calculate the exponent by dividing the change in log y by the change in log x. The physical angle varies with axis scaling and does not equal the exponent.
Print a test sheet before the full pack
Choose the file matching the paper in your printer. Print the PDF at Actual size / 100%, turning off Fit, Shrink and browser headers. An SVG editor or browser can change its scale even though the file uses millimeter dimensions. Use the supplied calibration bars where present when a task depends on physical size; a screen preview alone does not establish printed size.
The packs contain the same individual pages in collection order. They are a convenient download, not extra different exercises. On coordinate plots, uniform scaling preserves the numerical positions relative to the axes. On image-copy tasks, keep the specified proportions and any stated source-to-target enlargement. Color is optional: labels, line positions and relative lightness also explain the references.
Useful answers
Can I plot values between zero and one on these sheets?
Positive values below 1 are valid logarithmic inputs, but they are outside these supplied ranges. The one-decade blank spans 1–10 on both axes; the two-decade blank and both activity charts span 1–100. Choose a different range rather than changing the data.
Are the worksheets based on real-world experimental data?
No, the worksheets contain synthetic exact data generated from known equations. They are not empirical fitted laws, so your plots should match the given coordinates exactly.
Do the sheets include zero or negative numbers?
No zero or negative value can be placed on either ordinary log-log axis. The supplied blanks begin at 1. A tick labeled 1 is an original data value, not a transformed coordinate of 1; log10(1) = 0 determines its position at the decade start.
Are the answers and editable files free too?
Yes. Every linked worksheet, PDF, SVG and answer is free without signup. Original Zumola resources use CC BY 4.0: credit Zumola, link the license and indicate changes. Analytics consent is not required to download or use them.
Optional Google Analytics helps us understand which free resources are useful. It is off until you allow it. Drawing tools and downloads work with either choice. Privacy details