Free original resources
Graphing Logarithmic Functions: Domain, Asymptote and Key Points
Use base and shifts to find a logarithmic graph's domain, vertical asymptote, intercepts and key points, then check each plotted point by substitution.
Free resources
Letter & A4
PDF & SVG
Letter & A4
PDF & SVG
Make it yours.
Free · no signup · calculated in your browser
Your free printable kit.
Original reference, student practice and separate worked answers. No account or payment.
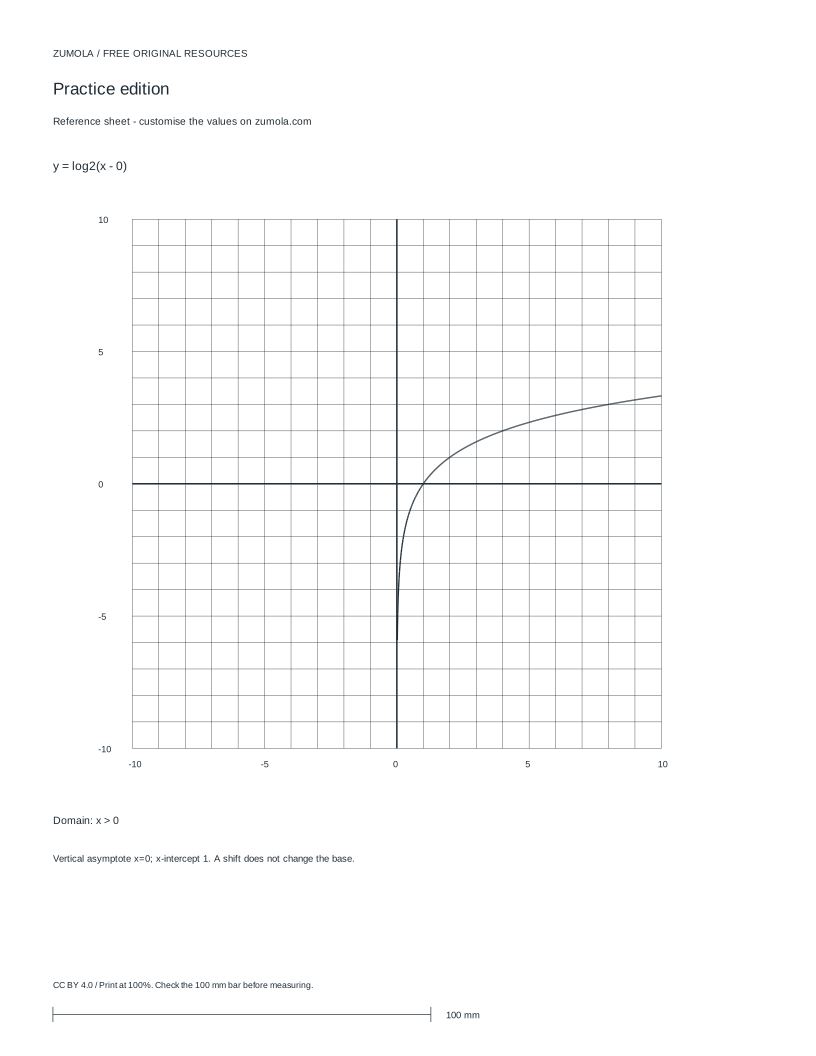
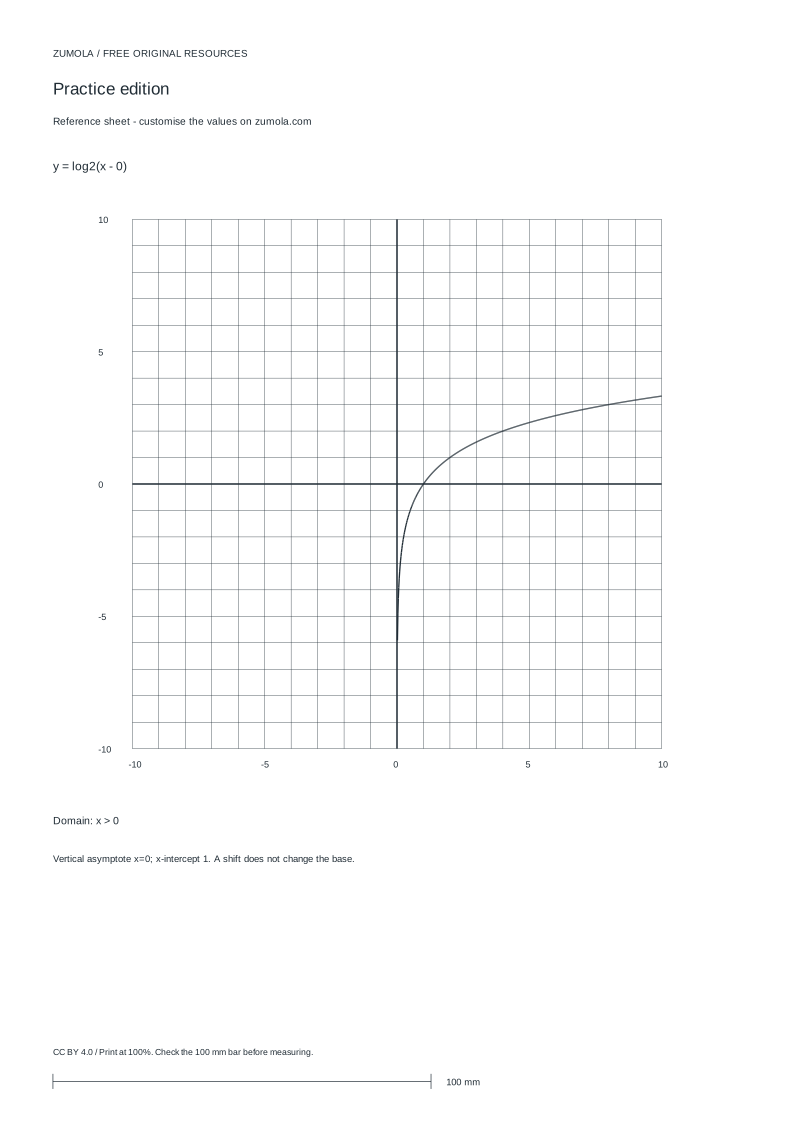
Practice worksheet
Worked answers / rubric
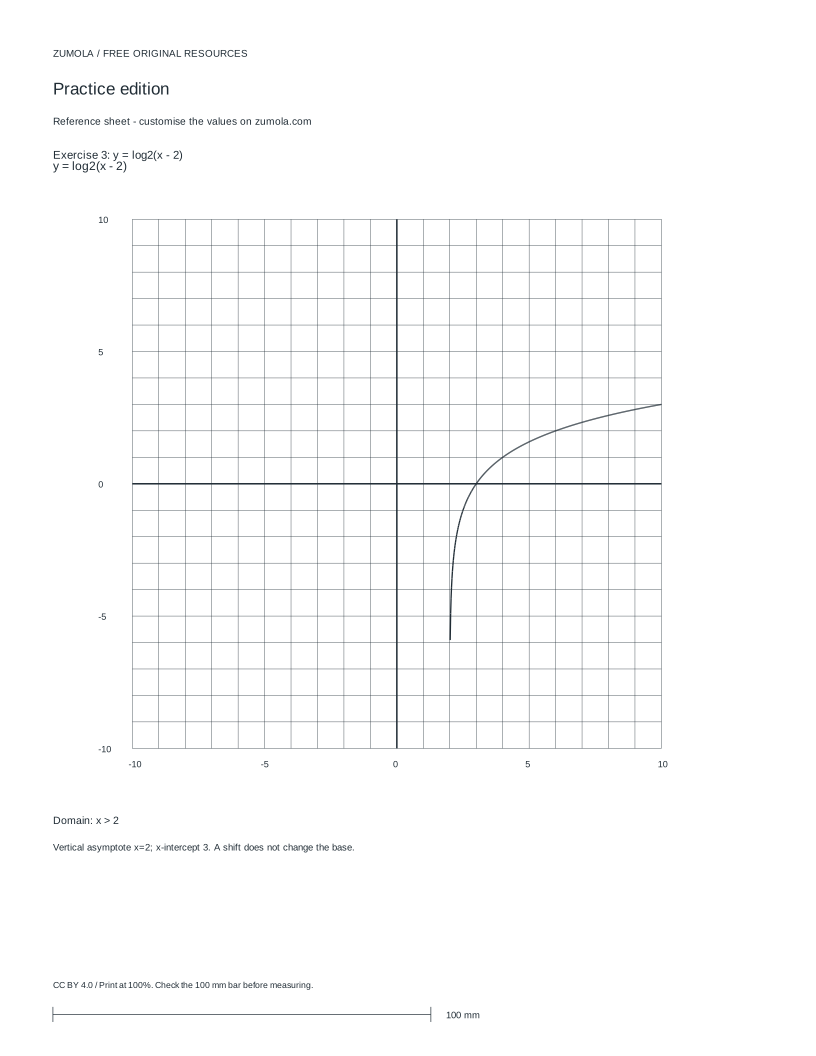
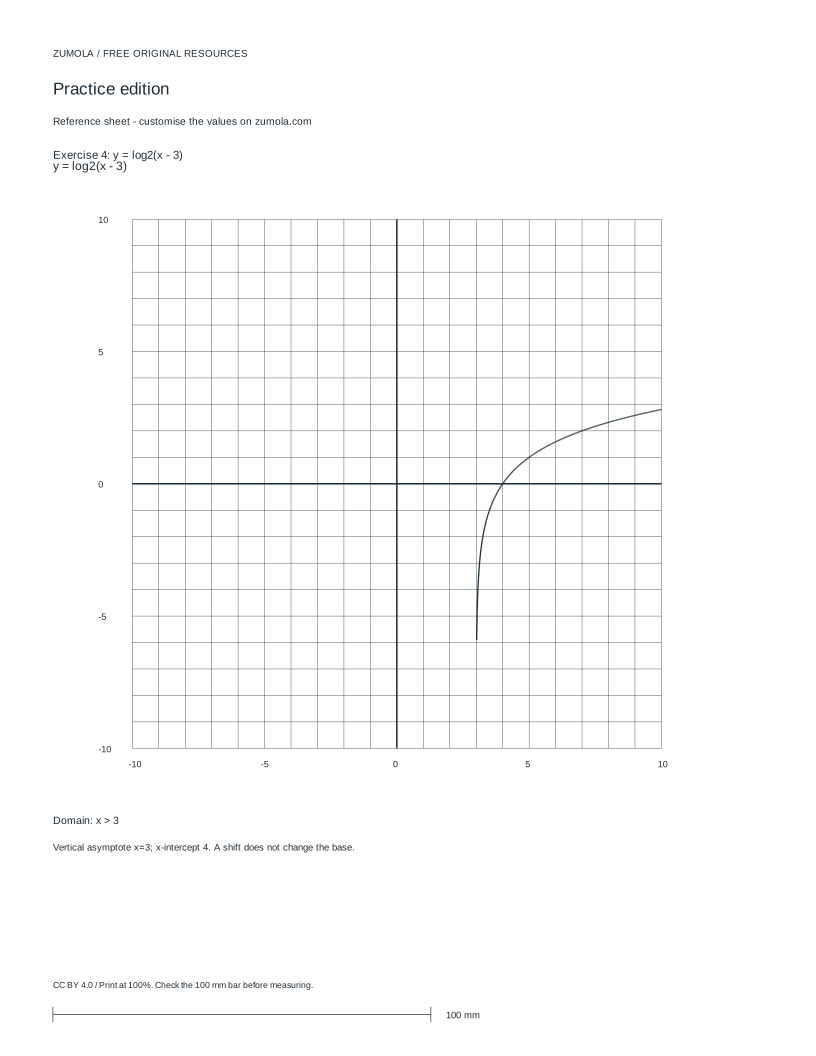
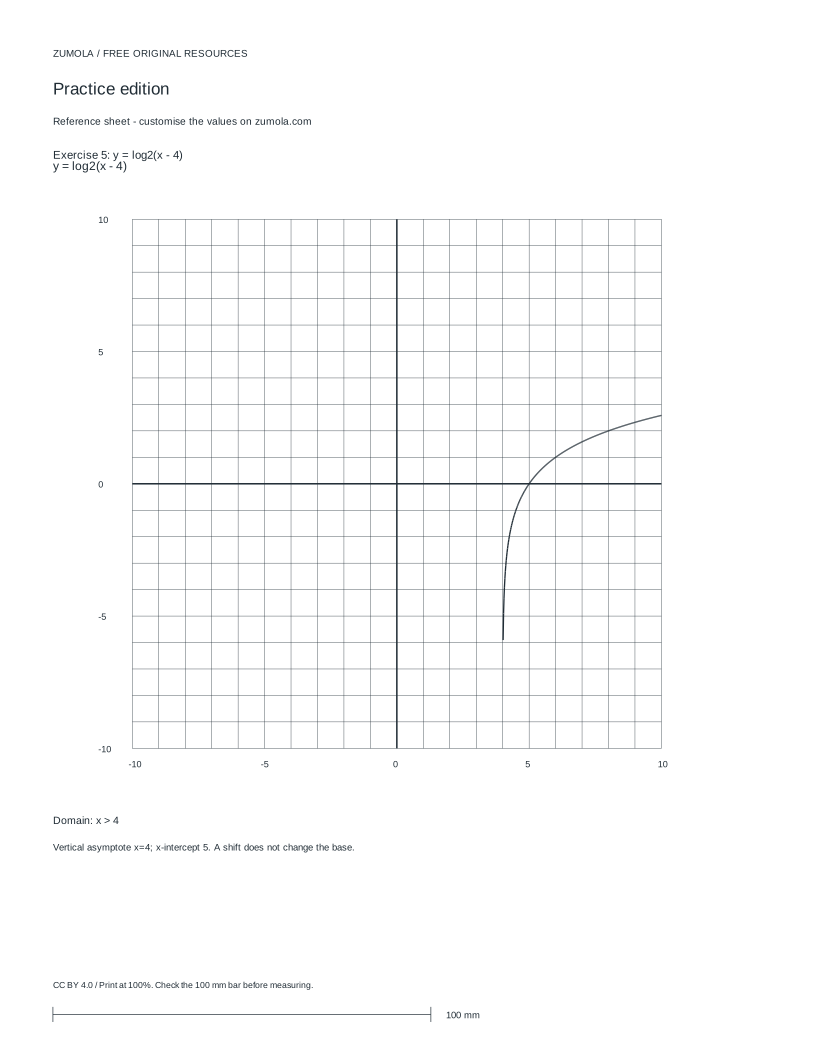
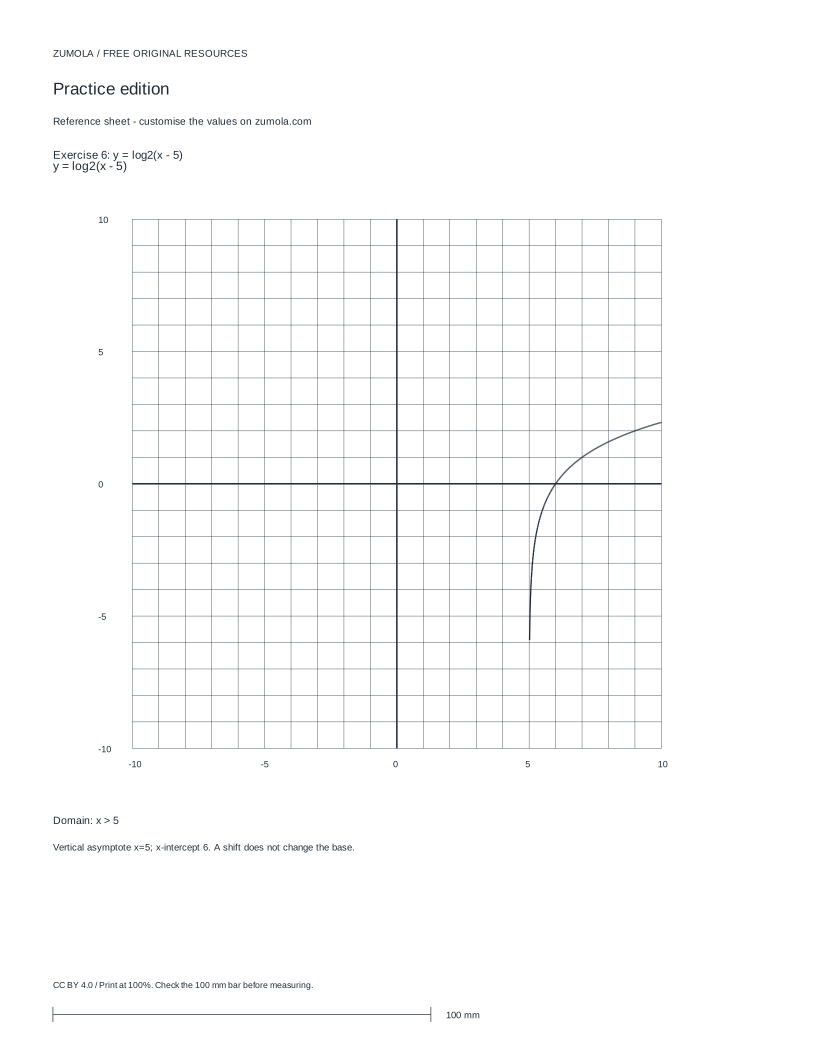
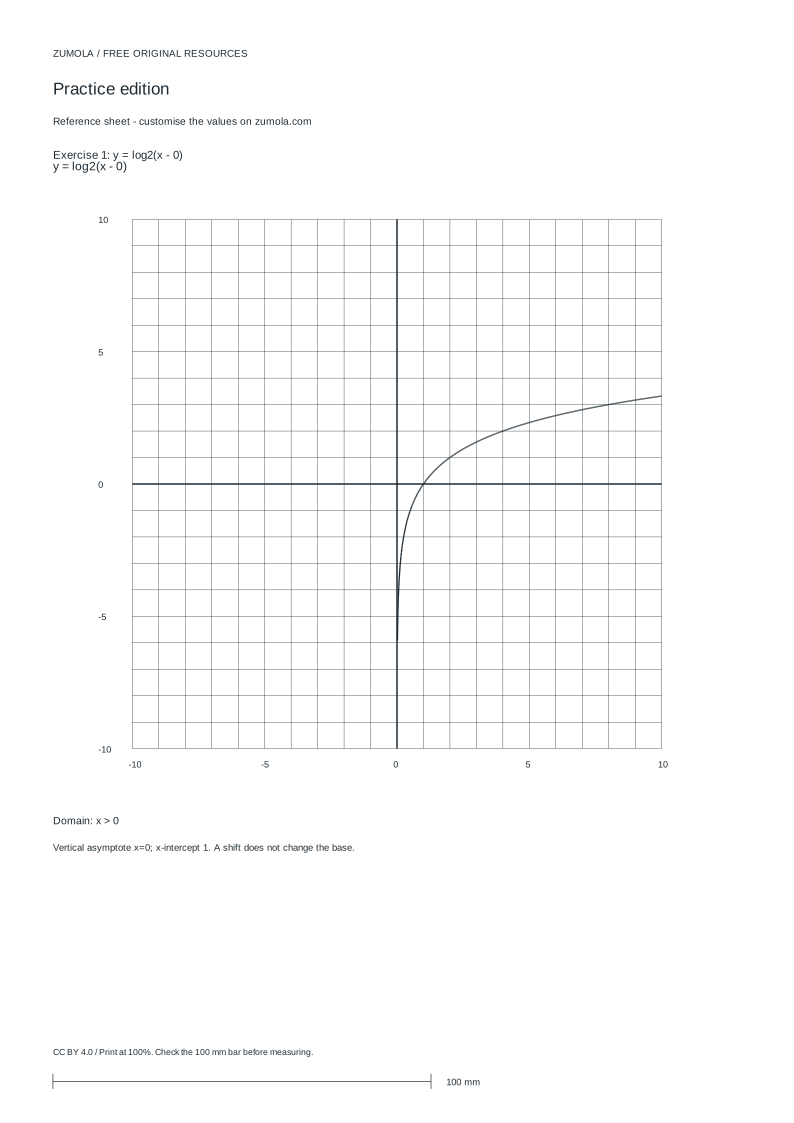
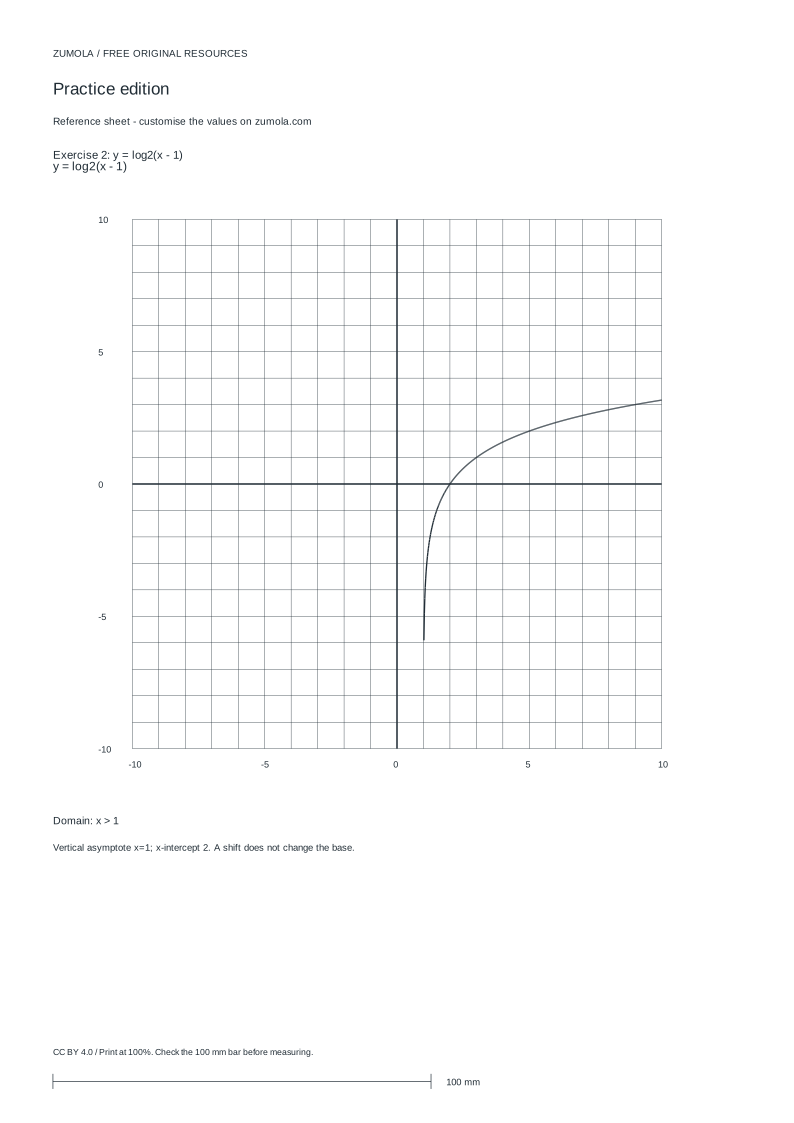
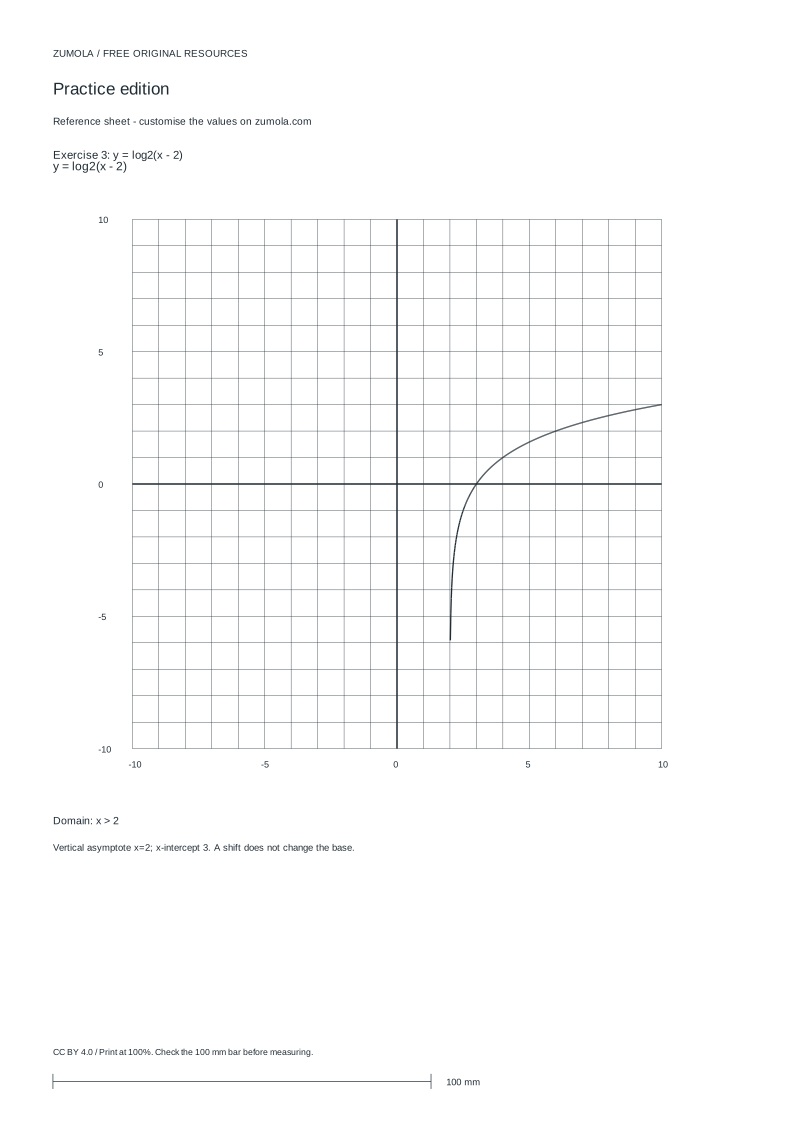
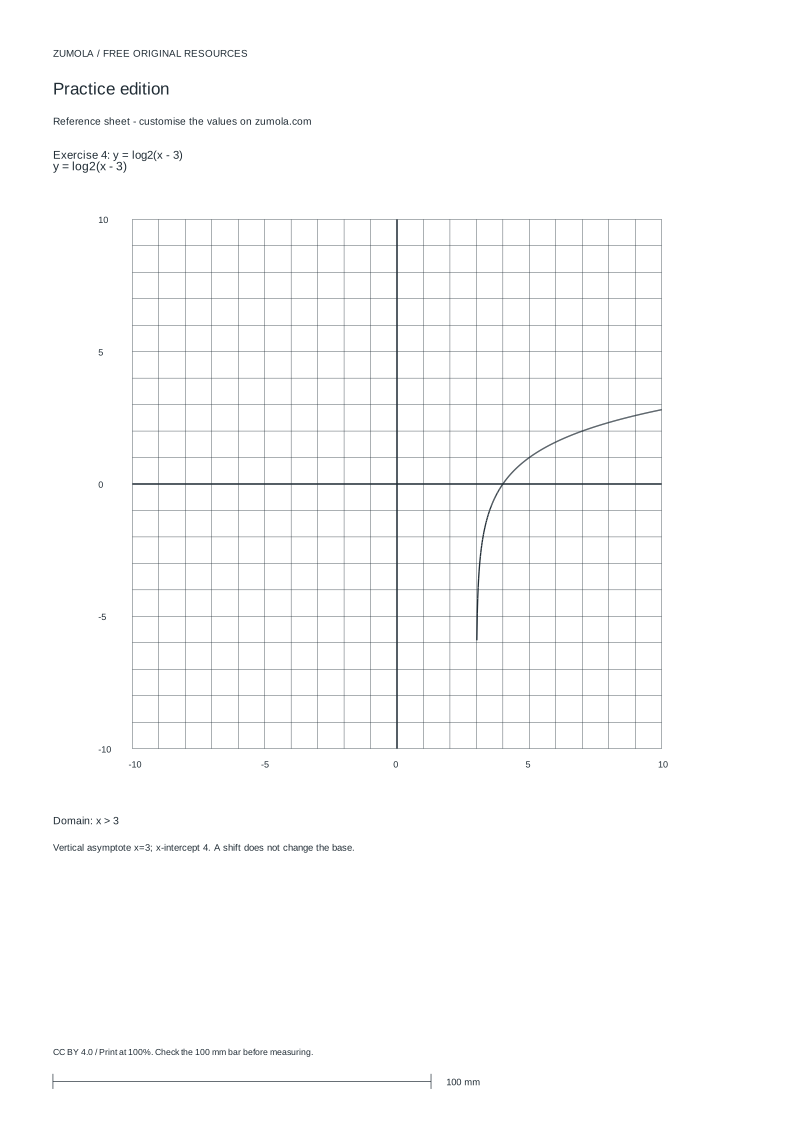
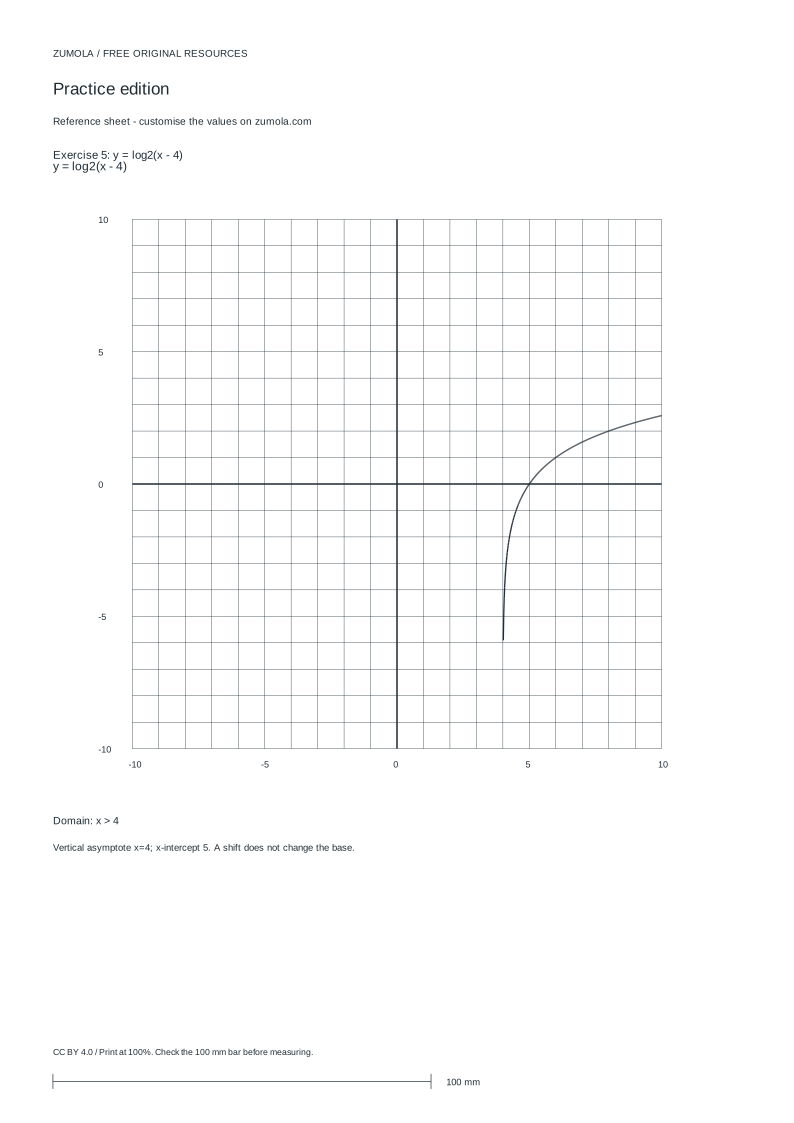
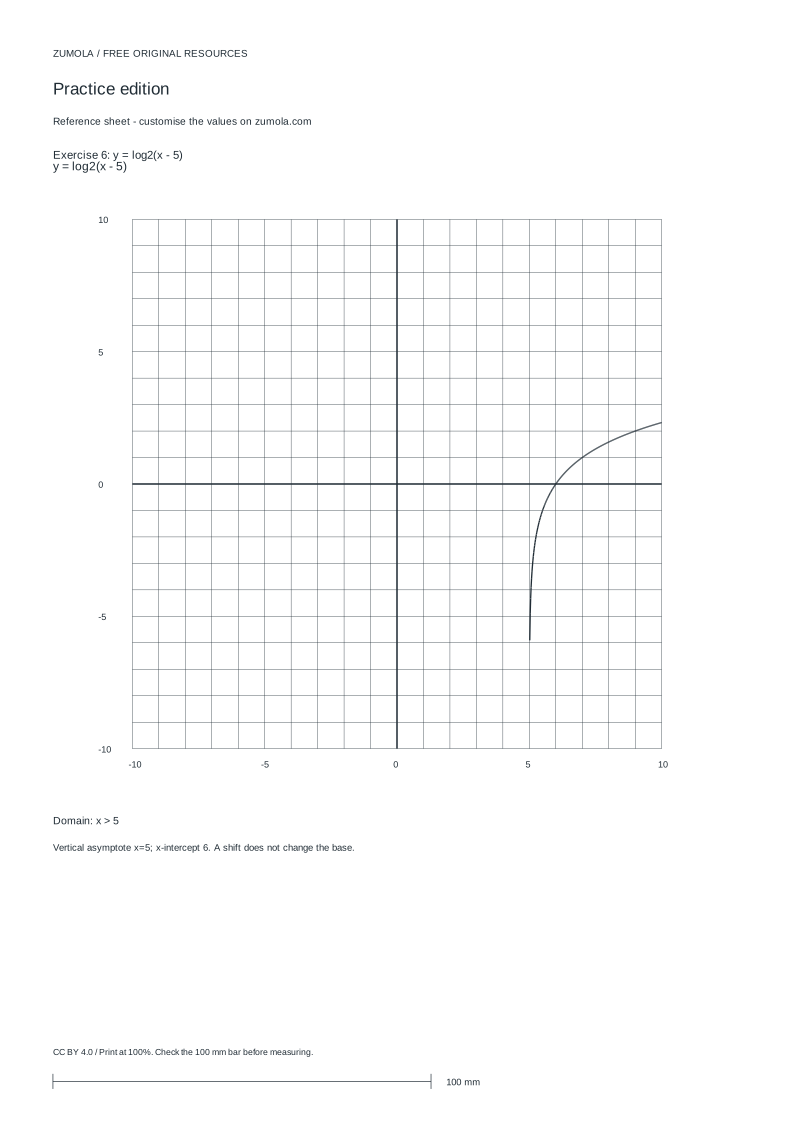
Print at Actual size / 100%. Check the calibration bar before using physical dimensions.
A logarithmic graph is easiest to draw when you work from structure rather than guessing points. The base sets the curve's steepness and direction; a horizontal shift moves the vertical asymptote and the domain; a vertical shift moves every y-value without changing the asymptote. This page shows how to read those features from an equation, place reliable key points, and verify the result. It is about the reasoning behind the graph, not about filling blank coordinate paper.
Read the equation before plotting
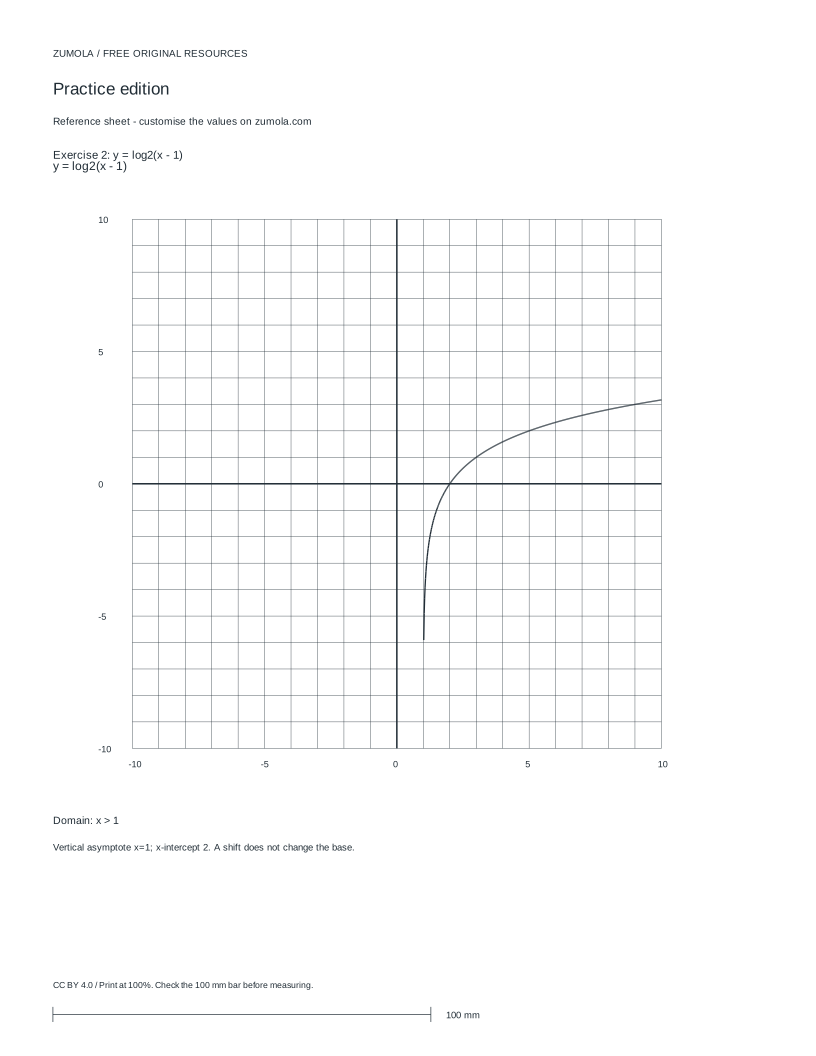
Write the function in the form y = log_b(x - h) + k, where b is positive and not equal to 1. The argument is x - h, so the domain requires x - h > 0, giving x > h. The vertical asymptote is the boundary line x = h, which the graph approaches but never touches. The base b is unchanged by either shift; shifting a graph does not turn base 2 into base 3.
The y-intercept, if it exists, comes from substituting x = 0, but only when 0 > h. The x-intercept comes from setting y = 0 and solving log_b(x - h) = -k, which gives x = h + b^(-k). State whether endpoints are open or closed: the domain boundary is open because the logarithm is undefined at zero argument, while an intercept is a point on the graph.
- Rewrite the equation as y = log_b(x - h) + k and identify b, h and k.
- Set x - h > 0 to state the domain and the vertical asymptote x = h.
- Choose argument values that are powers of the base, such as 1, b, b squared, then solve for x.
- Add k to each logarithm value to get the plotted y-coordinate.
- Check the y-intercept only if x = 0 lies inside the domain, and solve for any x-intercept.
Place key points by substitution
Powers of the base give clean coordinates. For y = log_2(x - 3) + 1, the argument x - 3 equals 1 when x = 4, so y = 0 + 1 = 1. The argument equals 2 when x = 5, so y = 1 + 1 = 2. The argument equals 4 when x = 7, so y = 2 + 1 = 3. These three points already show the curve rising slowly to the right of the asymptote x = 3.
For a base between 0 and 1, the curve falls as x increases, but the same substitution method applies. Keep the argument positive at every chosen point; a point with a non-positive argument is not on the graph and should not be plotted.
- Pick argument values 1, b and b squared, which give logarithm values 0, 1 and 2.
- Solve x - h = each chosen argument to obtain the x-coordinate.
- Add k to 0, 1 and 2 to obtain the matching y-coordinates.
- Plot the points and draw a smooth curve approaching the asymptote without crossing it.
Check the finished graph
A finished graph should agree with the equation at every marked feature. Substitute each plotted point back into the original equation; the two sides must match. Confirm that no plotted x-value is at or below the asymptote, that the domain statement matches the asymptote, and that the curve's direction matches whether the base is greater than 1 or between 0 and 1.
Blank coordinate paper is a drawing surface, not an answer. A correct response includes the equation, the domain, the asymptote, the intercepts where they exist, and labelled key points, so a reader can tell which function was graphed and why.
- Substitute one key point into the equation to confirm it satisfies both sides.
- Compare the stated domain with the asymptote and with every plotted x-value.
- Check intercepts against the domain before accepting them.
- Label the asymptote and at least three key points on the graph.
A short worked example
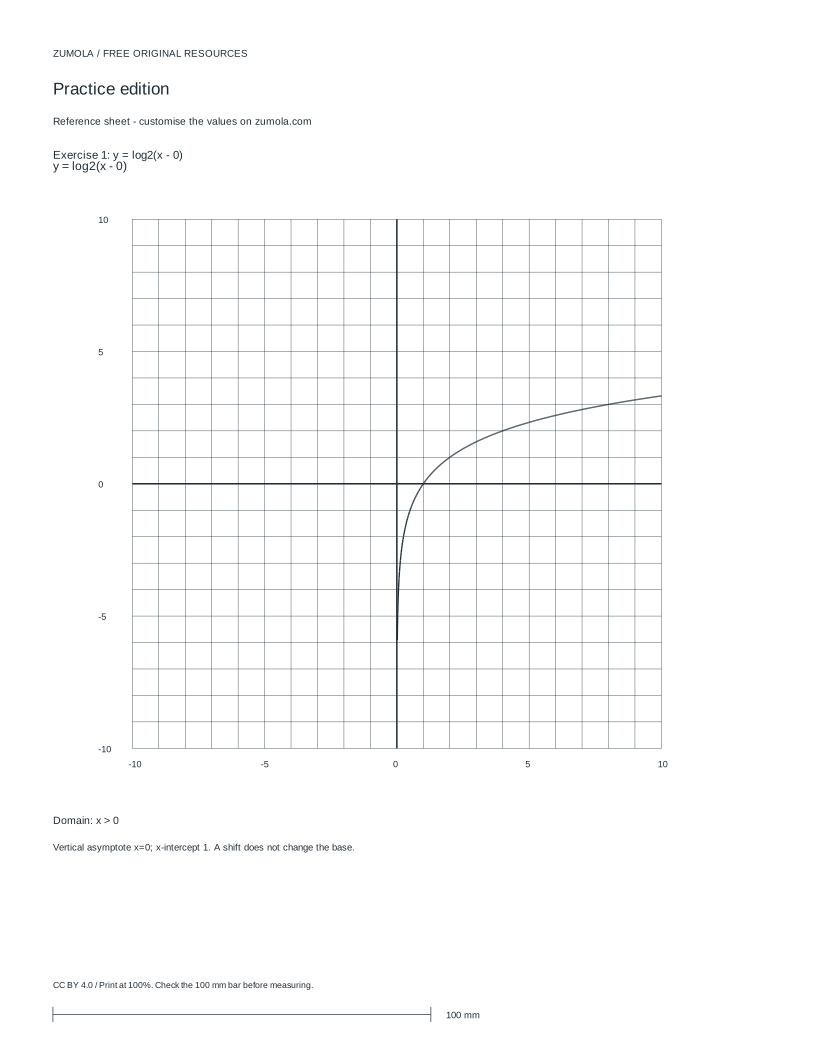
Consider y = log_2(x - 0), the base case with no shift. The domain is x > 0 and the vertical asymptote is x = 0. The argument equals 1 at x = 1, so the x-intercept is 1. The argument equals 2 at x = 2, giving y = 1; the argument equals 4 at x = 4, giving y = 2. The curve rises through (1, 0), (2, 1) and (4, 2) and approaches x = 0 from the right.
Now compare y = log_2(x - 3) + 1. The domain becomes x > 3 and the asymptote becomes x = 3. The same argument values shift the points to (4, 1), (5, 2) and (7, 3). The base is still 2, and the shape is the same; only its position has changed.
- State the domain and asymptote from the argument.
- Compute three key points using powers of the base.
- Plot and connect them with a smooth curve that respects the asymptote.
Try this example
For y = log_2(x - 3) + 1, state the domain, vertical asymptote, x-intercept and three key points.
Show the worked explanation
Domain: x > 3. Vertical asymptote: x = 3. For the x-intercept, set y = 0: log_2(x - 3) = -1, so x - 3 = 2^(-1) = 0.5 and x = 3.5. Key points: argument 1 gives x = 4 and y = 1; argument 2 gives x = 5 and y = 2; argument 4 gives x = 7 and y = 3. The curve rises through (4, 1), (5, 2) and (7, 3), approaching x = 3 from the right.
Common mistakes
- Treating the vertical asymptote as part of the domain or plotting a point on it. Write the domain as an open inequality such as x > 3 and mark the asymptote as a dashed boundary the curve never reaches.
- Changing the base when the graph is shifted horizontally or vertically. Identify b from the coefficient position in log_b and keep it fixed; only h and k move the graph.
- Assuming a y-intercept always exists. Substitute x = 0 and check it satisfies x > h; if not, state that there is no y-intercept.
Check your work
- Domain is stated as an open inequality matching the argument.
- Vertical asymptote is identified and drawn as a boundary the curve does not cross.
- At least three key points are computed by substitution and labelled.
- Intercepts are included only when they lie inside the domain.
- The curve's direction matches whether the base is greater than 1 or between 0 and 1.
- The base is unchanged by any shift.
Questions before you start
How do I find the domain of y = log_2(x - 3) + 1?
The argument must be positive, so x - 3 > 0, giving x > 3. The vertical asymptote is x = 3.
Does a horizontal shift change the base?
No. The base is fixed by the logarithm itself. A shift changes the domain, asymptote and point positions, not the base.
How can I check a plotted point?
Substitute its x and y values into the original equation. Both sides must be equal, and the x-value must lie inside the stated domain.