Free graphing resources · Original practice
Line plot graph worksheets.
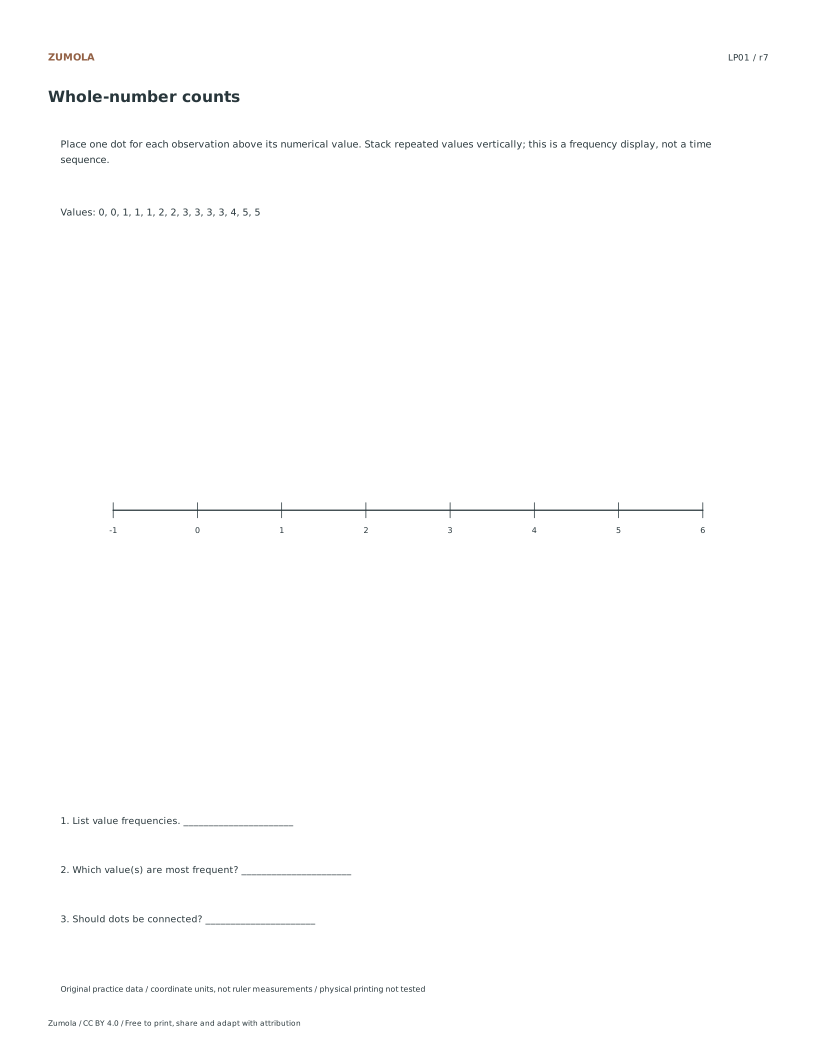
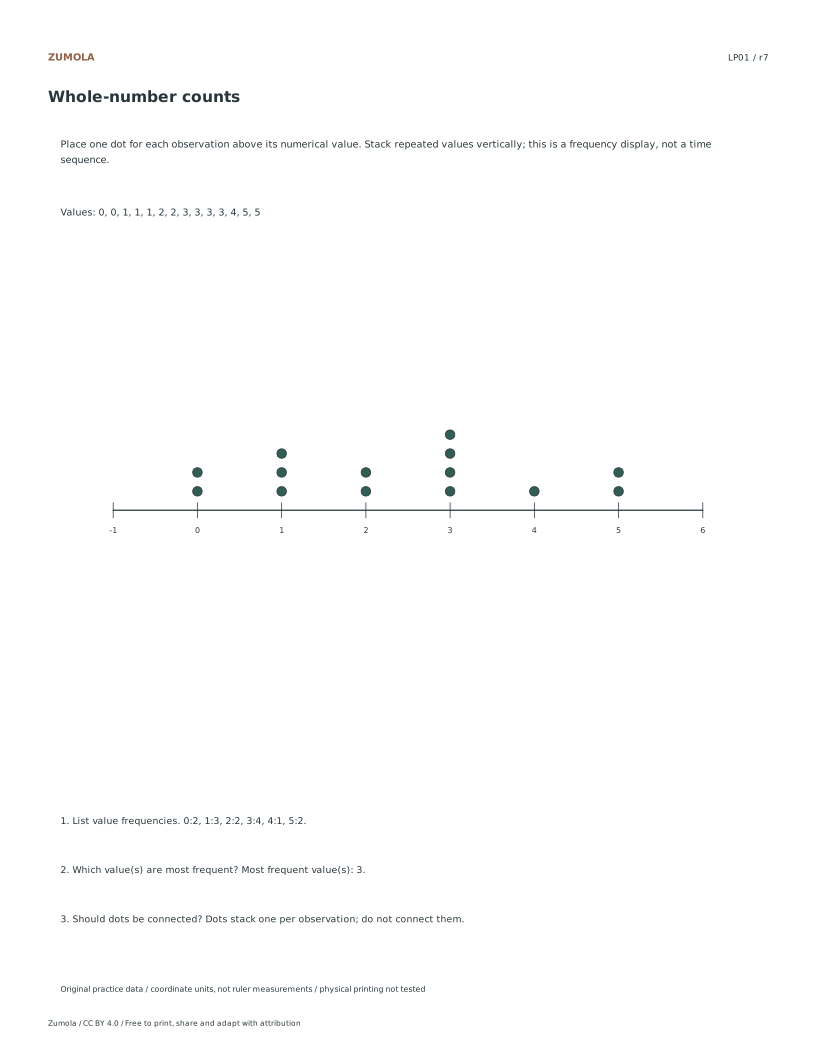
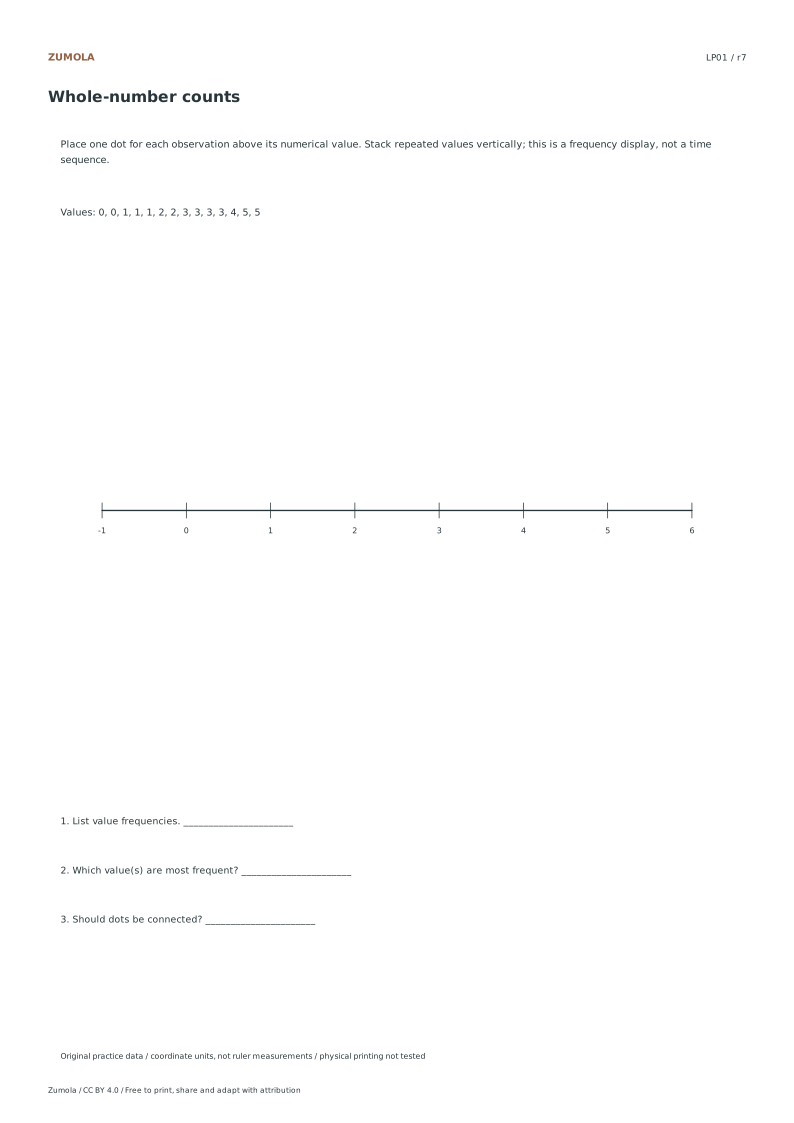
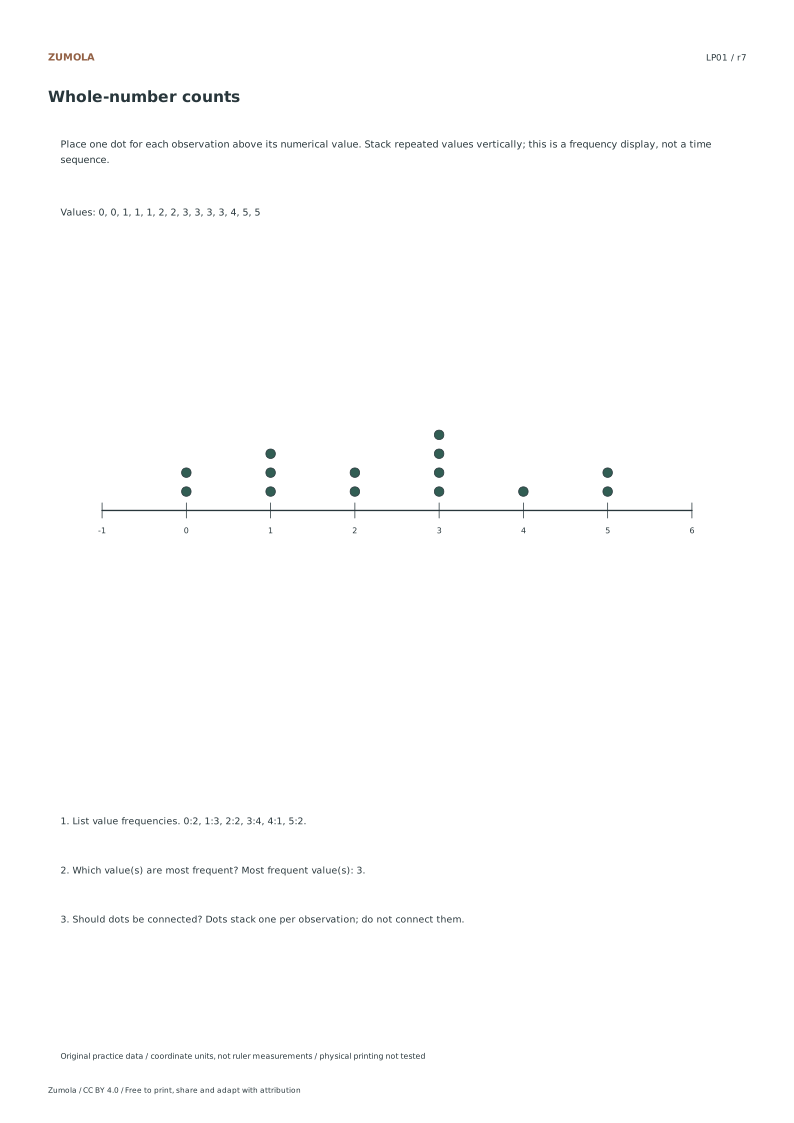
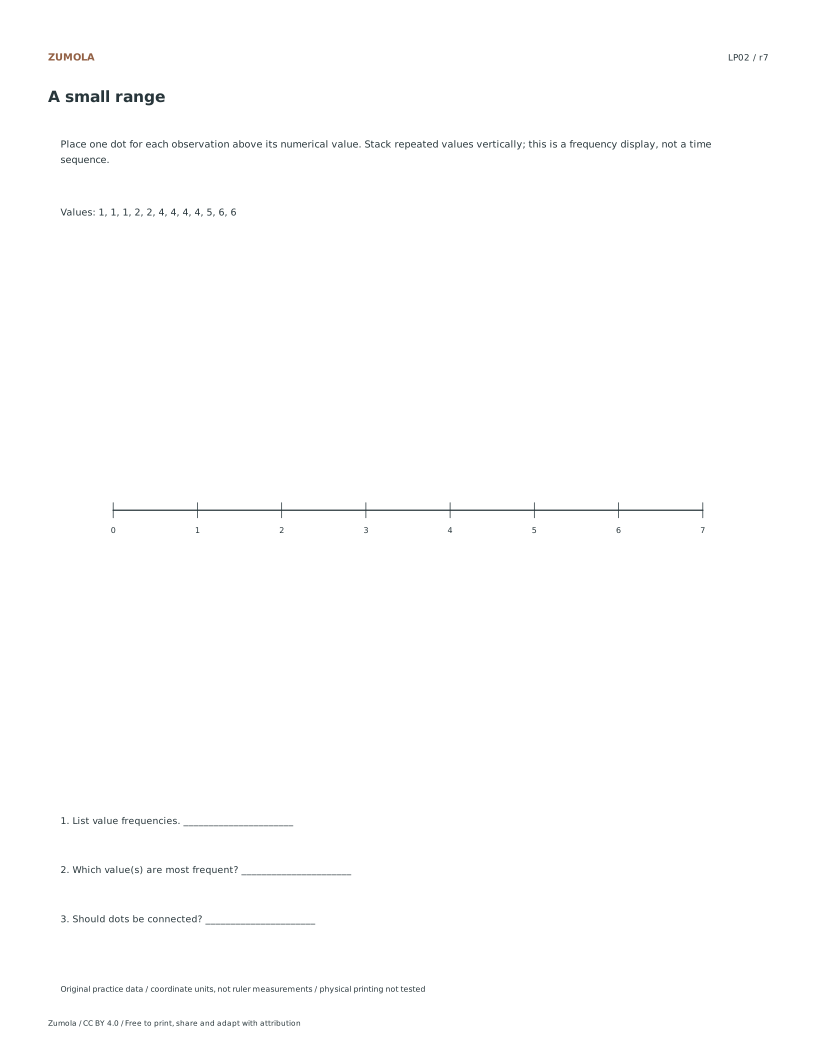
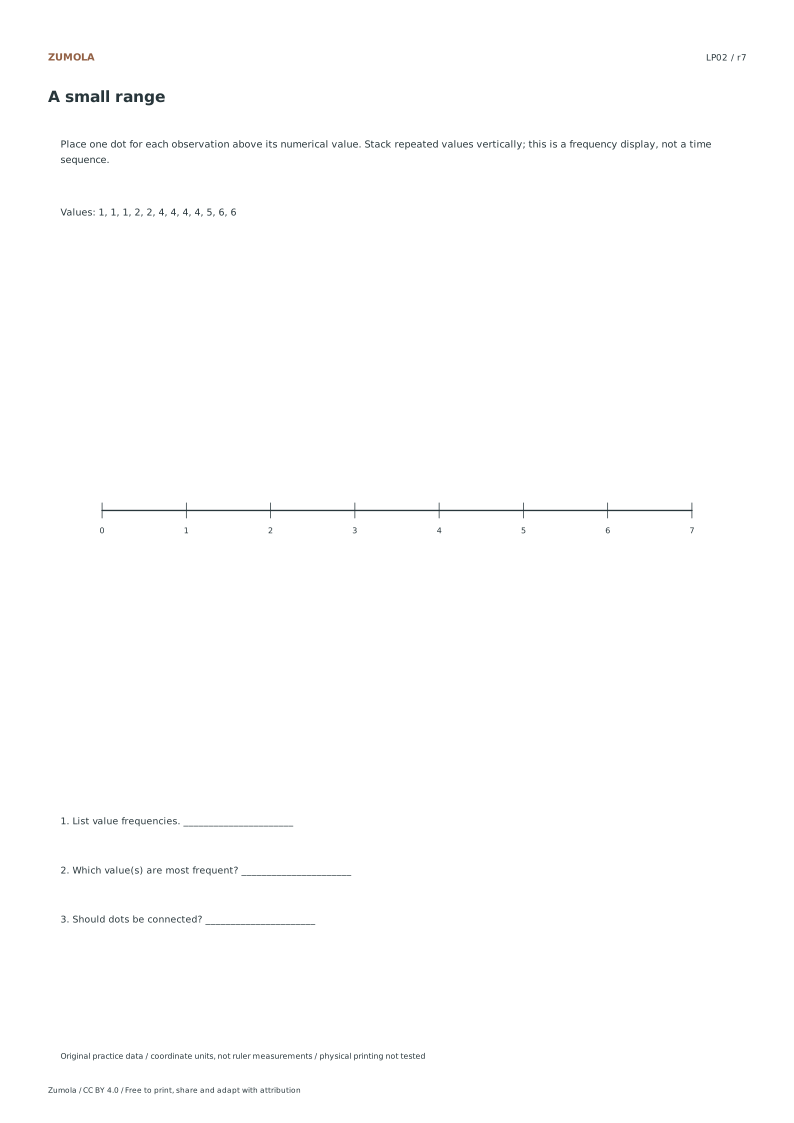
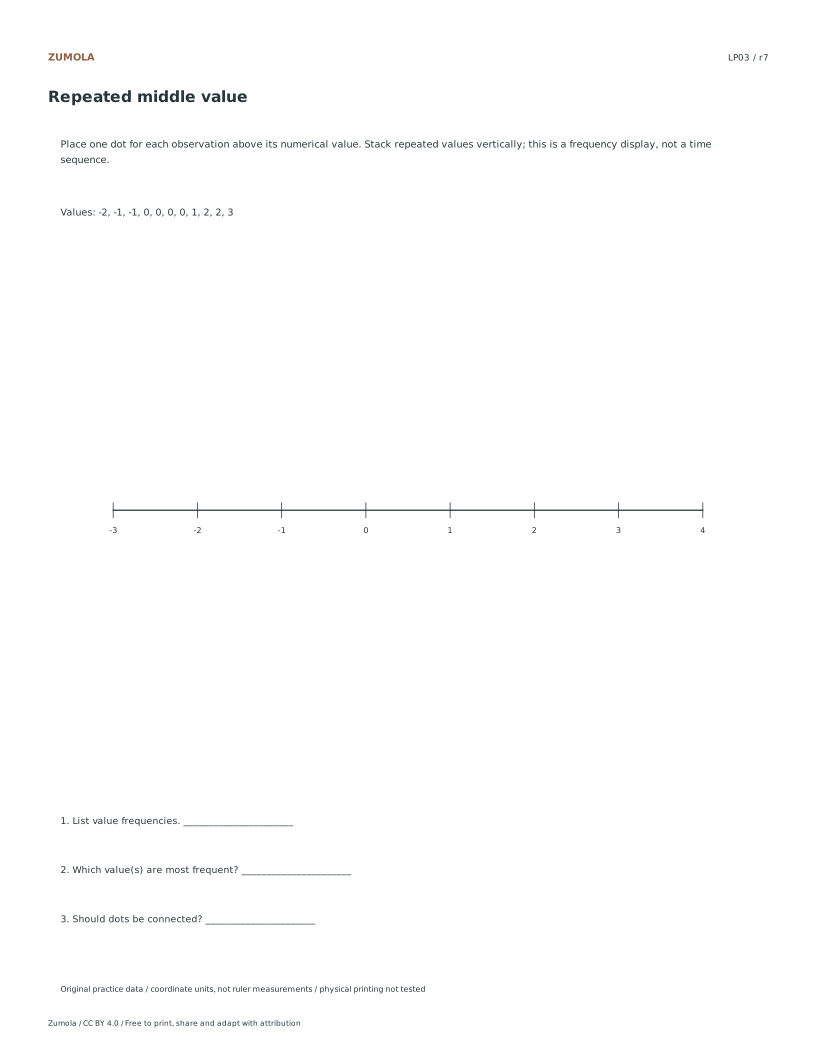
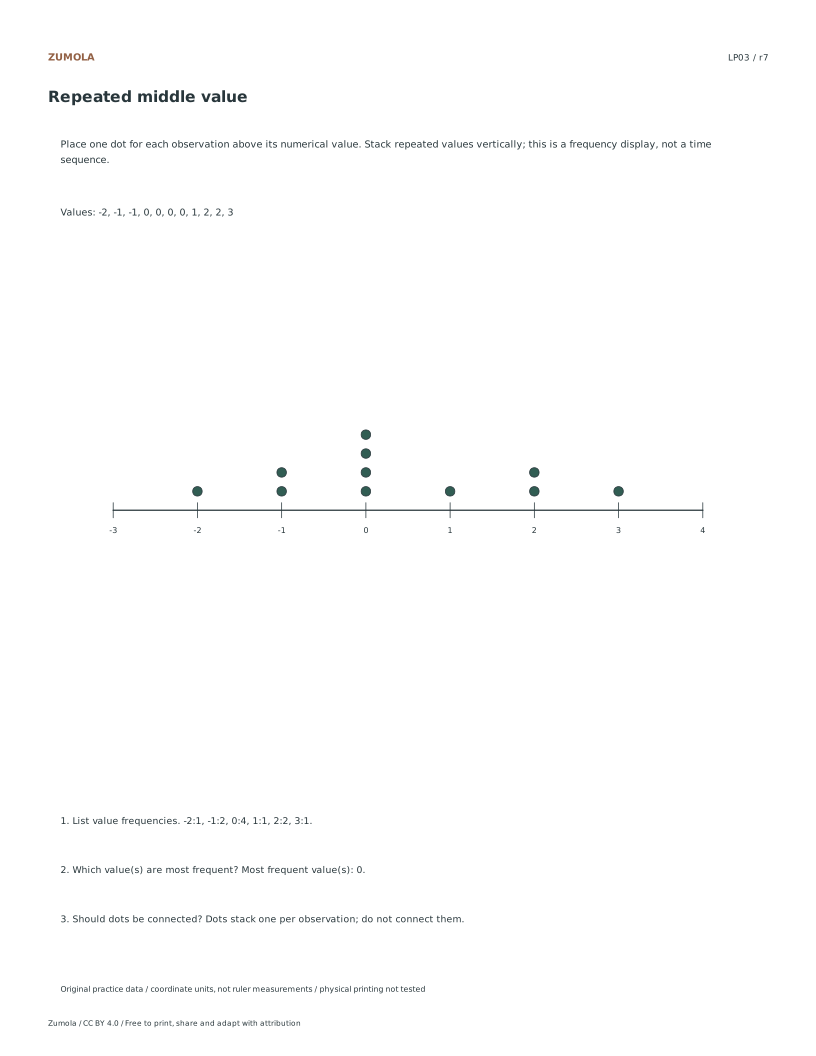
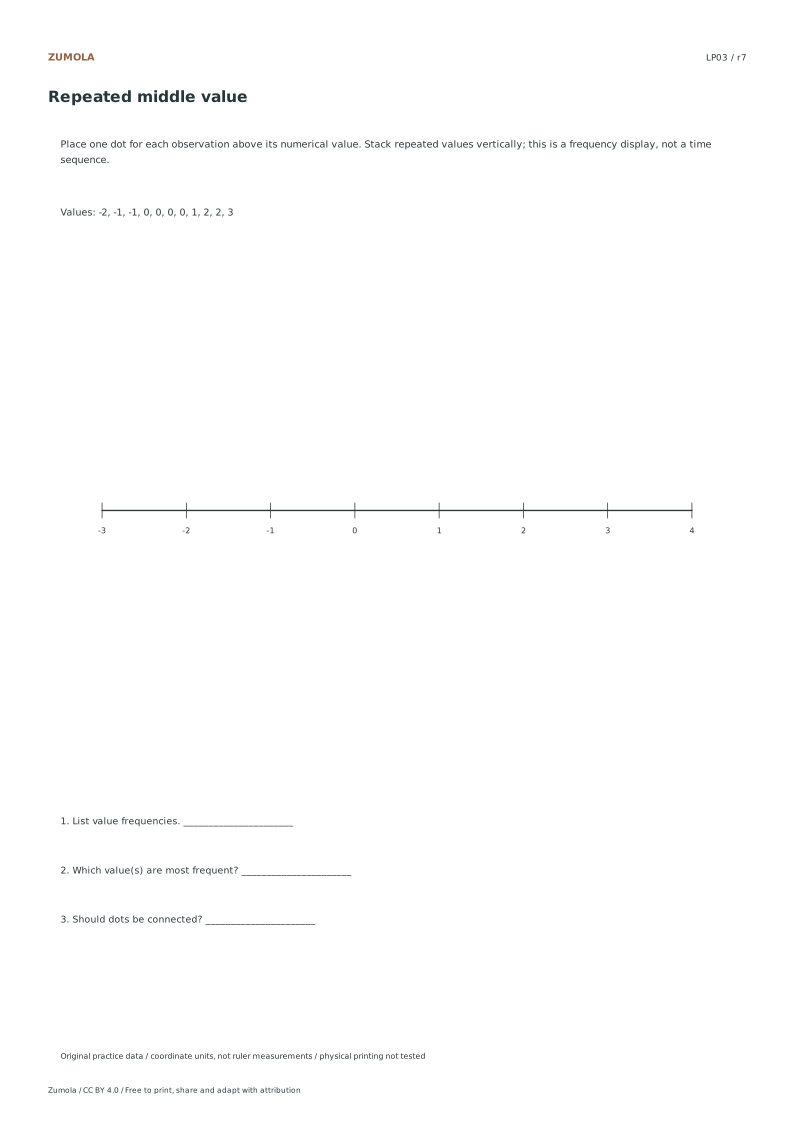
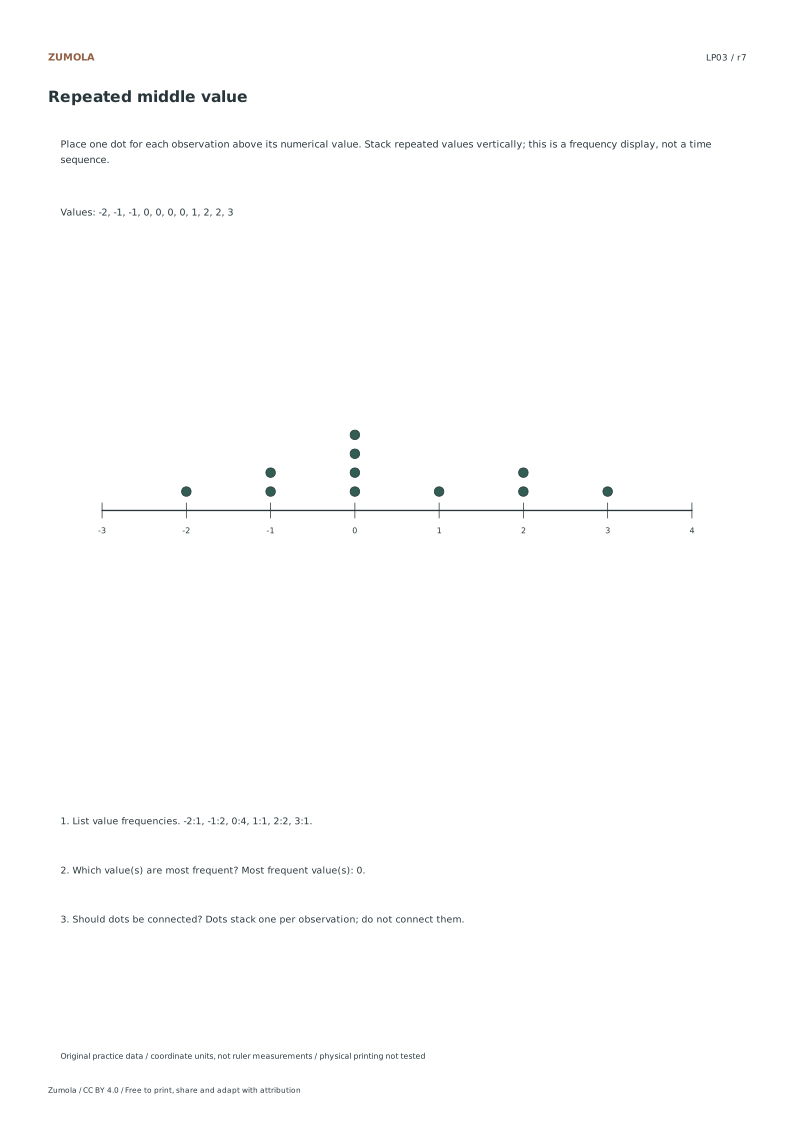
Stack each observation.
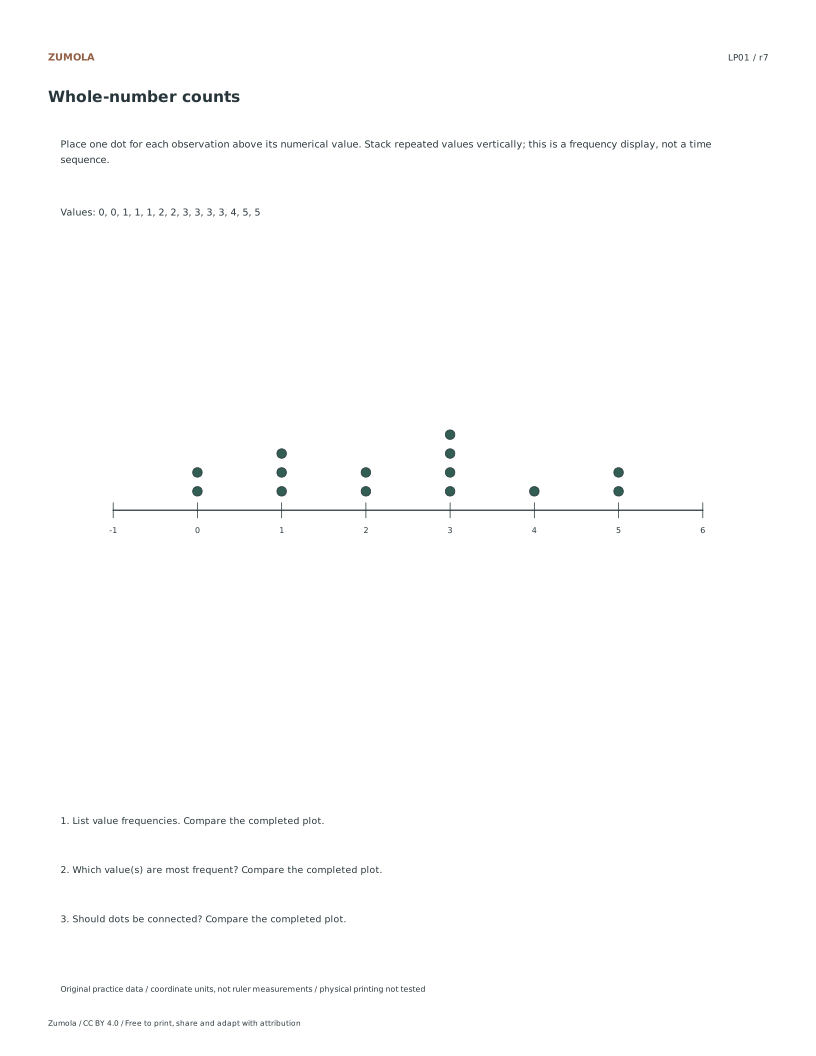
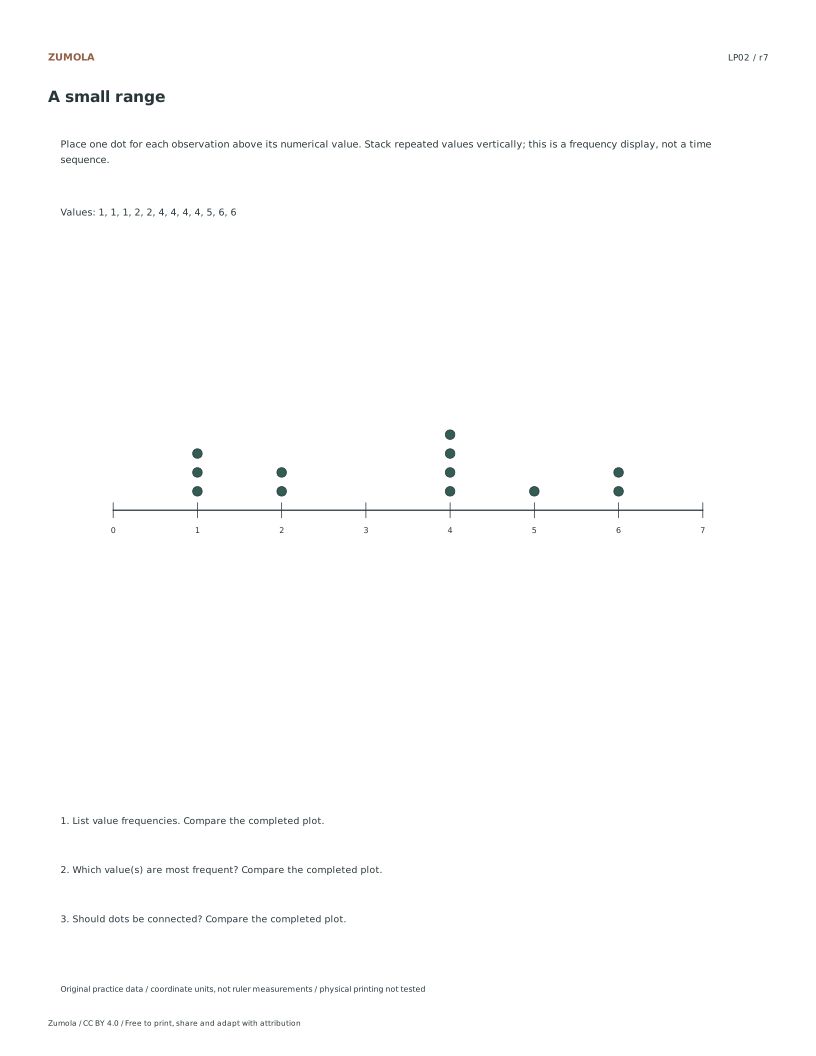
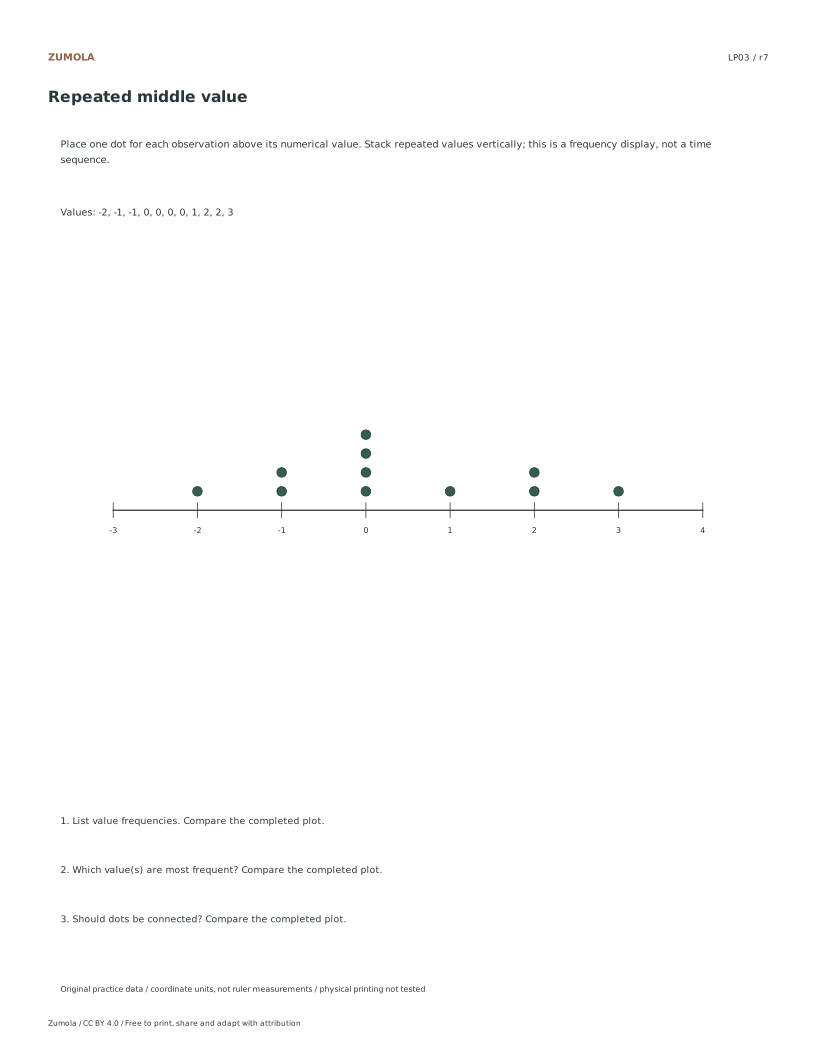
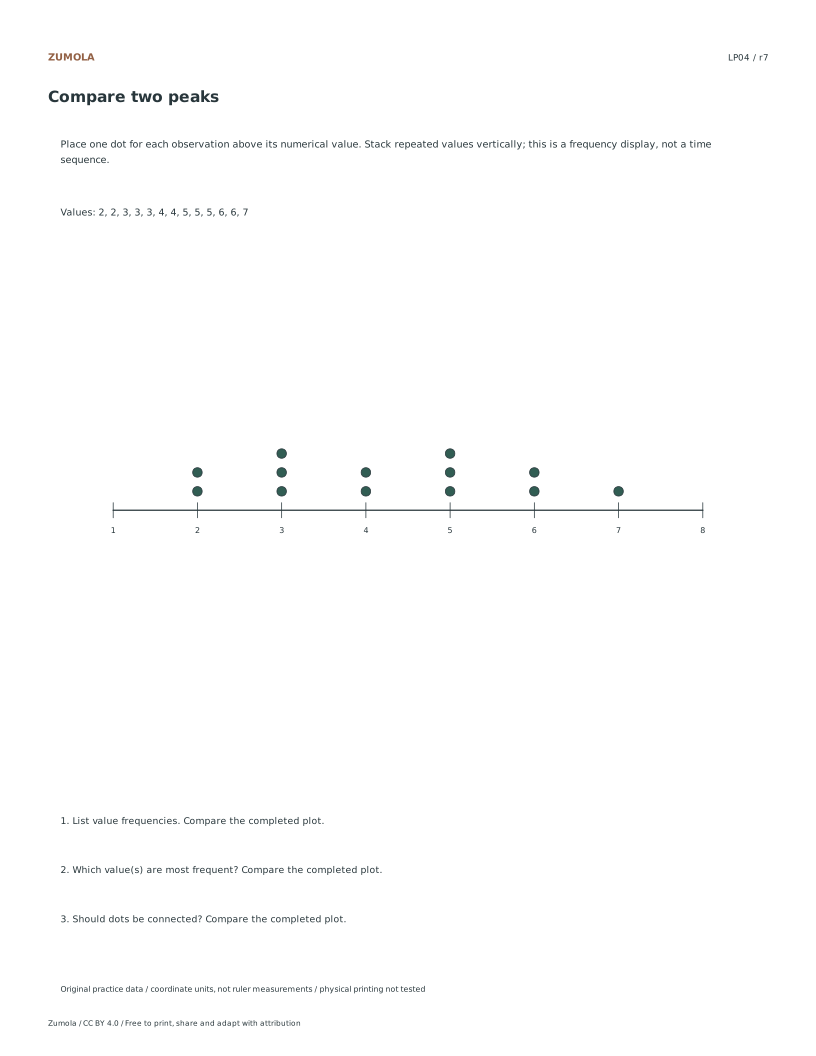
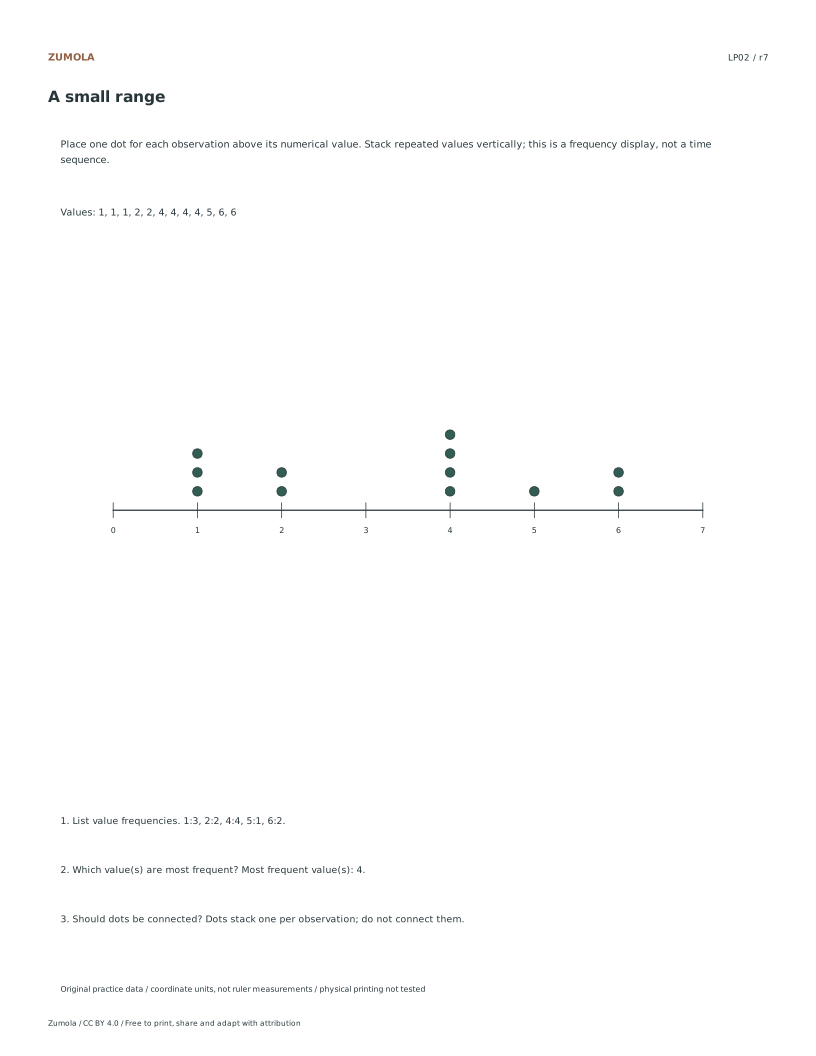
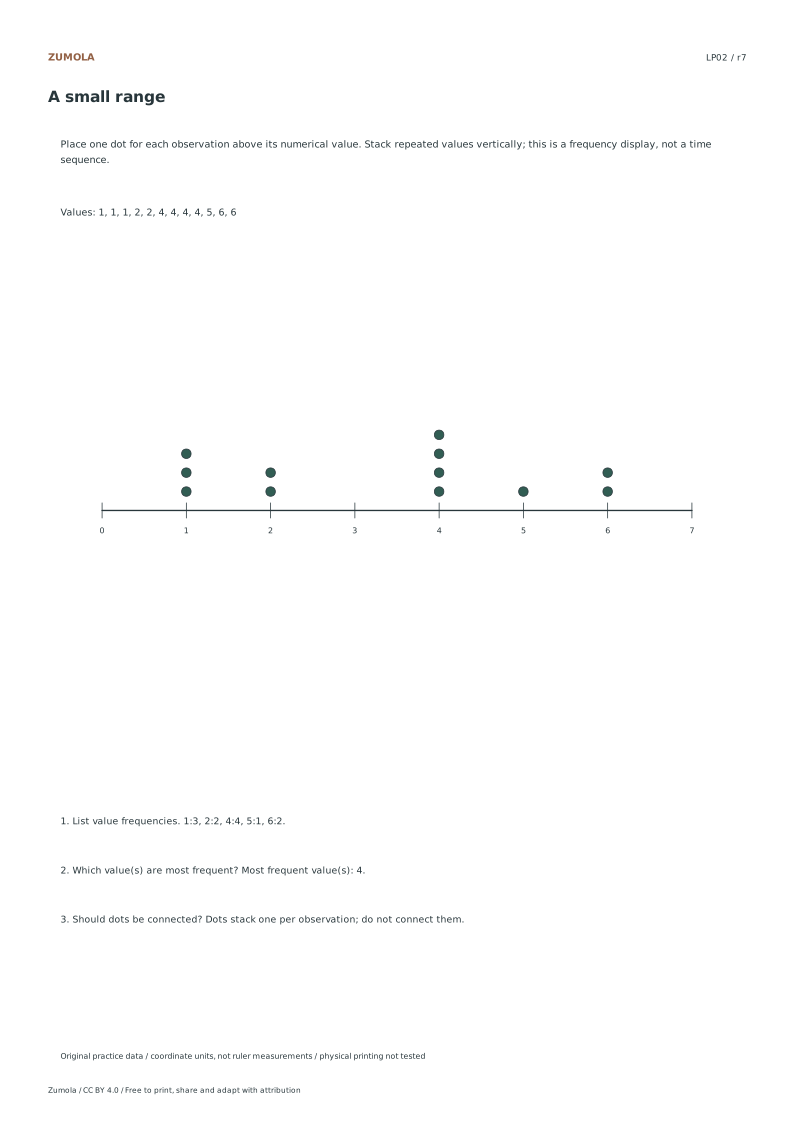
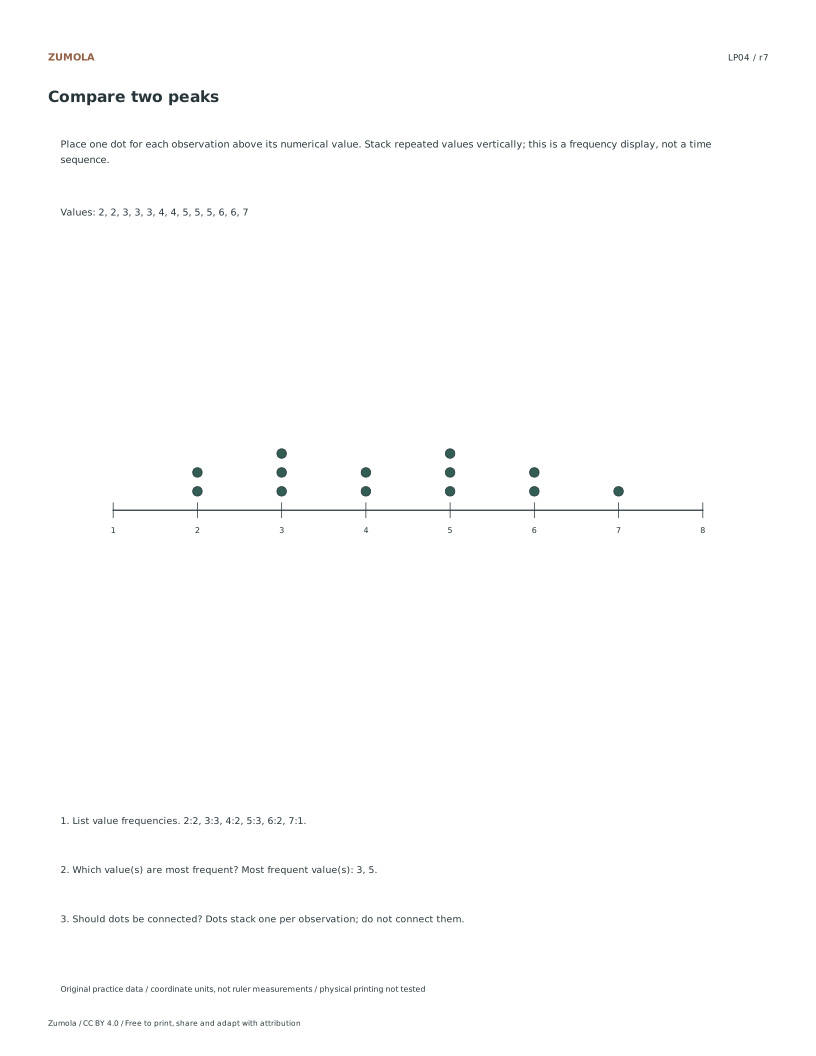
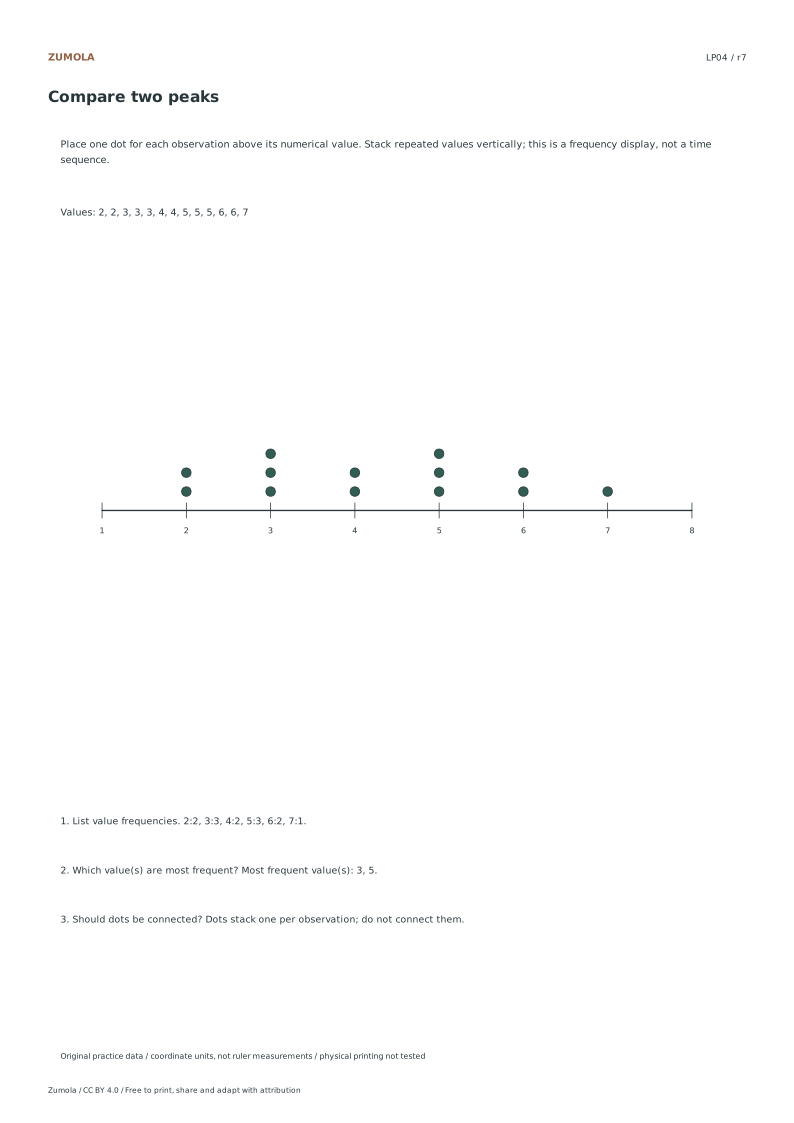
Turn four lists into line plots. Count repeated values, identify every mode and keep the dots unconnected because this is a frequency display.
4 line-plot cases.
Frequencies + modes.
More ways to practice
Exact fractions on a scaled axis
A line plot places each distinct value at its exact position on a number line and stacks a mark above it once per occurrence. When values are fractions, the axis must be divided into equal intervals that let each fraction land on a tick or a clearly labeled midpoint. Choose a scale that fits the data range, then label enough ticks that a reader can identify every plotted value without guessing.
Do not round fractions to the nearest whole number to make plotting easier. Rounding changes the data and can merge two distinct values into one stack, which alters the mode and the shape of the display. If a value falls between labeled ticks, either add a tick at that fraction or state the interval clearly so the position is unambiguous.
- List every data value as an exact fraction in its simplest form.
- Find the smallest and largest values to set the axis range.
- Choose equal intervals that place each fraction on a tick or labeled midpoint.
- Plot one mark per occurrence, stacking directly above the matching value.
- Count the marks and compare with the number of data entries.
Frequency totals and diagnostic checks
The sum of all stack heights must equal the number of entries in the data list. This single check catches most plotting errors: a missed value, a duplicated mark, or a value placed at the wrong tick. Record each frequency beside its value before plotting, then add the frequencies and compare with the list length.
A second check is positional. Read each stack back to its axis label and confirm it matches the intended fraction. Values close together, such as three-eighths and one-half, are easy to misplace when intervals are coarse. If two stacks sit on adjacent ticks, verify the axis labels rather than trusting visual spacing alone.
- Write a frequency table: value, then count.
- Add the counts and compare with the total number of data entries.
- Read each stack back to its axis label and confirm the fraction.
- Identify every mode as the value or values with the tallest stack.
- State the range as the largest value minus the smallest value.
Line plot versus bar graph and histogram
A line plot shows individual exact values with stacked marks and no connecting line. A bar graph compares categories, where the horizontal axis holds labels rather than a continuous number scale. A histogram groups continuous data into bins and uses touching bars, so individual values are not shown.
Label the data type on the sheet: discrete measured values suit a line plot, categories suit a bar graph, and continuous measurements grouped into intervals suit a histogram. If bins are used, state the bin width and the quartile method, because different conventions can shift boundary values.
- Decide whether the data are exact discrete values, categories, or grouped continuous measurements.
- Use a line plot only for exact values plotted on a number scale.
- If grouping, state the bin width and how boundary values are assigned.
- State the quartile method if quartiles are reported.
- Confirm the frequency total equals the entry count before interpreting.
Stacking marks without ambiguity
Stack marks vertically and keep them the same size so height reads as frequency. Leave a small, consistent gap between the axis and the first mark so the value position stays visible. Avoid offsetting stacks sideways, which can suggest a second value at the same position.
Keep labels horizontal where possible and space ticks evenly. If the axis is crowded, extend the range rather than skipping labels, since skipped labels make exact fraction positions hard to verify.
- Use identical marks and align each stack directly above its value.
- Keep a consistent gap between the axis and the lowest mark.
- Space ticks evenly and label every plotted value.
- Extend the axis range instead of omitting labels.
Reading a completed plot
When interpreting, report the mode, the range, and the total count, and note any gaps where no value occurs. A gap is meaningful: it shows a value absent from the data, not a plotting error. Compare two peaks by their heights, not by how wide the stacks look.
For a rubric-based art or design task, judge clarity, correct positioning, and consistent stacking rather than expecting one exact picture. Multiple valid layouts can communicate the same data accurately.
- Report the mode or modes from the tallest stacks.
- Report the range from the smallest and largest plotted values.
- Note gaps as absent values.
- Compare peaks by stack height.
Try this example
Plot these eight measurements on a line plot: one-half, three-quarters, one-half, one-quarter, three-quarters, one-half, one-quarter, one-half.
Show the worked explanation
Count each exact value: one-quarter appears twice, one-half appears four times, and three-quarters appears twice. The frequencies sum to 2 + 4 + 2 = 8, matching the eight entries. Set the axis from one-quarter to three-quarters with ticks at one-quarter, one-half, and three-quarters. Stack two marks above one-quarter, four above one-half, and two above three-quarters. The mode is one-half with four marks. The range is three-quarters minus one-quarter, which equals one-half. No connecting line is drawn.
Common mistakes
- Rounding fractions to whole numbers so they fit existing ticks. Add ticks or labeled midpoints at the exact fractions instead of changing the data.
- Stack heights that do not add up to the number of data entries. Build a frequency table first, sum the counts, and compare with the list length before plotting.
- Treating a histogram with bins as a line plot of exact values. State the bin width and boundary rule, and use touching bars for grouped continuous data.
Check your work
- Every plotted value matches an entry in the data list exactly, with no rounding.
- Stack heights sum to the number of data entries.
- Each stack sits directly above its correct axis label.
- All modes are identified from the tallest stacks.
- The range is computed from the smallest and largest plotted values.
- Gaps are shown as absent values rather than omitted ticks.
- Marks are unconnected and consistently sized.
- Axis ticks are evenly spaced and every plotted value is labeled.
Questions before you start
Should the marks on a line plot be connected by a line?
No. A line plot is a frequency display, so marks stack above each value and are not joined. A connecting line implies a trend between points, which is a different graph.
How do I plot a fraction that falls between labeled ticks?
Add a tick at that exact fraction or label the midpoint clearly. Do not round the value, because rounding merges distinct values and changes the mode.
What total should the stack heights add up to?
The sum of all stack heights must equal the number of entries in the data list. If it does not, a value was missed, duplicated, or placed at the wrong position.