Free original resources
Asymmetric Graph Paper: Independent Horizontal and Vertical Spacing
Set horizontal and vertical grid spacing separately so rectangular cells are not mistaken for squares. Covers axis types, log scales, ternary coordinates, and a rubric.
Free resources
Letter & A4
PDF & SVG
Letter & A4
PDF & SVG
Make it yours.
Free · no signup · calculated in your browser
Your free printable kit.
Original reference, student practice and separate worked answers. No account or payment.
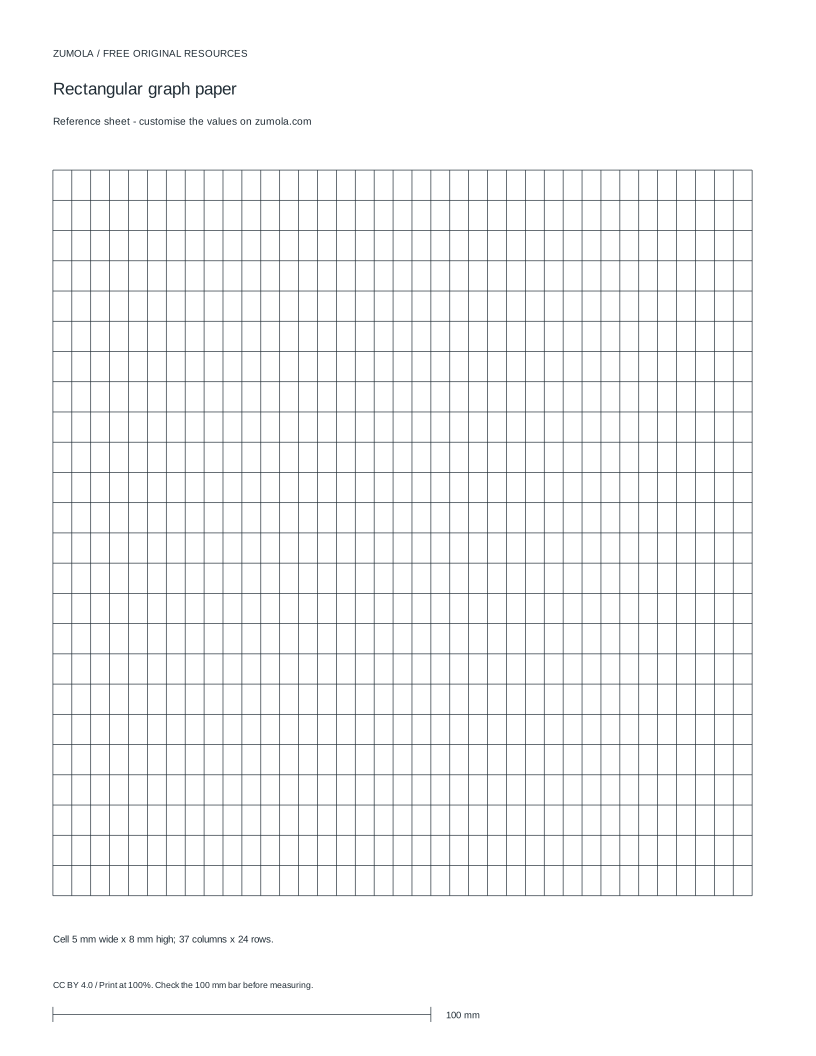
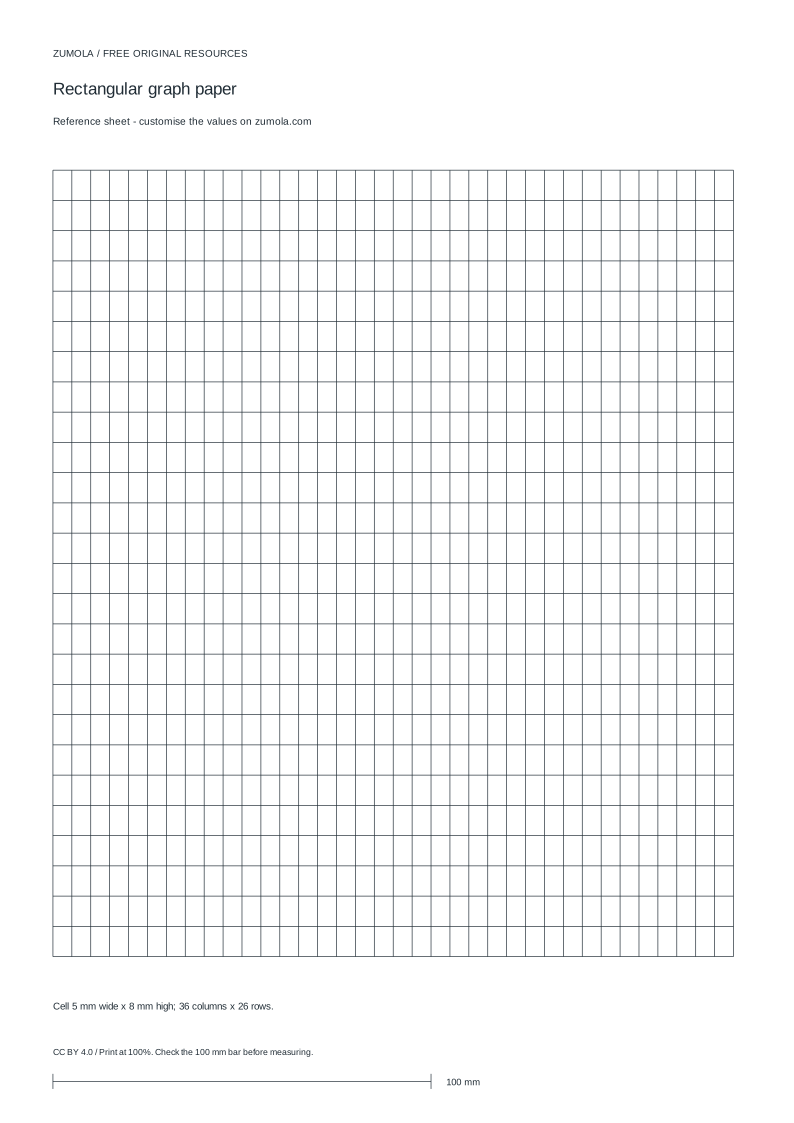
Practice worksheet
Worked answers / rubric
Print at Actual size / 100%. Check the calibration bar before using physical dimensions.
Asymmetric graph paper uses one spacing between vertical lines and a different spacing between horizontal lines, producing rectangular cells rather than squares. That difference is the point: it lets a chart stretch one axis while keeping the other readable. The main risk is forgetting which axis is which, then reading a rectangle as a square or plotting values against the wrong spacing. This page explains the method, the axis assumptions to state before drawing, and how to check a sheet before relying on it.
What asymmetric spacing changes
On ordinary square graph paper, one cell is one unit wide and one unit tall, so a diagonal at 45 degrees looks like a diagonal. On asymmetric paper the cell width and cell height differ. A cell that is 5 mm wide and 8 mm tall is not a square, and a line that crosses one cell horizontally and one cell vertically is not at 45 degrees on the page even if it represents equal coordinate steps.
The spacing is a property of the paper, not of the data. Decide first whether the horizontal spacing represents a fixed number of coordinate units per cell and the vertical spacing represents a different number, or whether both spacings represent the same unit but the page is stretched for layout. Write that decision at the top of the sheet. Without it, a reader cannot tell whether a rectangle means unequal data steps or merely unequal printing.
Keep the two directions named consistently. Call the horizontal direction x and the vertical direction y, or use left-right and up-down, and use the same words in labels, notes, and any table of values. Mixing names is the most common source of misread points on asymmetric sheets.
- Choose the horizontal spacing and the vertical spacing as separate values in the same unit, for example 5 mm and 8 mm.
- State which coordinate axis each spacing represents and how many coordinate units one cell covers in that direction.
- Mark the origin and label both axes with their unit and scale before plotting anything.
- Check one known point by counting cells in each direction separately, not by counting diagonal cells.
Axis types and scale assumptions
A linear axis keeps equal coordinate steps in equal page distances. If one cell covers 2 units horizontally and 5 units vertically, then moving two cells right is 4 units and moving two cells up is 10 units. The page distances are unequal, but each axis is internally consistent.
A logarithmic axis cannot include zero or negative values. If a vertical axis is logarithmic, every plotted value must be positive, and equal page distances represent equal ratios rather than equal differences. Mixing a linear horizontal axis with a logarithmic vertical axis is valid, but the reader must be told, because a straight line on such a plot is not a straight line in the original values.
Ternary coordinates use three components that sum to a constant, usually 1 or 100 percent. On an asymmetric sheet, the three directions may not be equally spaced on the page, so each component must be read along its own direction with its own spacing. Check that the three components still sum to the constant after reading; if they do not, a spacing or direction was misapplied.
- Label each axis as linear or logarithmic before plotting.
- For a logarithmic axis, confirm every value is greater than zero.
- For ternary coordinates, record the constant sum and verify each point against it.
- If the two axes use different units, write both units on the sheet.
Checking a printed sheet
Printing can change the physical spacing. Before using a printed sheet for measurement, print a calibration bar and measure it with a ruler. If the measured length differs from the intended length, adjust the print scale and print again. Only after the calibration bar matches should you treat the stated spacings as physical distances.
A quick visual check also helps. Count the cells across a known horizontal distance and the cells along a known vertical distance, then compare each count with the stated spacing. If either count is off, the sheet is not behaving as labeled.
Remember that the numbers on a schematic math chart are abstract coordinate units, not millimetres, unless the sheet explicitly says otherwise. Do not convert between the two without a stated scale.
- Print a calibration bar and measure it with a ruler.
- Adjust the print scale until the measured length matches the intended length.
- Count cells in each direction and compare with the stated spacing.
- Record the unit used for each axis on the sheet itself.
Choosing between coordinate paper and a function plotter
Asymmetric graph paper is for drawing and reading coordinates by hand, where you control each point. A function plotting tool is for evaluating a function across many inputs and displaying the result. The tasks differ: one asks where a point sits on a grid, the other asks what a function does over a range.
If the goal is to sketch a relationship and check individual points, use the paper. If the goal is to see the shape of a function over an interval, use a plotting tool and treat the paper as a sketch aid. Do not assume a plotting tool's output matches a hand-drawn sheet unless the axis types and scales are the same.
- Decide whether the task is reading or placing individual points, or evaluating a function over a range.
- For point placement, use the paper and state both spacings.
- For function evaluation, use a plotting tool and note its axis types.
- Compare only when the axis types and scales match.
Try this example
A sheet has horizontal spacing of 5 mm per cell and vertical spacing of 8 mm per cell. A point is 3 cells right of the origin and 2 cells up. What are its page distances from the origin, and is the cell it sits in a square?
Show the worked explanation
Horizontal distance is 3 times 5 mm, which is 15 mm. Vertical distance is 2 times 8 mm, which is 16 mm. The cell is 5 mm wide and 8 mm tall, so it is a rectangle, not a square. The point is 15 mm right and 16 mm up from the origin, and the two distances are not equal even though the cell counts differ by one.
Common mistakes
- Treating a rectangular cell as a square and reading a diagonal as equal steps in both directions. Count cells separately along each axis and convert each count with its own spacing before combining them.
- Plotting zero or a negative value on a logarithmic axis. Check every value is greater than zero before plotting on a log axis, and relabel the axis if it is linear.
- Reading ternary components without confirming they sum to the stated constant. Add the three components after reading and compare with the constant; if they differ, recheck each direction and spacing.
Check your work
- Both horizontal and vertical spacings are stated with units.
- Each axis is labeled as linear or logarithmic, and log axes contain only positive values.
- Ternary components are checked against the stated constant sum.
- A calibration bar is measured before the sheet is used for physical measurement.
- Cell counts in each direction are converted with the correct spacing before combining.
Questions before you start
Can I use asymmetric graph paper for knitting charts?
Yes, if each stitch is represented by one cell and the chart states which direction is rows and which is stitches. Because cells are rectangular, the chart will not look square, so label both directions and keep the stitch count per cell consistent.
Does a logarithmic axis change the spacing rule?
No. The spacing between grid lines is still fixed on the page, but equal page distances represent equal ratios. Zero and negative values cannot be plotted on a logarithmic axis.
How do I know a printed sheet has the stated spacing?
Print a calibration bar, measure it with a ruler, and adjust the print scale until it matches. Then count cells in each direction and compare with the stated spacing before using the sheet for measurement.