Free printable resources · Original practice
Semi-log graph paper.
Choose which axis changes.
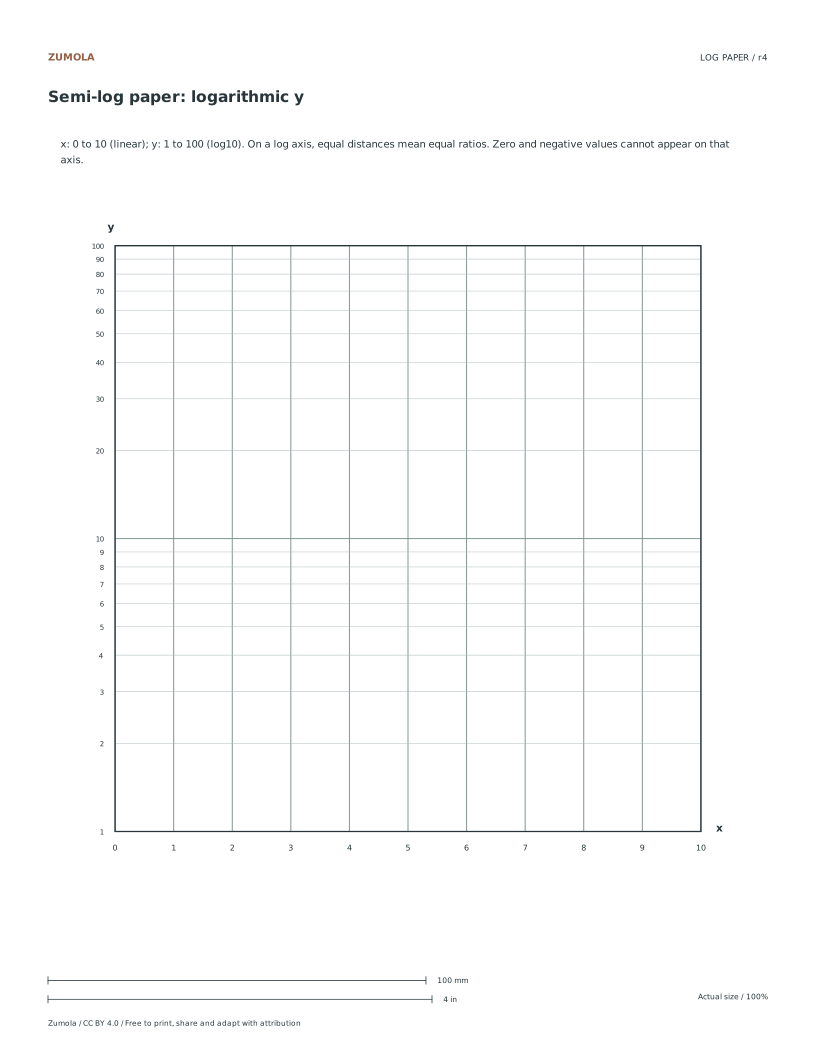
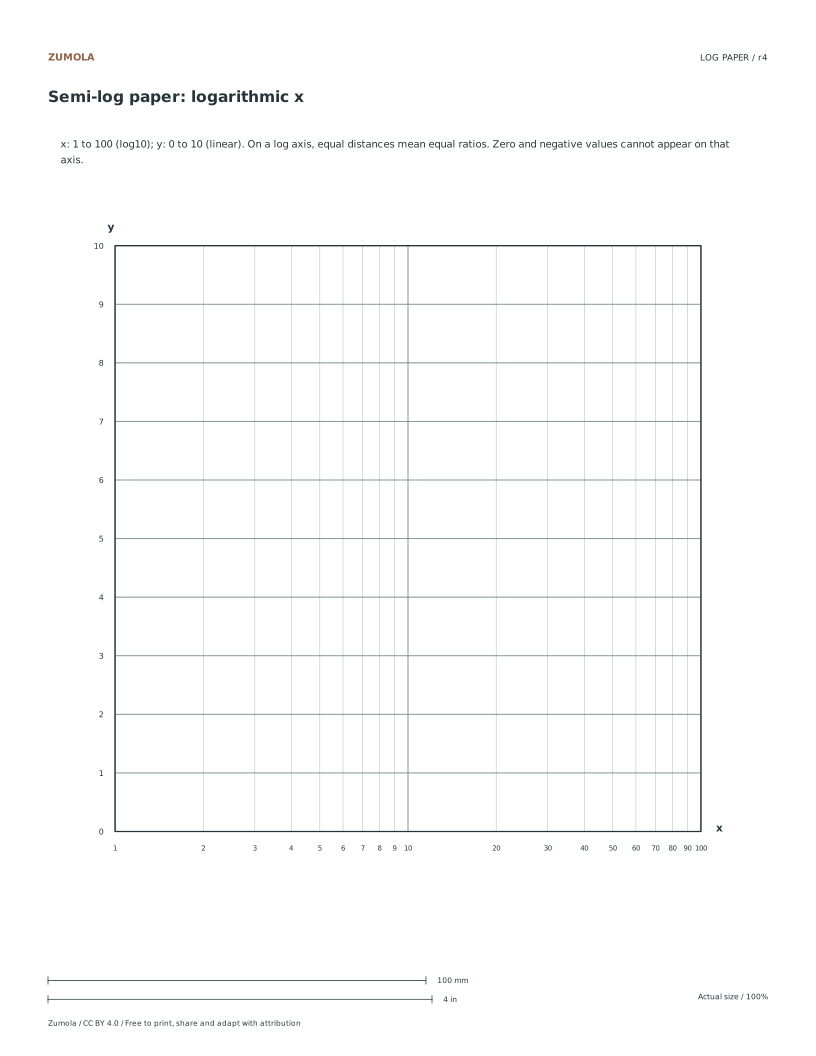
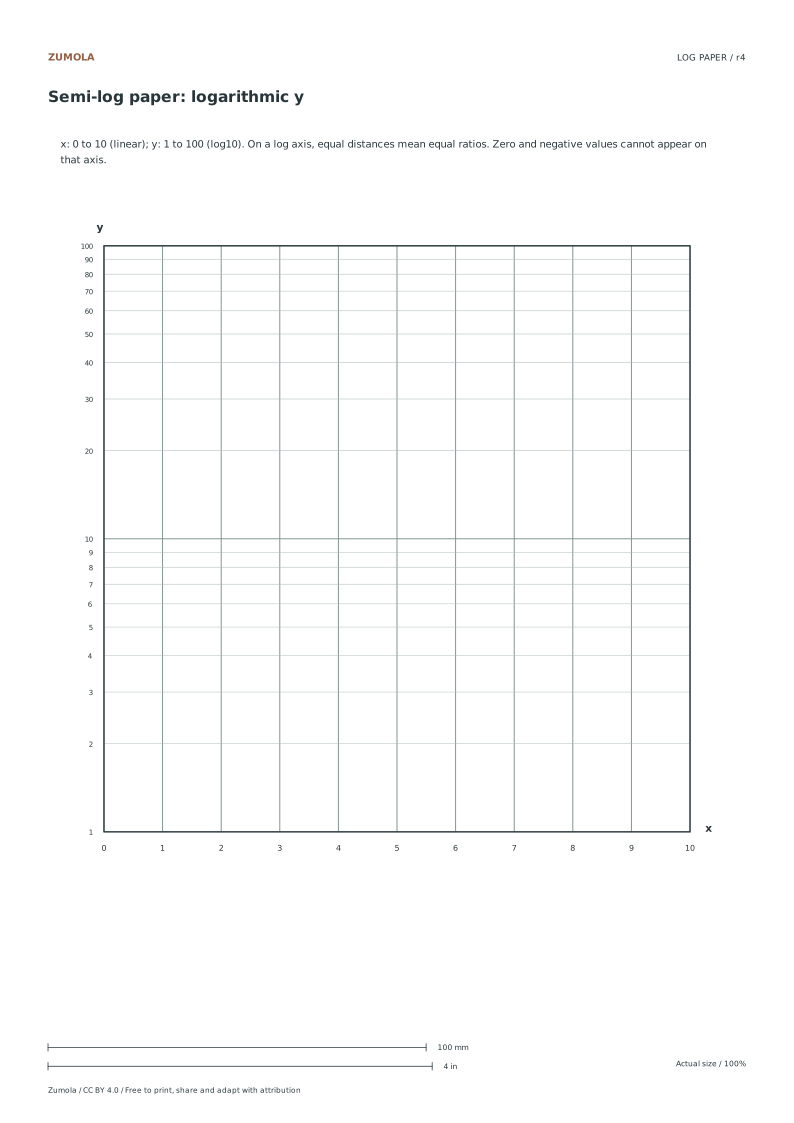
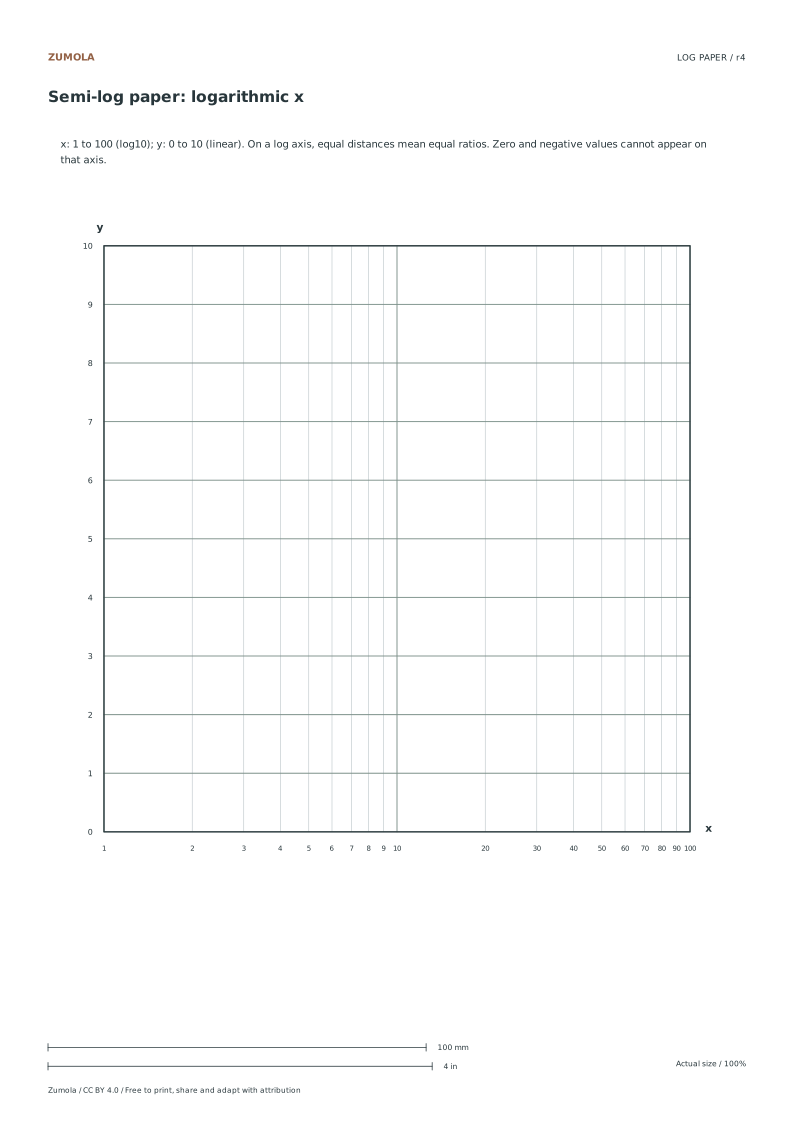
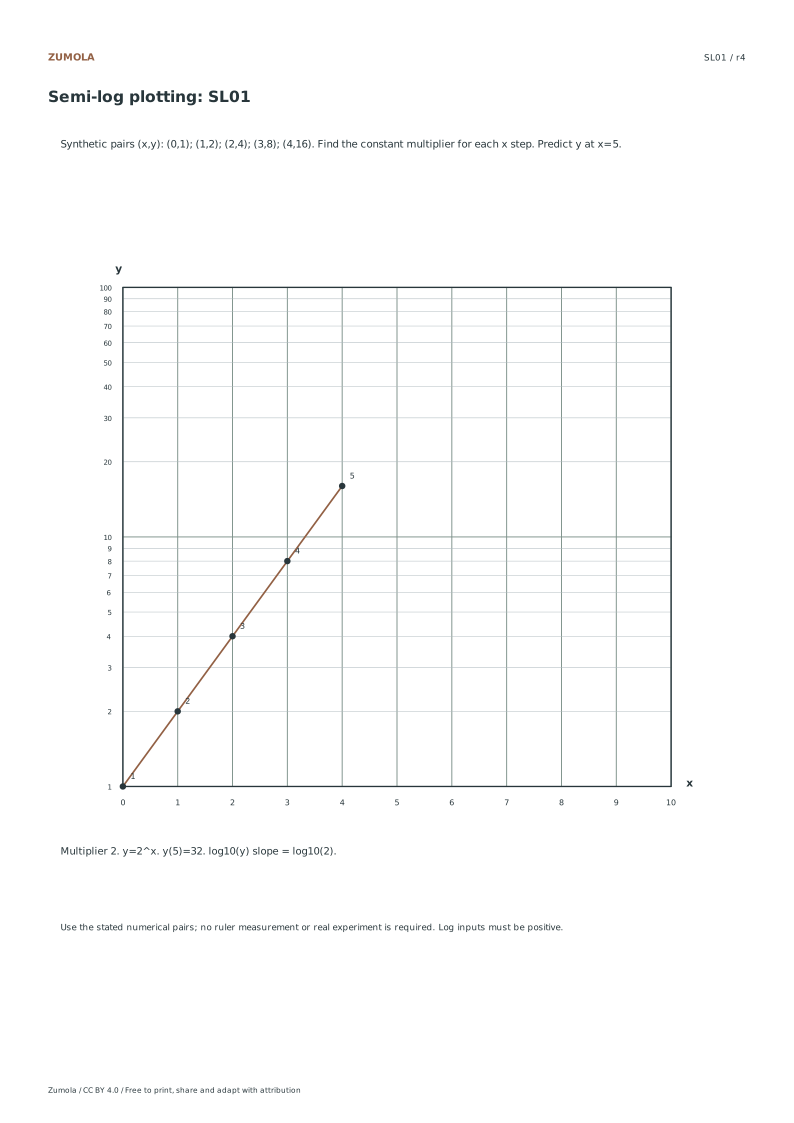
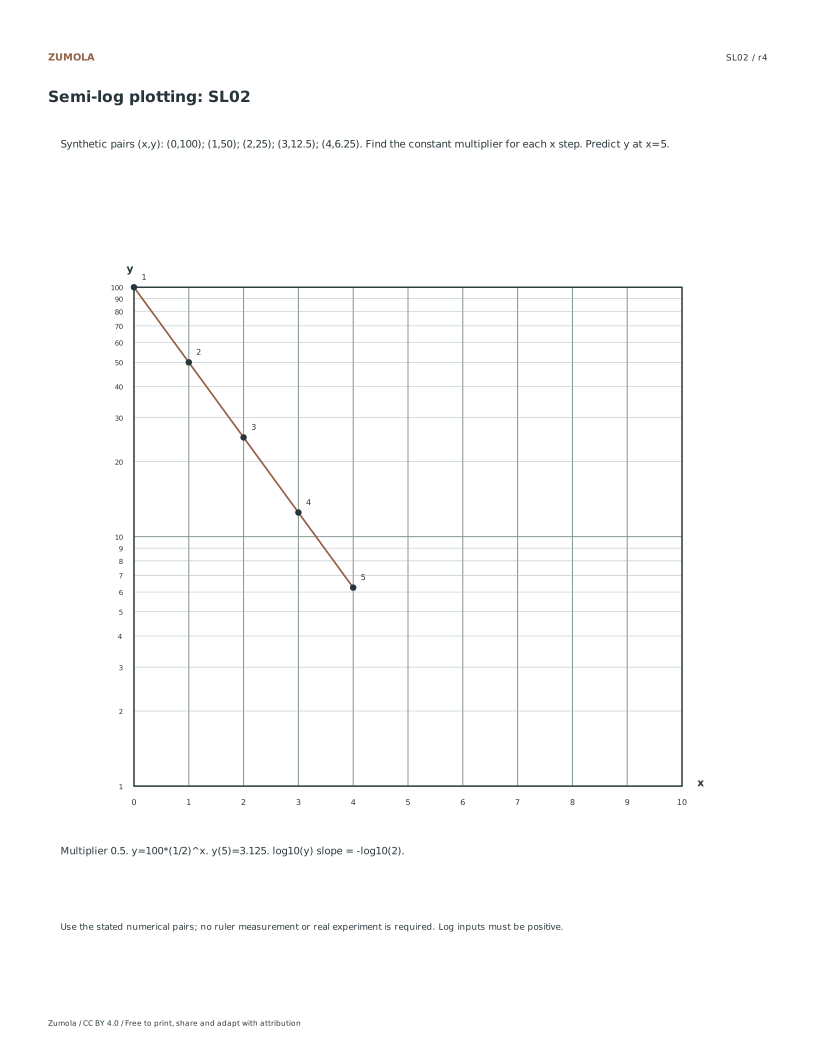
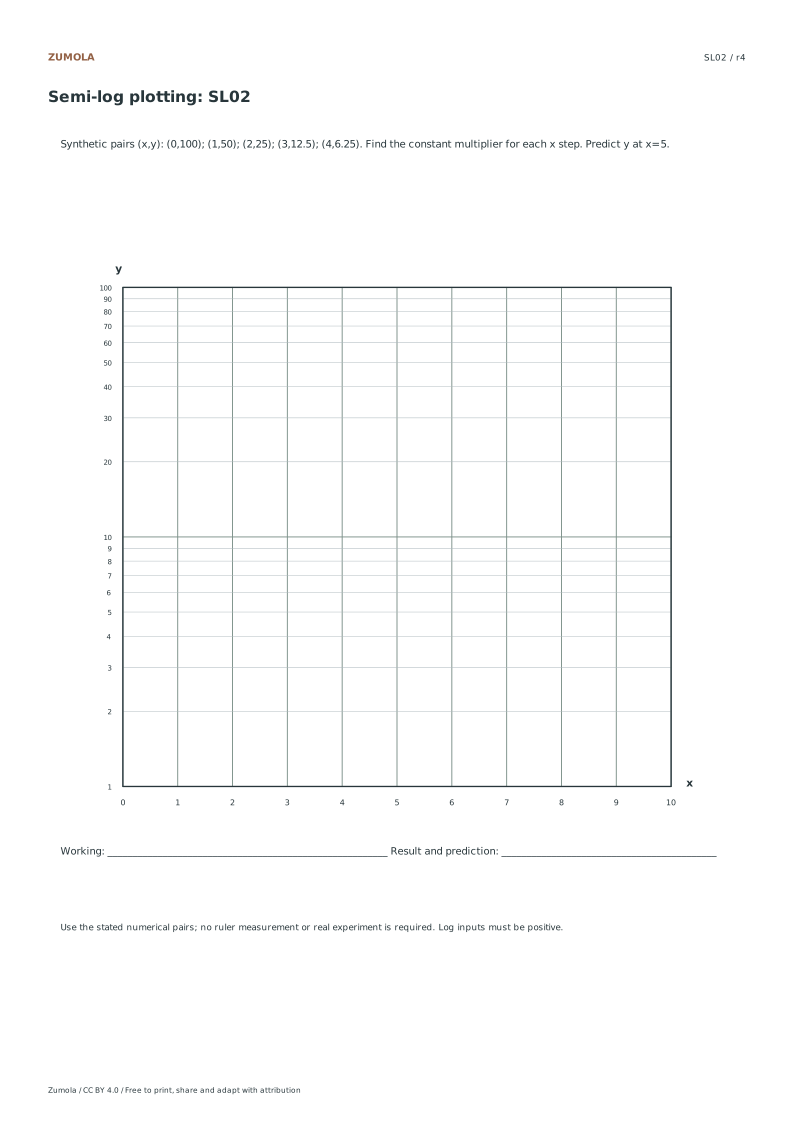
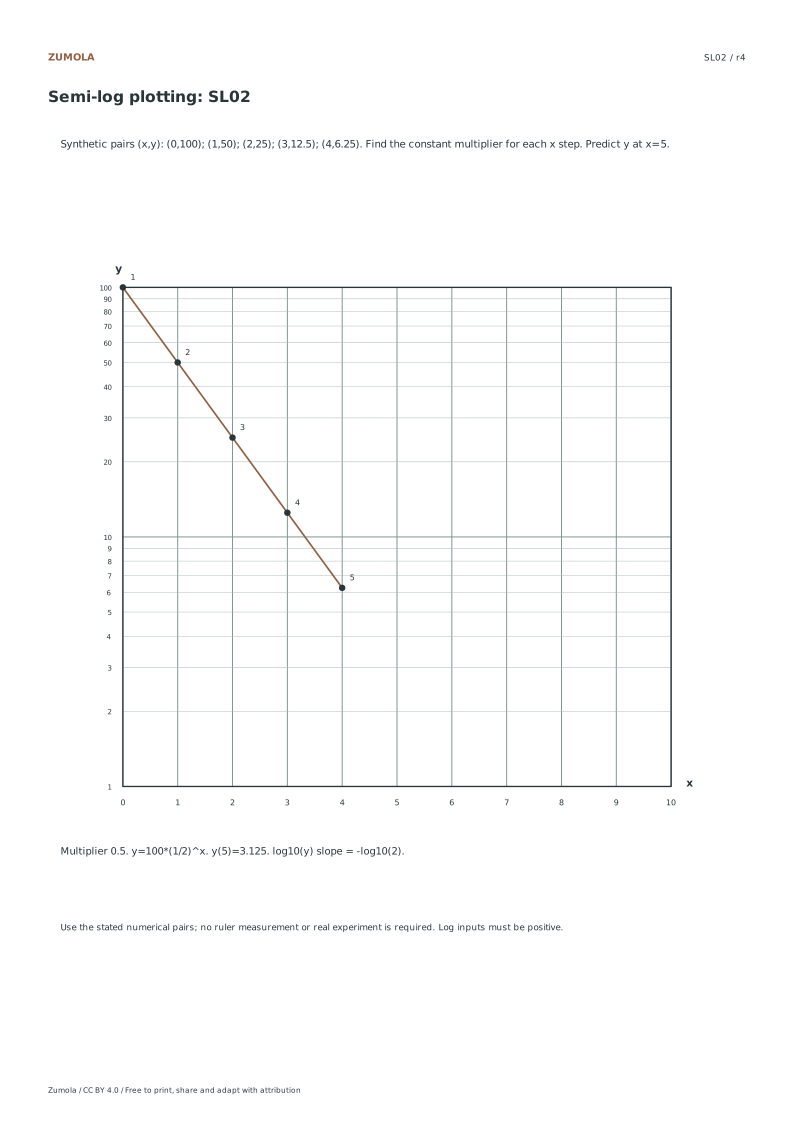
Keep one axis linear and make the other logarithmic. Compare exact growth and decay data, with the logarithmic axis clearly labeled.
Two axis orientations.
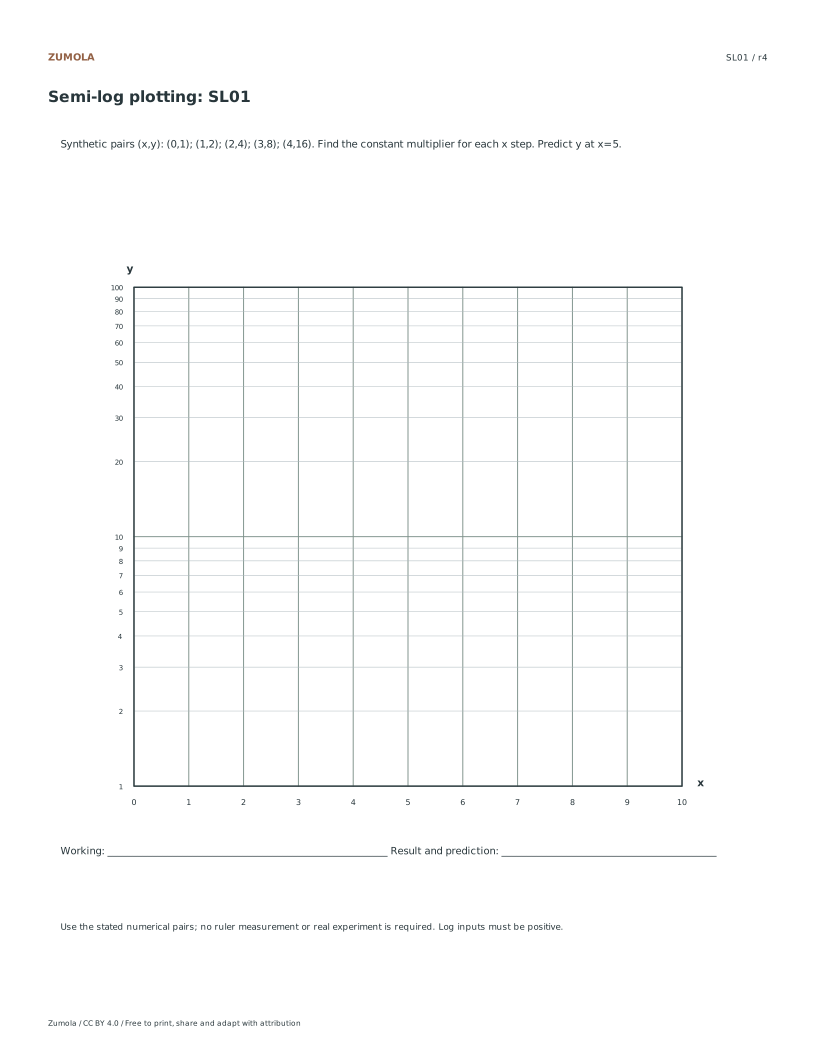
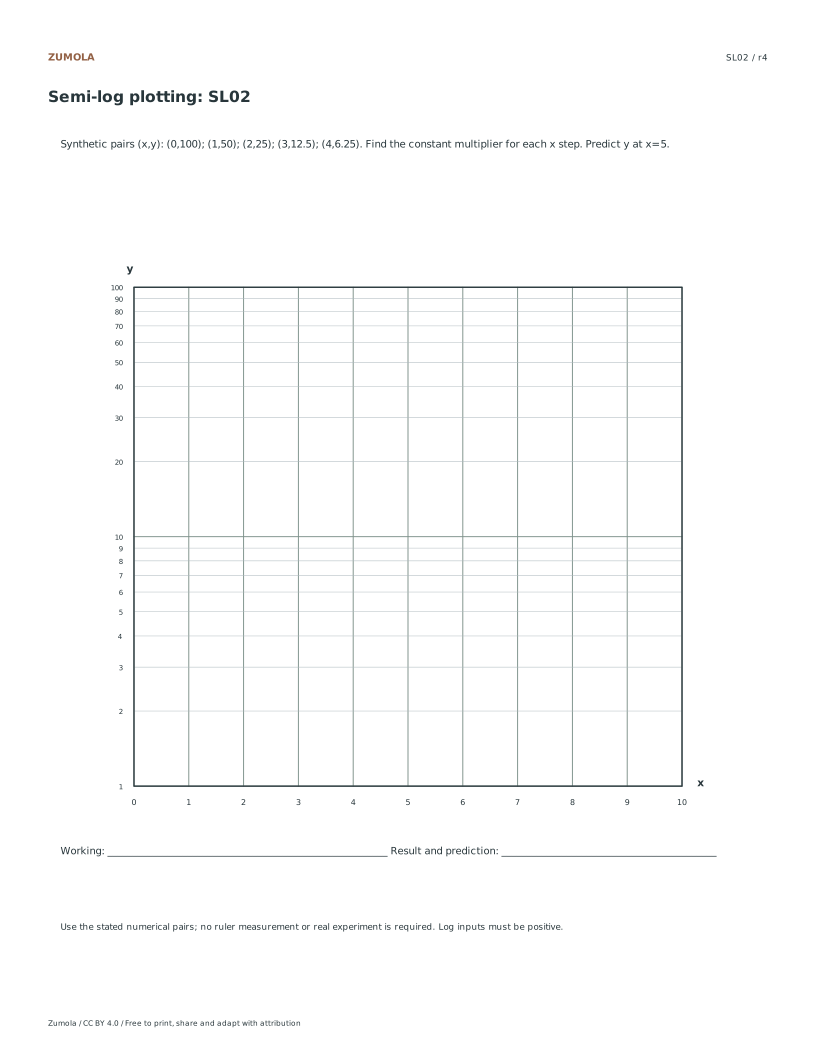
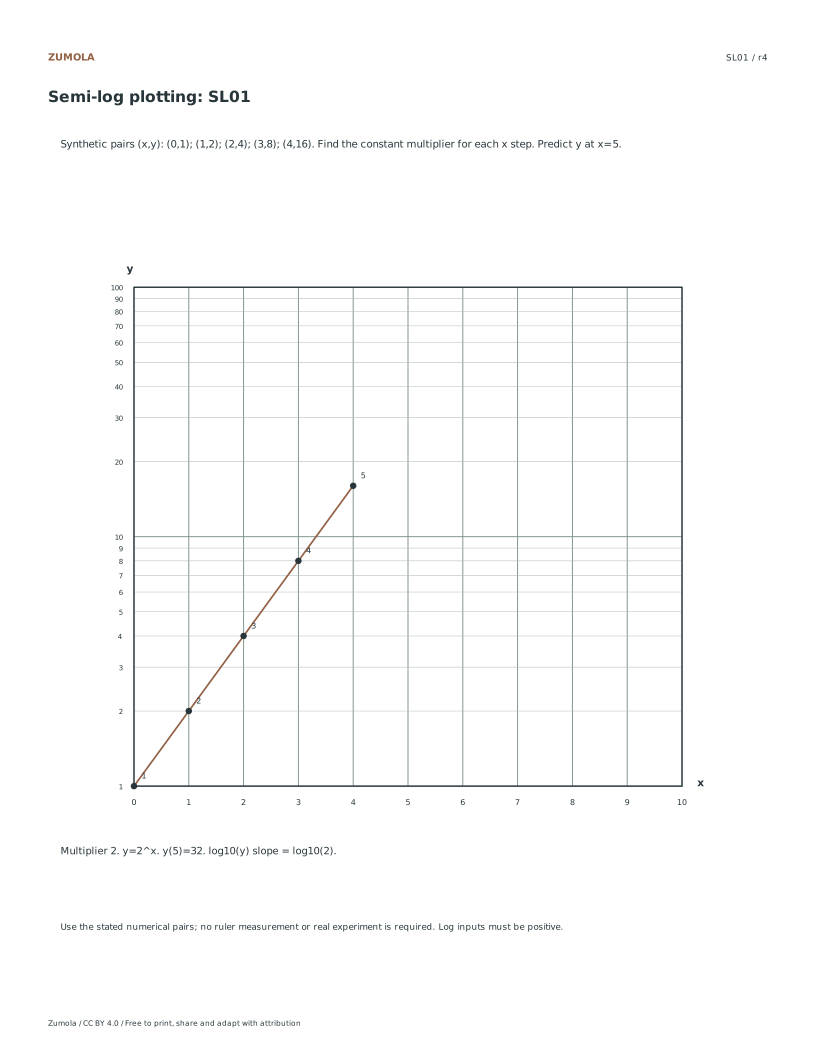
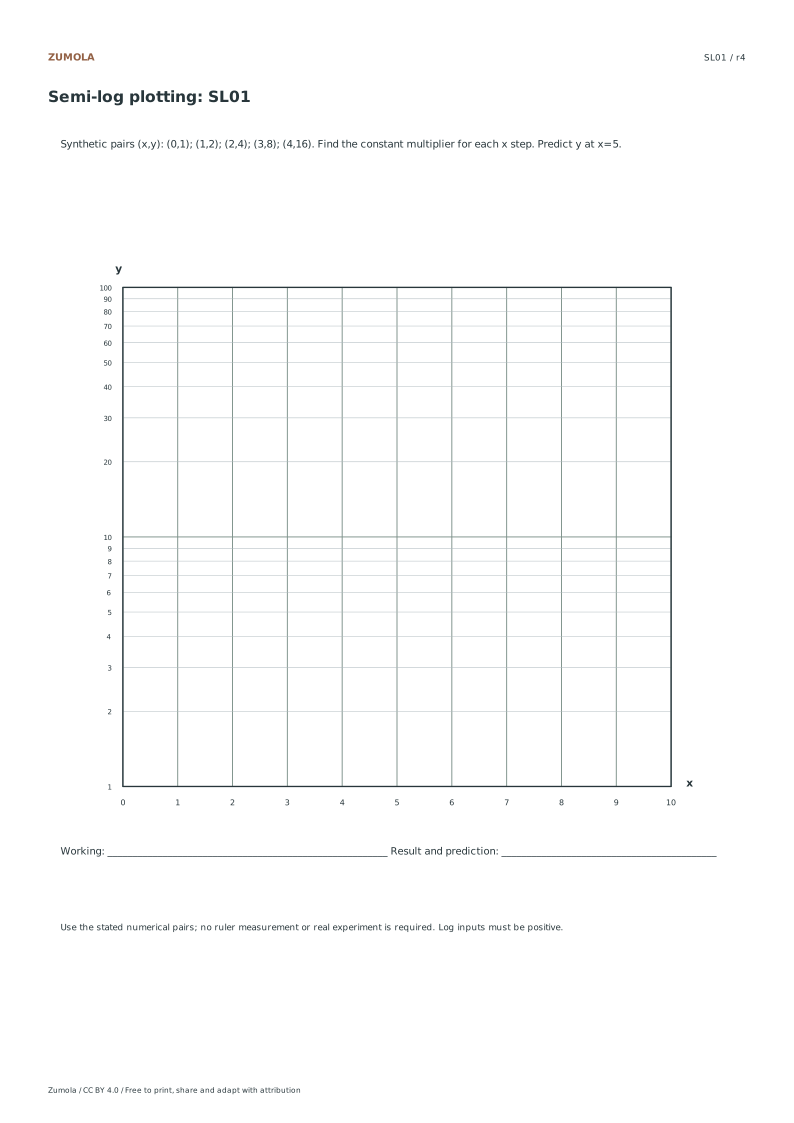
Growth + decay answers.
Print a test sheet before the full pack
Choose the file matching the paper in your printer. Print the PDF at Actual size / 100%, turning off Fit, Shrink and browser headers. An SVG editor or browser can change its scale even though the file uses millimeter dimensions. Use the supplied calibration bars where present when a task depends on physical size; a screen preview alone does not establish printed size.
The packs contain the same individual pages in collection order. They are a convenient download, not extra different exercises. On coordinate plots, uniform scaling preserves the numerical positions relative to the axes. On image-copy tasks, keep the specified proportions and any stated source-to-target enlargement. Color is optional: labels, line positions and relative lightness also explain the references.
More ways to practice
Label the axes before you plot anything
A semi-log sheet is only useful if the reader knows which axis is logarithmic. Write the axis name and the scale type at the end of each axis before placing the first point. On a logarithmic y-axis, mark the decade boundaries (1, 10, 100, and so on) and note that the spacing between 1 and 2 is wider than between 8 and 9. On the linear x-axis, mark equal intervals and state the unit.
A second check is the direction of growth. On a logarithmic axis, equal vertical distances represent equal multiplicative factors, not equal additions. If your data doubles, the vertical gap stays the same wherever you start. Confirm this by measuring two gaps that should match before you trust the rest of the plot.
- Write the axis name and scale type at each axis end.
- Mark decade boundaries on the logarithmic axis and equal intervals on the linear axis.
- Plot one pair and measure its vertical gap to the next decade line.
- Plot a second pair that should show the same multiplicative change and compare gaps.
A fresh worked example with a logarithmic y-axis
Suppose a culture count is recorded at four times: at 0 hours the count is 5, at 1 hour it is 10, at 2 hours it is 20, and at 3 hours it is 40. The x-axis is linear in hours, so the points sit at equal horizontal spacing. The y-axis is logarithmic, so each doubling produces the same vertical gap.
To place 5 on a logarithmic axis between 1 and 10, use the logarithm rather than the arithmetic midpoint. Since log(5) is about 0.699 and log(10) is 1, the point for 5 sits above the halfway height of that decade. The values 10, 20, and 40 each move up by one equal doubling step. If your plotted gaps are unequal, the axis is probably linear by mistake or the labels are misread.
- List the pairs: (0, 5), (1, 10), (2, 20), (3, 40).
- Confirm the x-axis is linear, so horizontal spacing is equal.
- Place 5 between 1 and 10 using logarithmic spacing, above the arithmetic midpoint.
- Check that each doubling gives the same vertical gap.
Diagnostic checks after plotting
After plotting, run three quick checks. First, confirm no plotted value is zero or negative on the logarithmic axis, since those cannot be placed. Second, confirm the vertical gaps for equal multiplicative changes match. Third, confirm the axis labels state the scale type, not just the unit.
If the points form a straight line on a semi-log plot, the underlying relationship is exponential. If they curve, the relationship is not exponential, and you should not force a straight line through them. Record what you see rather than what you expect.
- Check that every logarithmic-axis value is positive.
- Compare vertical gaps for equal multiplicative changes.
- Confirm axis labels state scale type and unit.
- Note whether the points form a straight line or a curve.
Try this example
Plot the pairs (0, 5), (1, 10), (2, 20), (3, 40) on a semi-log sheet with a linear x-axis in hours and a logarithmic y-axis.
Show the worked explanation
The x-axis is linear, so the points sit at equal horizontal spacing. The y-axis is logarithmic, so each doubling from 5 to 10, 10 to 20, and 20 to 40 produces the same vertical gap. Place 5 between 1 and 10 using logarithmic spacing: log(5) is about 0.699, above the arithmetic midpoint. The four points should form a straight line if the relationship is exponential.
Common mistakes
- Placing 5 at the arithmetic midpoint between 1 and 10 on a logarithmic axis. Use logarithmic spacing: log(5) is about 0.699, more than half of log(10) = 1, so 5 sits above the arithmetic midpoint of the decade.
- Plotting a zero or negative value on the logarithmic axis. Remove or transform that value before plotting; logarithmic axes cannot represent zero or negative numbers.
- Assuming a straight line means the data is correct. Check the axis labels and gaps first; a straight line only indicates an exponential relationship if the axes are correctly labeled and scaled.
Check your work
- Axis labels state both the scale type and the unit.
- Decade boundaries on the logarithmic axis are marked and spaced correctly.
- No zero or negative values appear on the logarithmic axis.
- Vertical gaps for equal multiplicative changes are equal.
- The plotted points are described as a line or curve based on observation, not expectation.
Questions before you start
Can I plot a value of zero on the logarithmic axis?
No. A logarithmic axis cannot represent zero or negative values. Remove or transform such values before plotting.
How do I know which axis is logarithmic?
Read the axis label. The logarithmic axis should state the scale type and show decade boundaries with unequal spacing between numbers.
What does a straight line on a semi-log plot mean?
A straight line indicates an exponential relationship between the variables, provided the axes are correctly labeled and scaled.