Reference diagrams
LETTER · Download PDF
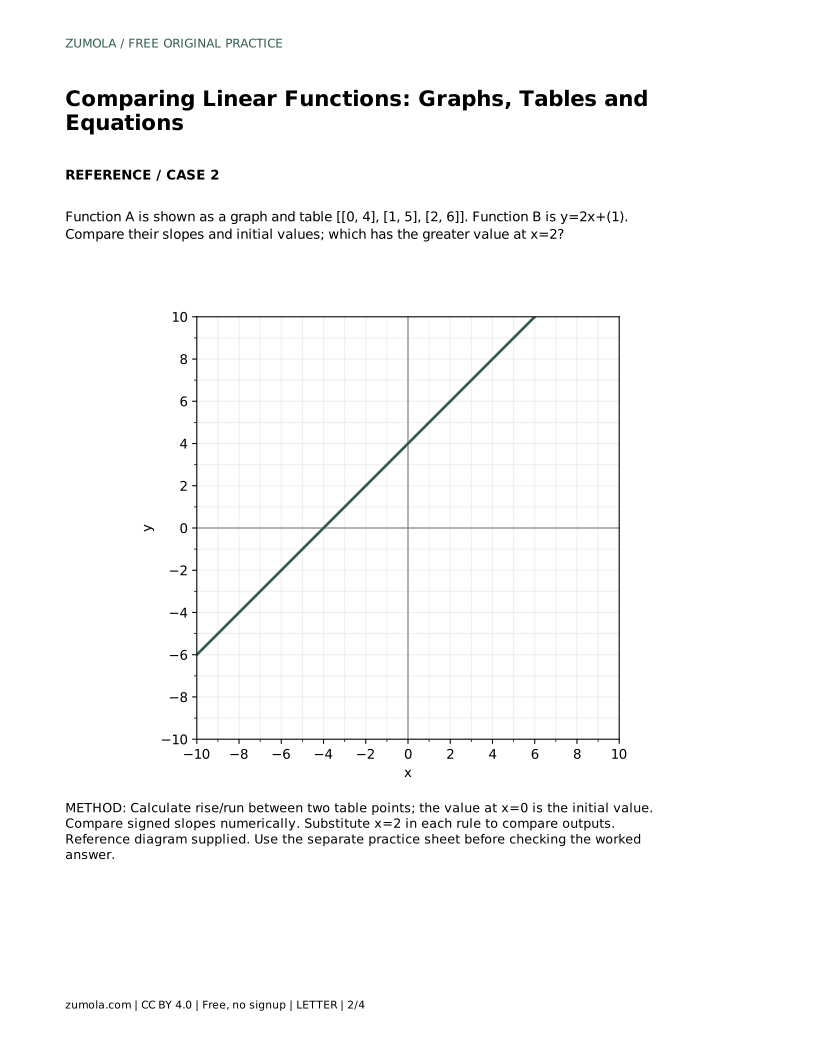
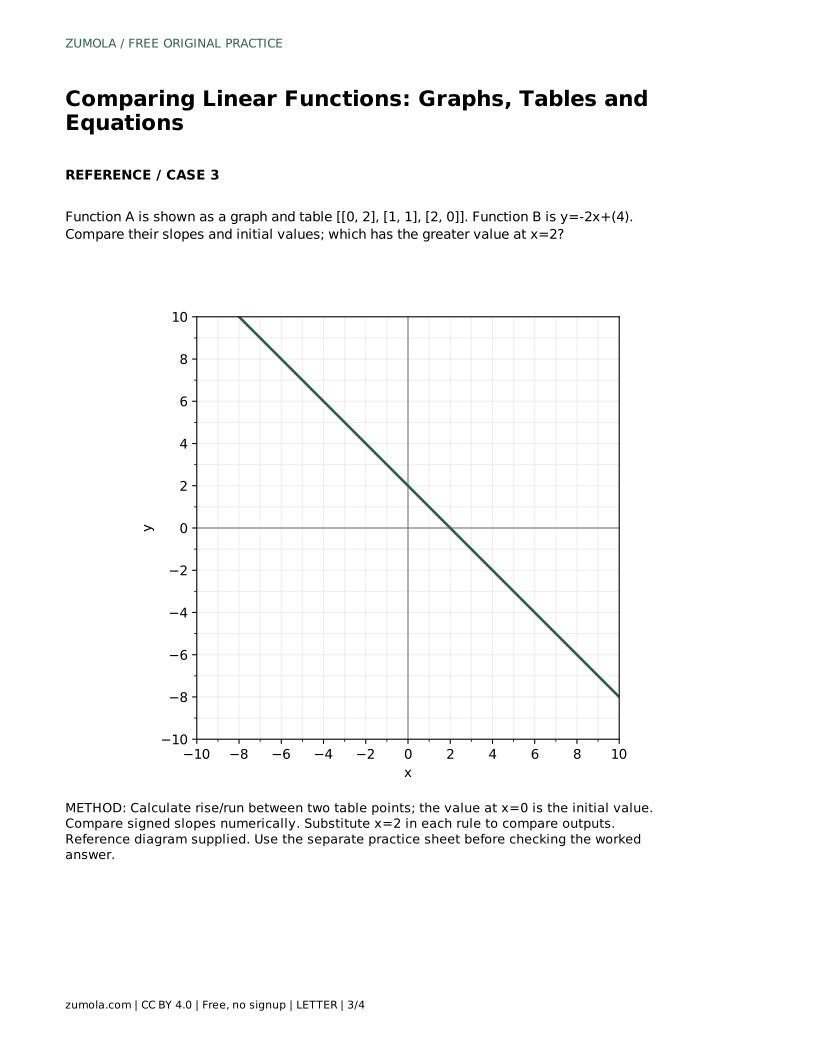
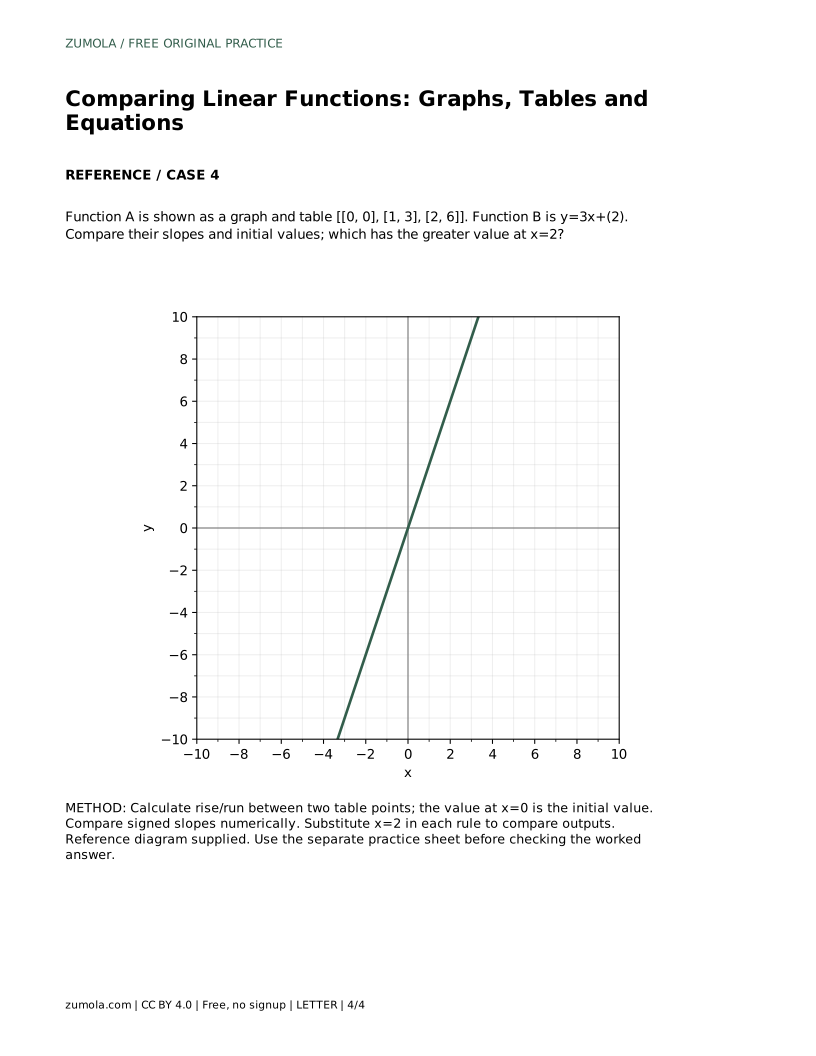
A4 · Download PDF
Free original resources
Learn to compare linear functions shown as graphs, tables or equations by reading slope and initial value, then checking which output is greater at a chosen x-value.
Four original cases, with reference diagrams, practice sheets and worked answers. Everything is free; no signup required.
LETTER · Download PDF
A4 · Download PDF
LETTER · Download PDF
A4 · Download PDF
LETTER · Download PDF
A4 · Download PDF
Use A4 or US Letter to match your printer. Graph coordinates determine the answers; these worksheets are not physical measuring rulers.

Linear functions can look different depending on whether they appear as a graph, a table or an equation, but they describe the same kind of relationship. Comparing them means finding two features: the slope, which tells how the output changes when x increases by 1, and the initial value, which is the output when x is 0. This page shows how to extract those features from each representation and use them to compare function values at a specific x.
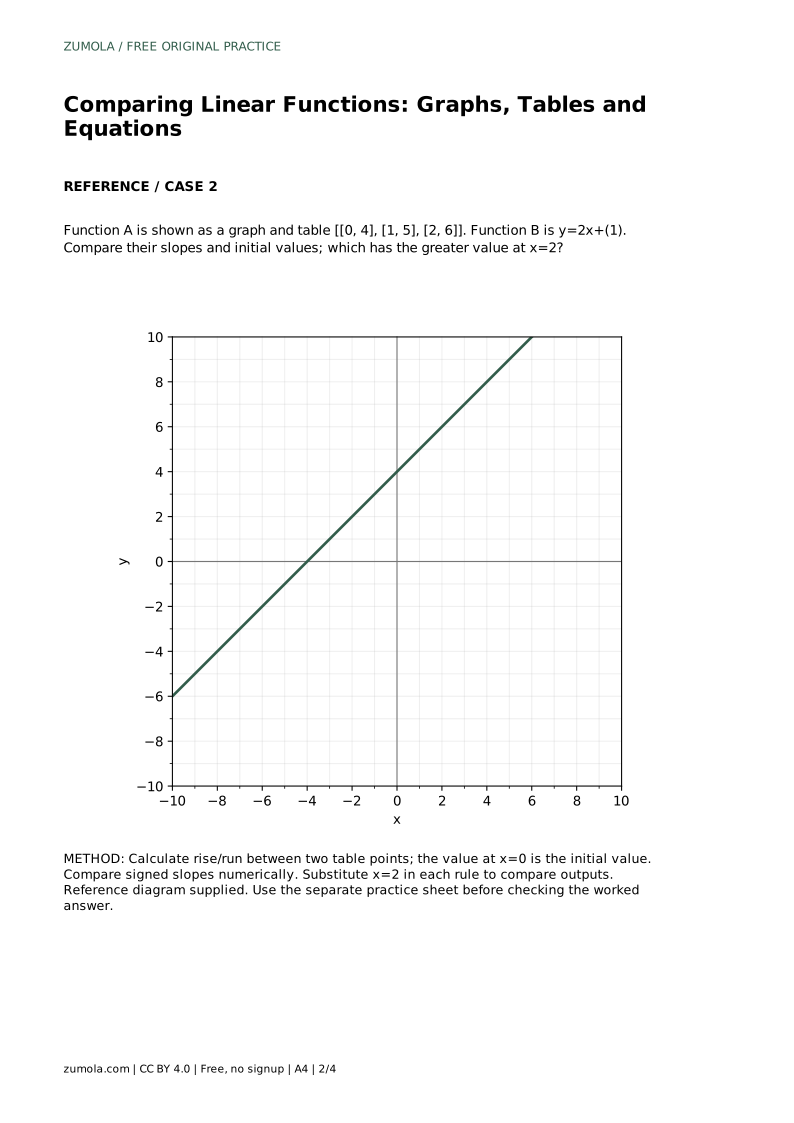
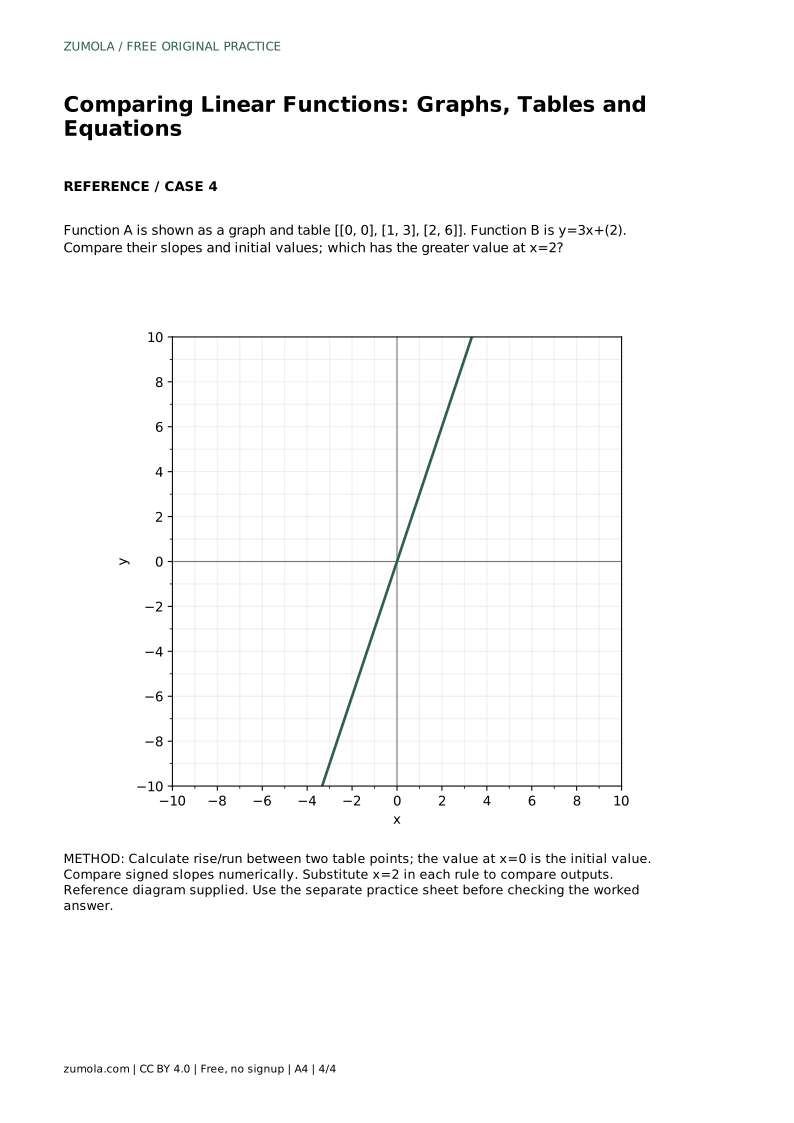
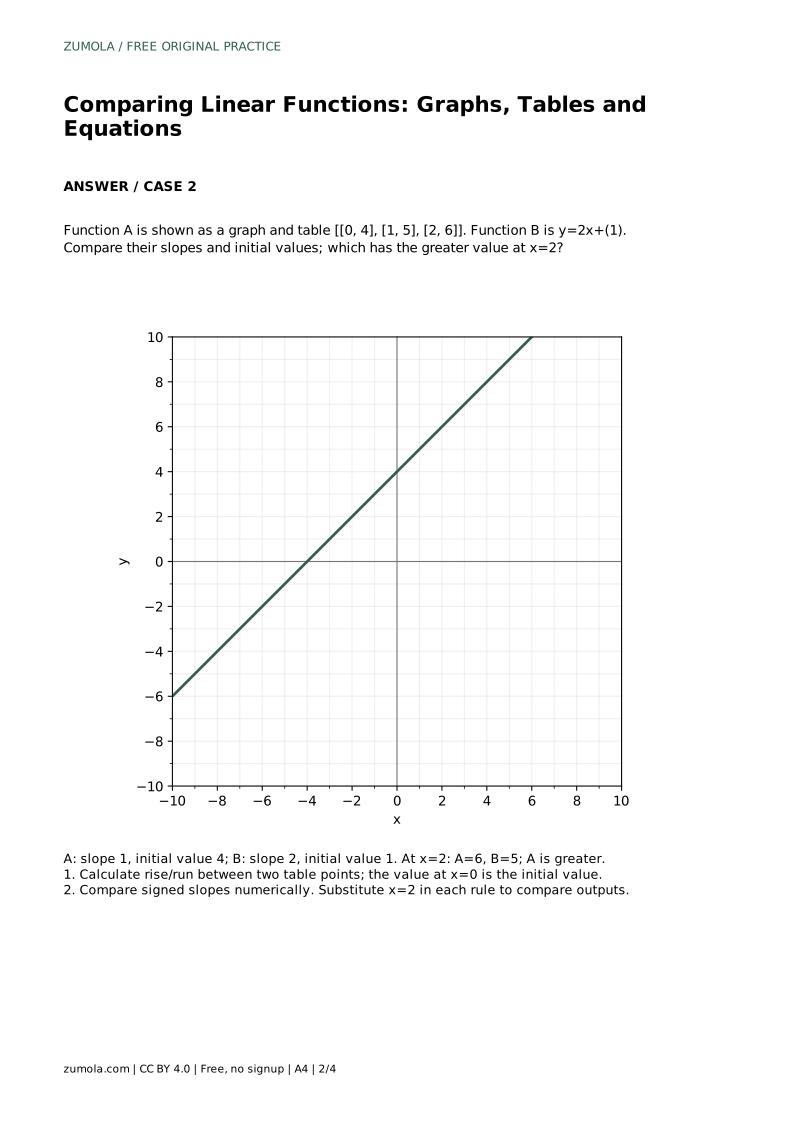
In an equation written as y = mx + b, the coefficient m is the slope and b is the initial value. A table often includes the row where x is 0, which gives the initial value directly; the slope is the change in y divided by the change in x between two rows. On a graph, the initial value is the y-intercept, where the line crosses the vertical axis, and the slope is rise divided by run between two clear points.
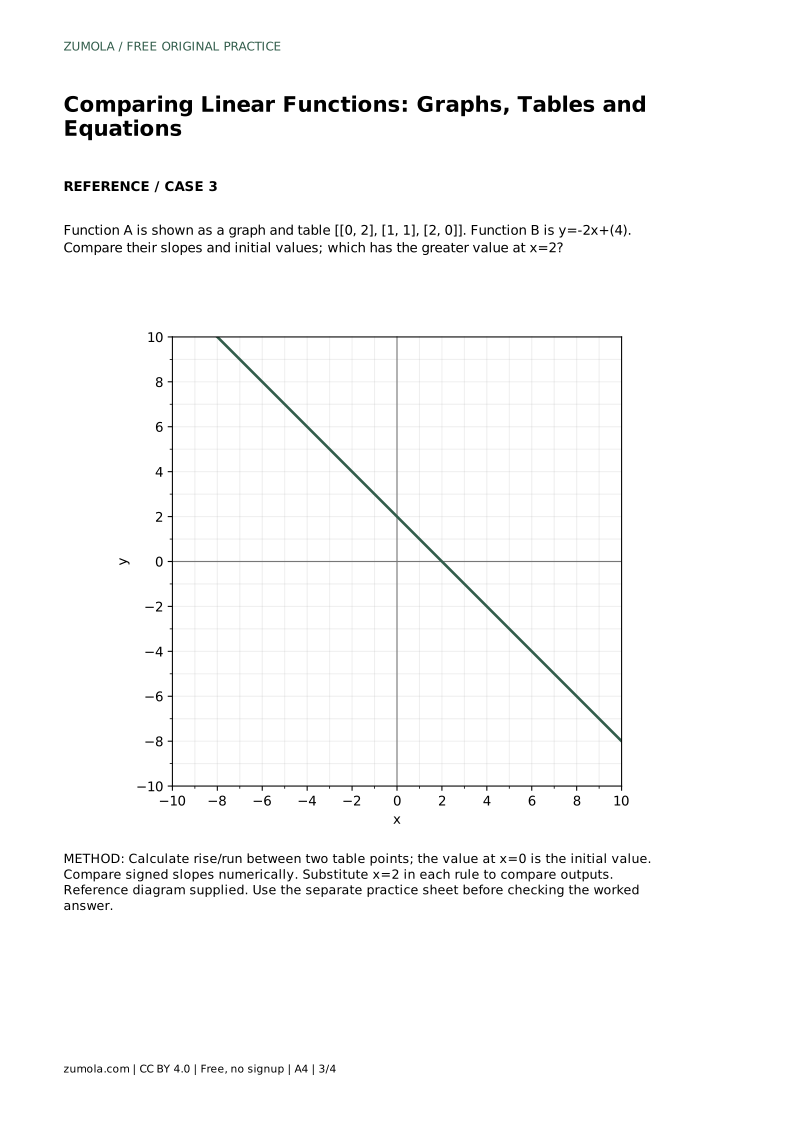
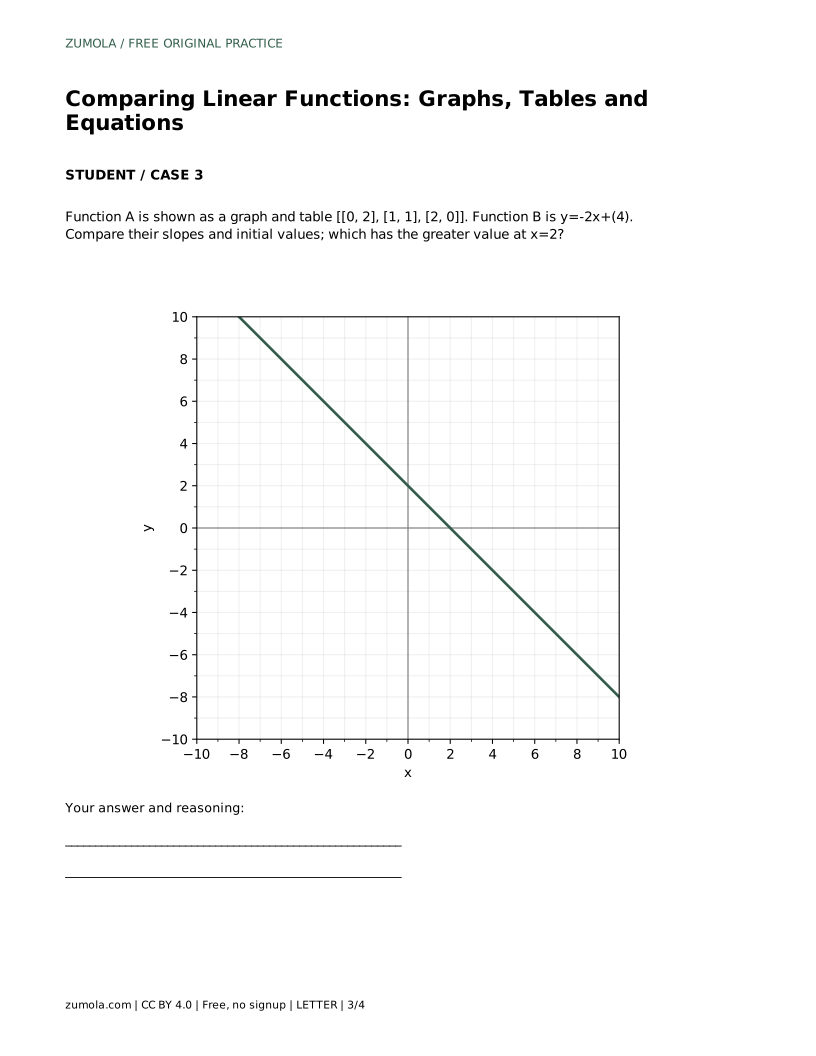
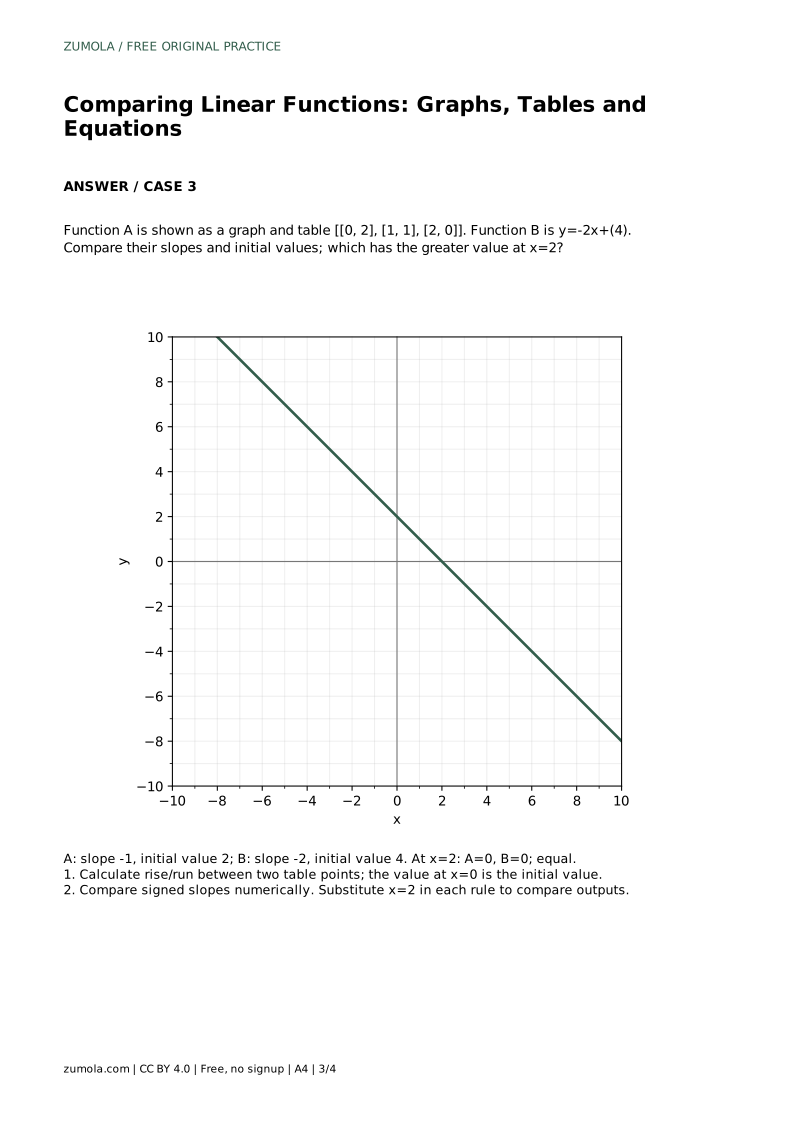
Keep signs attached to both numbers. A slope of -2 means the output falls by 2 each time x increases by 1. An initial value of -3 means the line crosses the y-axis below zero. Comparing signed values numerically is different from comparing their absolute sizes: -1 is greater than -2, even though 2 is farther from zero.
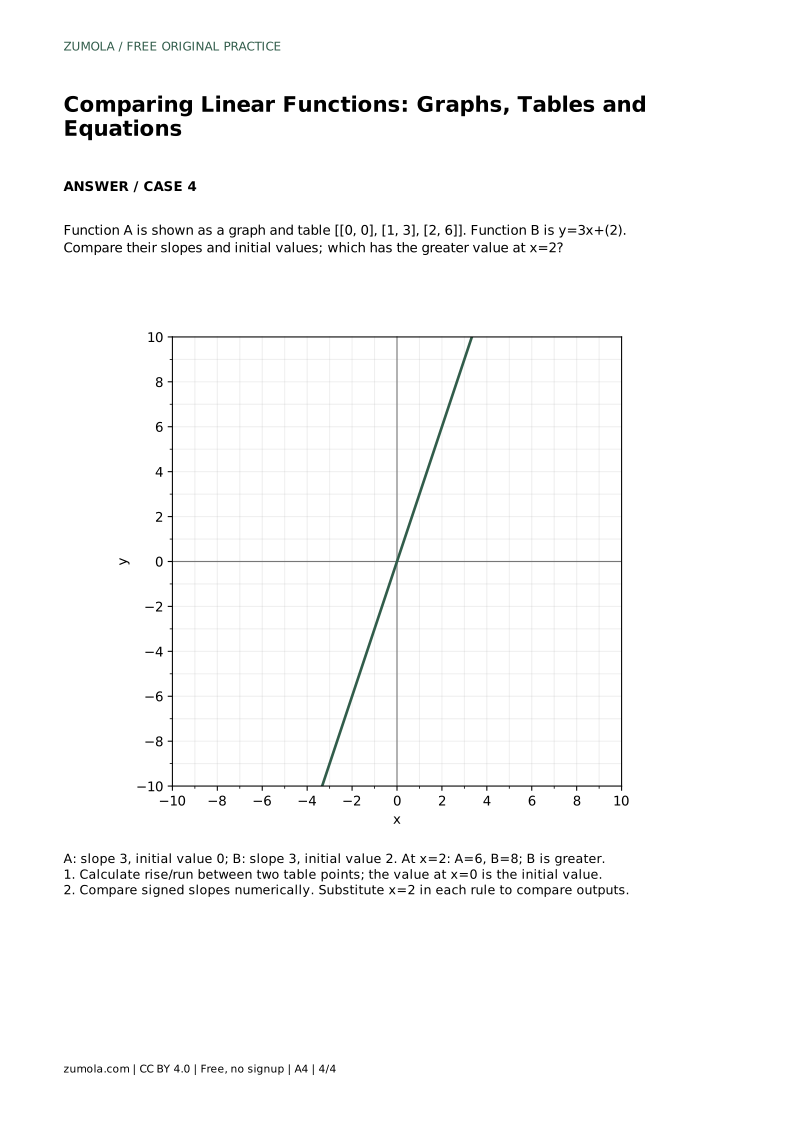
Slope and initial value describe a whole line, but a question may ask which function has the greater value at one particular x. Substitute that x into each rule, or read the corresponding y-value from the table or graph. Do not assume the function with the larger slope is always greater at that point; lines can cross.
A useful check is to compare at x = 0 first, where the initial values decide, then compare at the requested x. If the two results are equal, say so rather than forcing a winner. Equality is a valid comparison outcome.
A short comparison table prevents mixing up features from different functions. Label one column for each function and rows for slope, initial value and value at the requested x. Fill each cell from the original representation, then compare row by row.
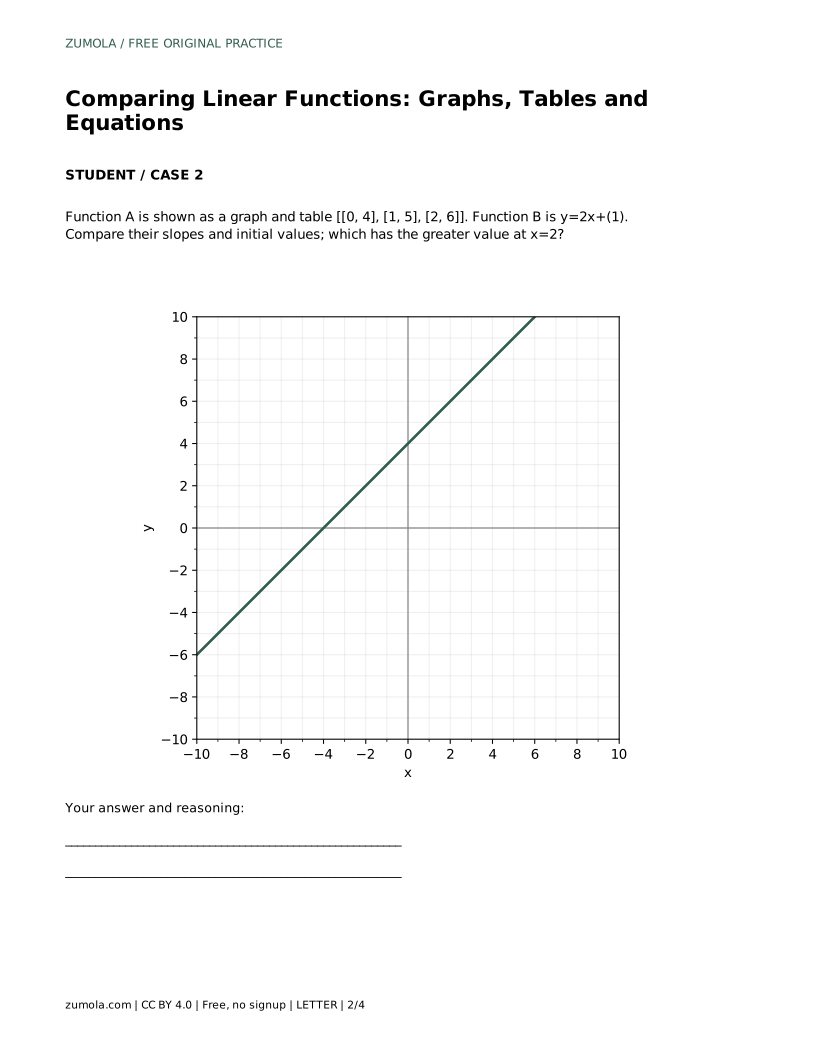
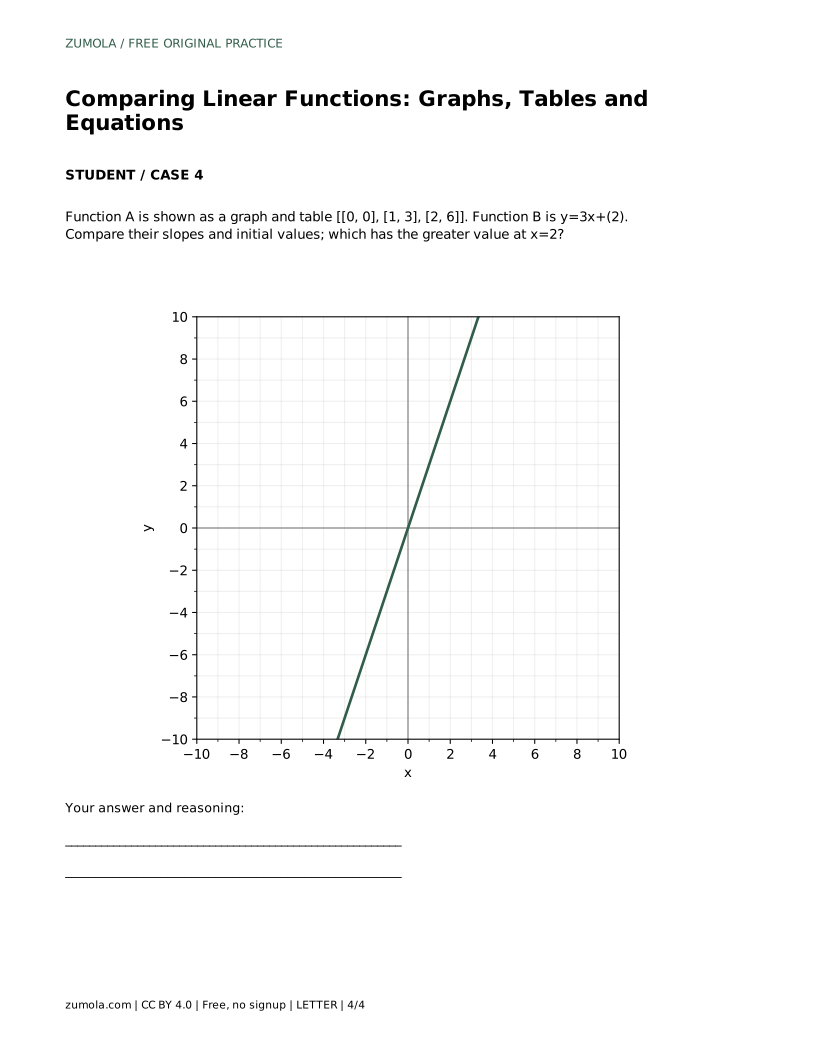
When a graph is involved, choose two points that lie exactly on grid intersections so the rise and run are whole numbers. If the table already gives two points, use those instead of estimating from the picture. State the points you used so the reasoning can be checked.
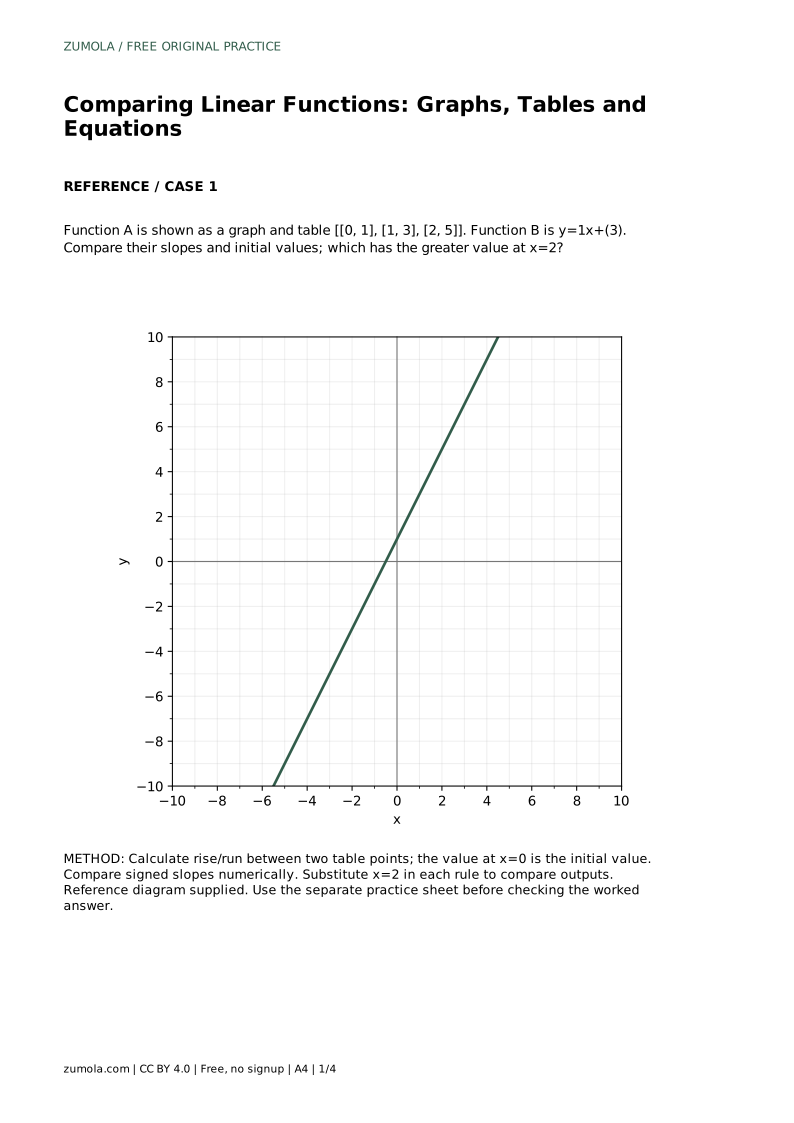
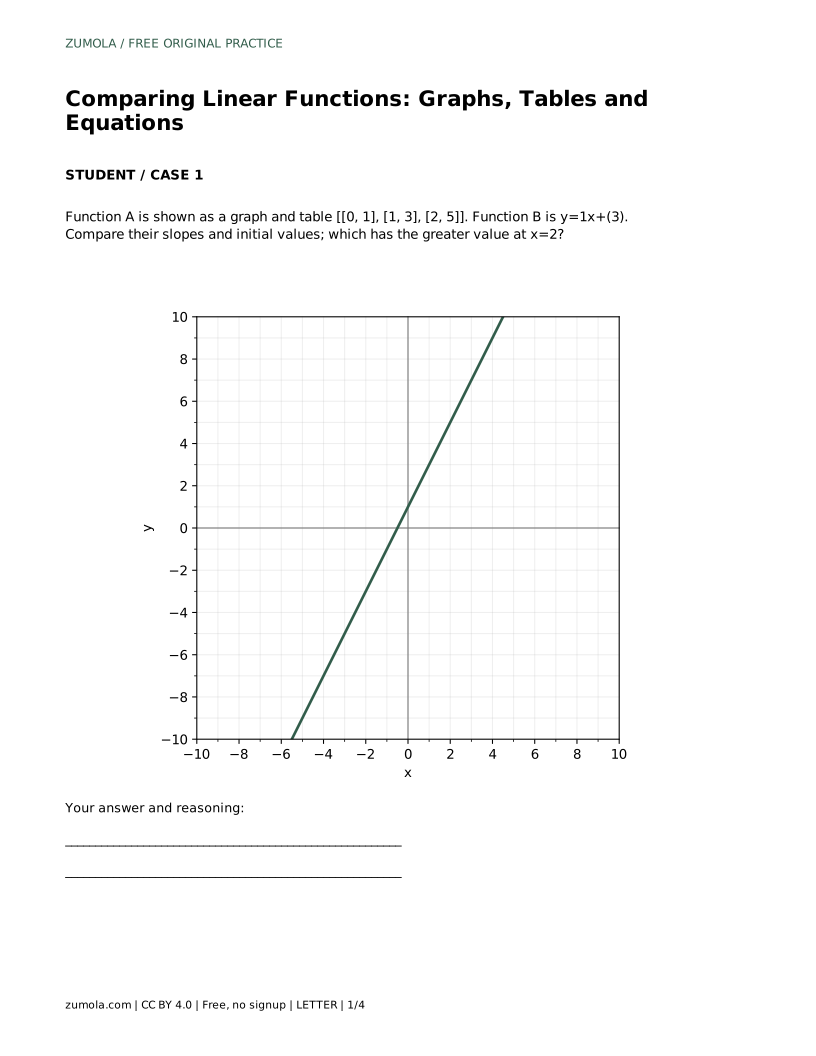
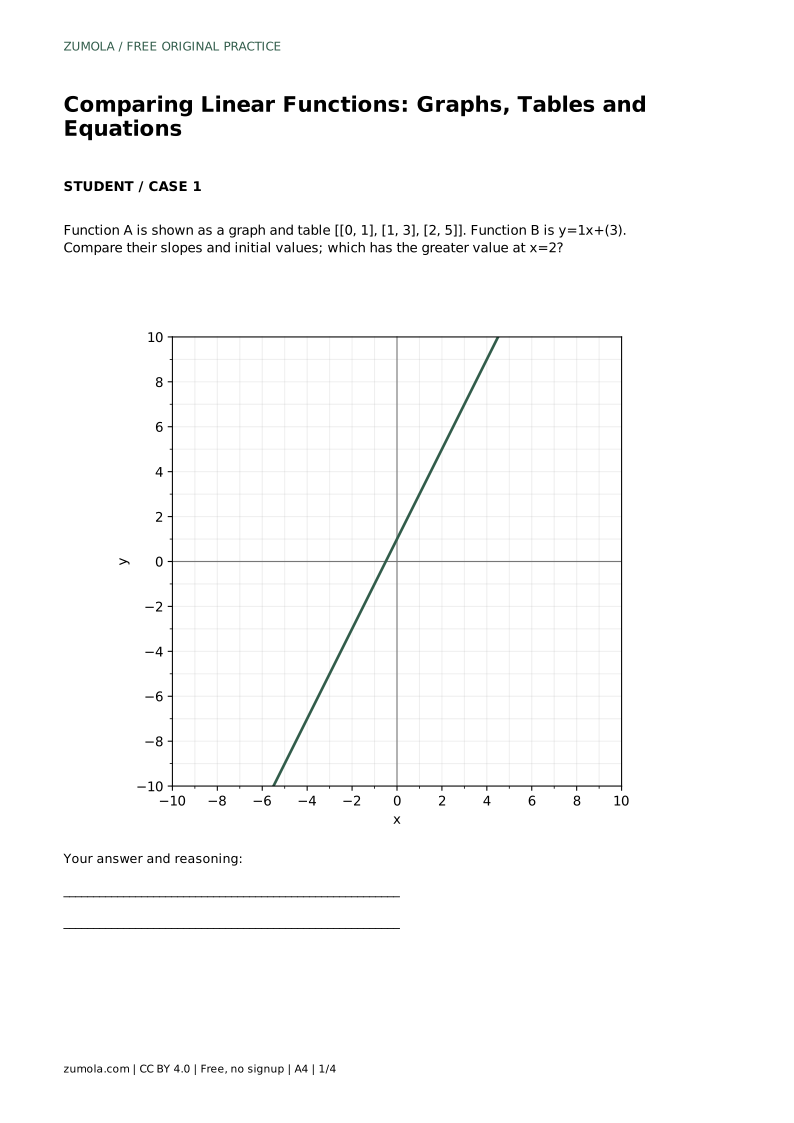
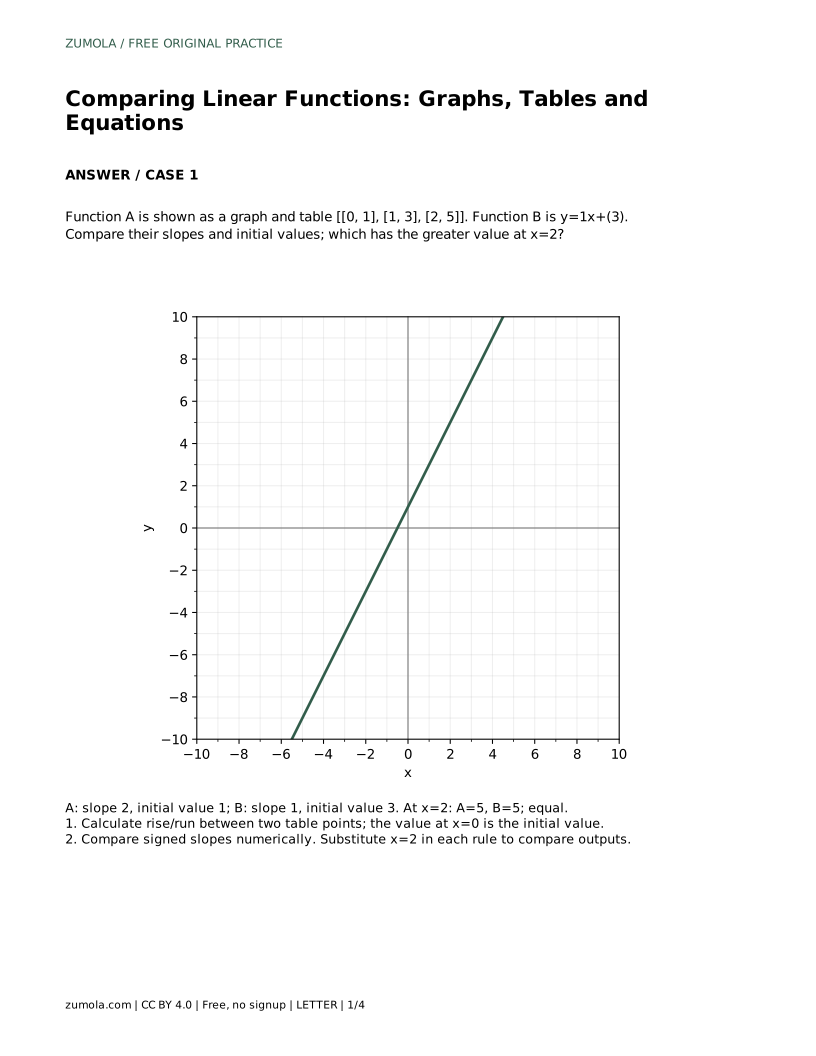
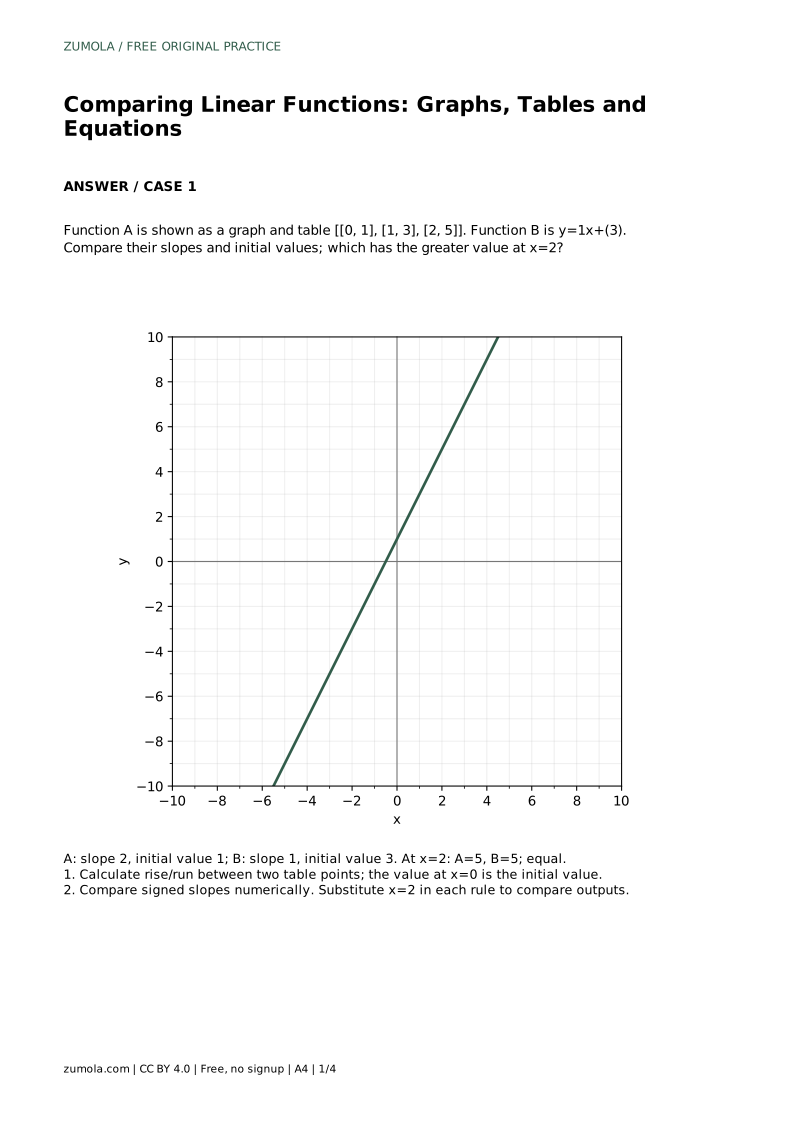
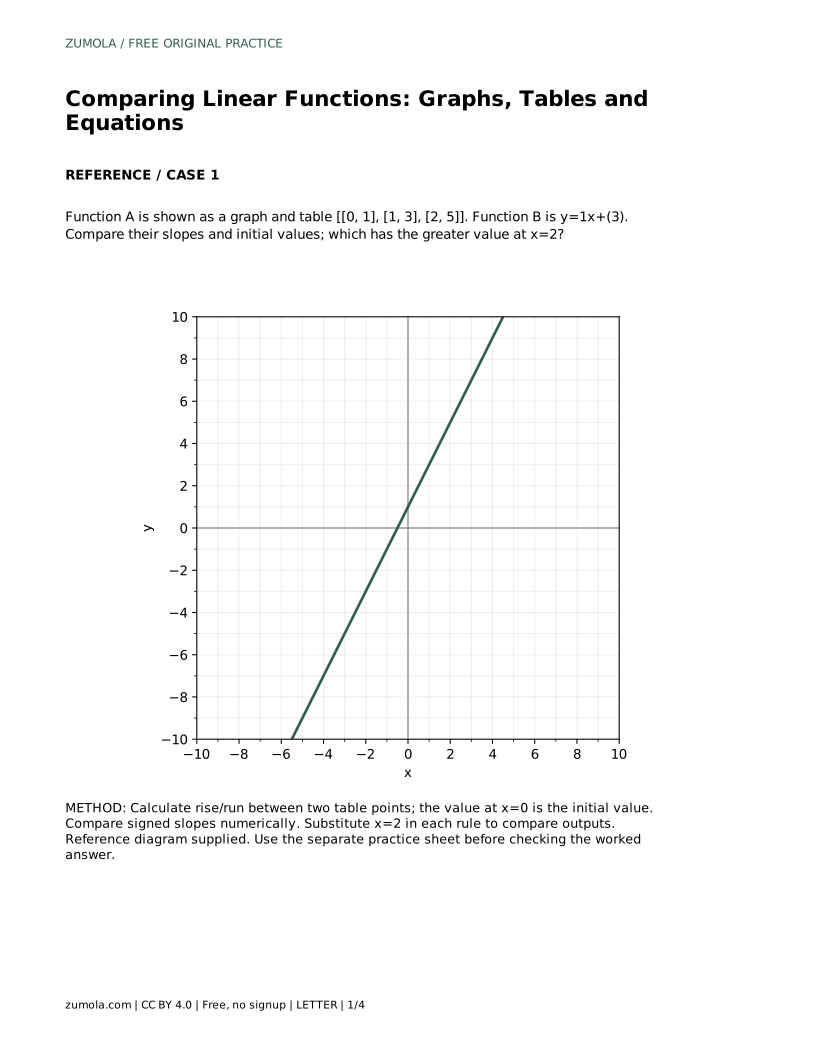
Function A is shown as a table with points (0, 1), (1, 3) and (2, 5). Function B is y = 1x + 3. Compare their slopes and initial values, then decide which has the greater value at x = 2.
For Function A, the y-value at x = 0 is 1, so the initial value is 1. Between (0, 1) and (1, 3), y changes by 2 while x changes by 1, so the slope is 2. Function B has slope 1 and initial value 3. At x = 2, Function A gives 2(2) + 1 = 5, and Function B gives 1(2) + 3 = 5. The outputs are equal at x = 2, even though A has the larger slope and B has the larger initial value.
Extend the pattern by subtracting the slope repeatedly, or use two points to find the slope and then work backward to the y-value at x = 0.
Yes. If the outputs are equal at that x, the lines meet there. Report equality rather than choosing one as greater.
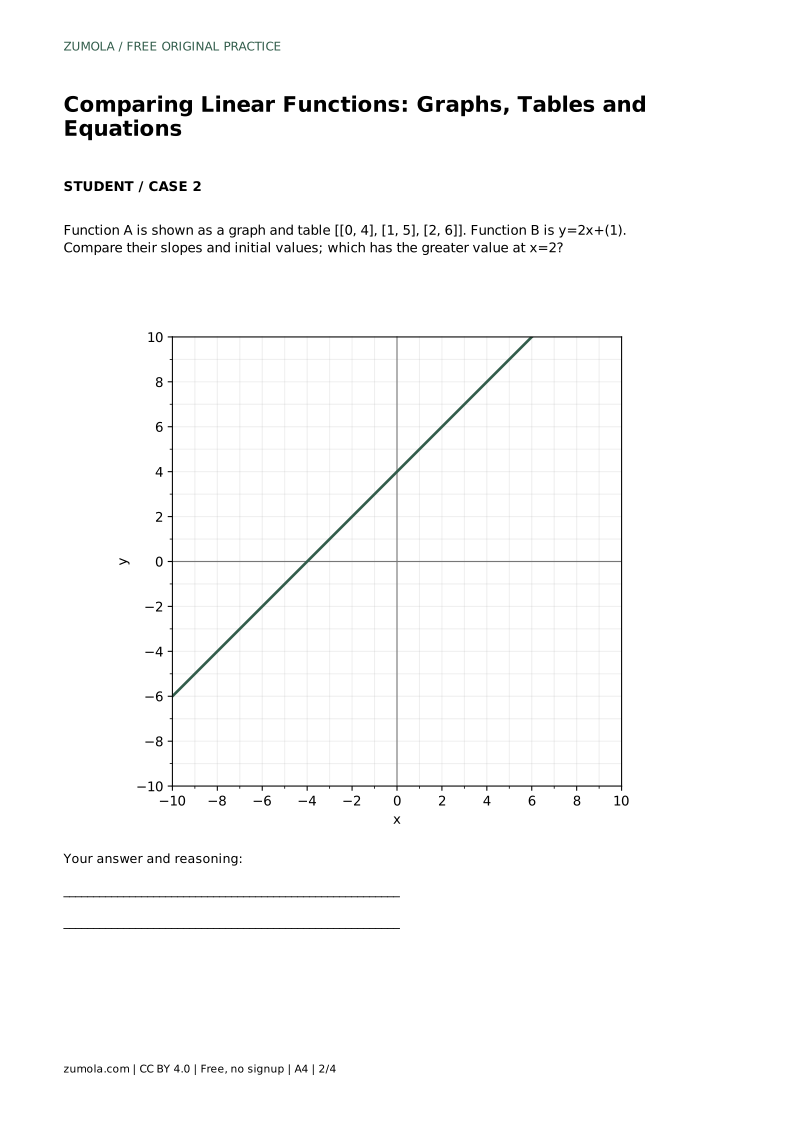
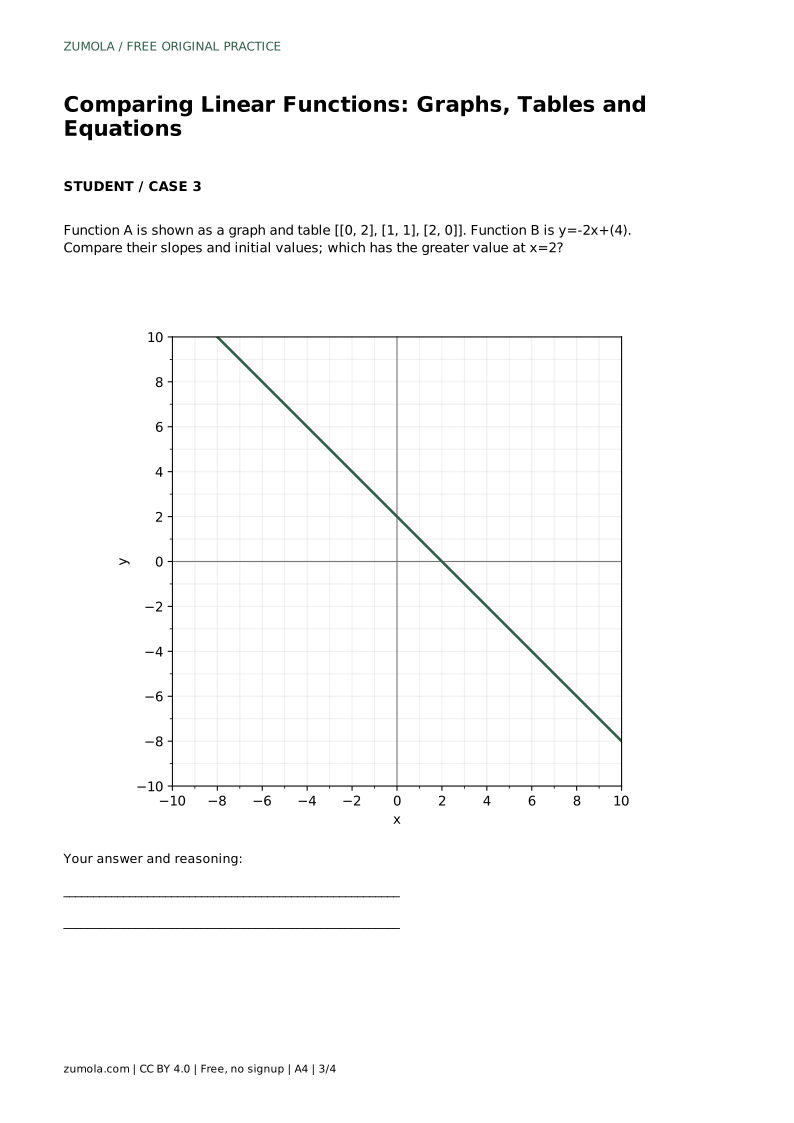
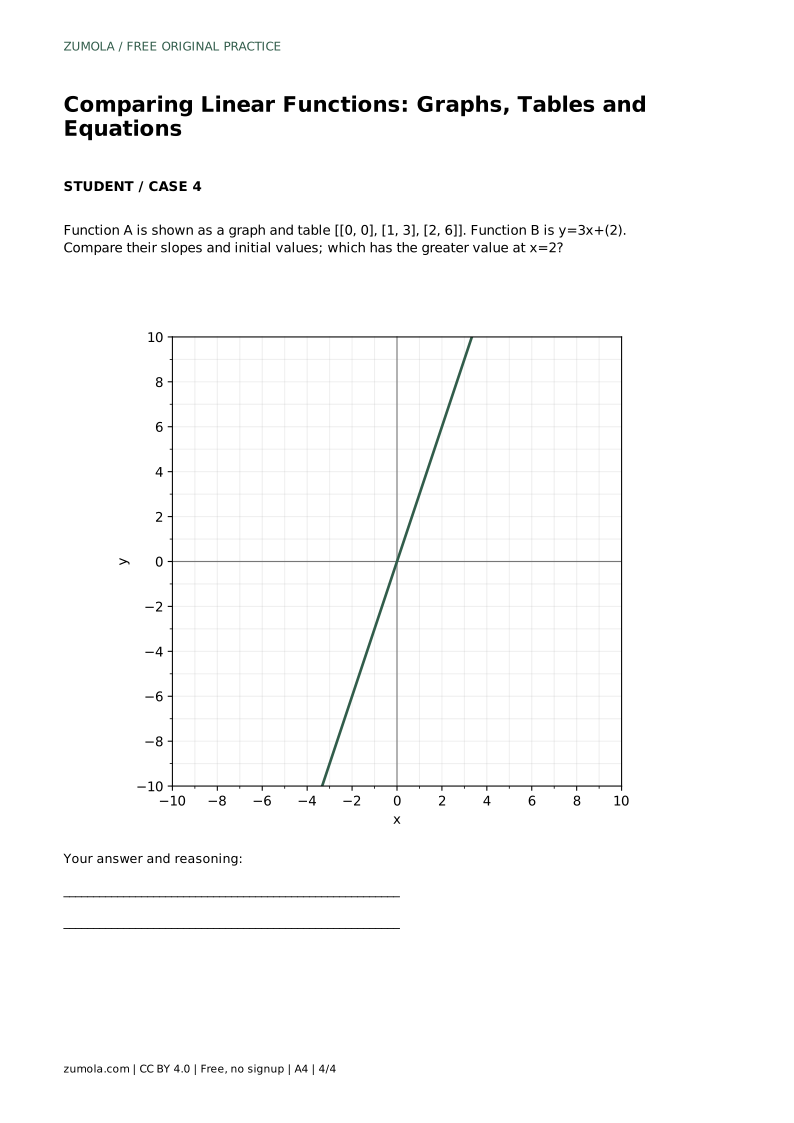
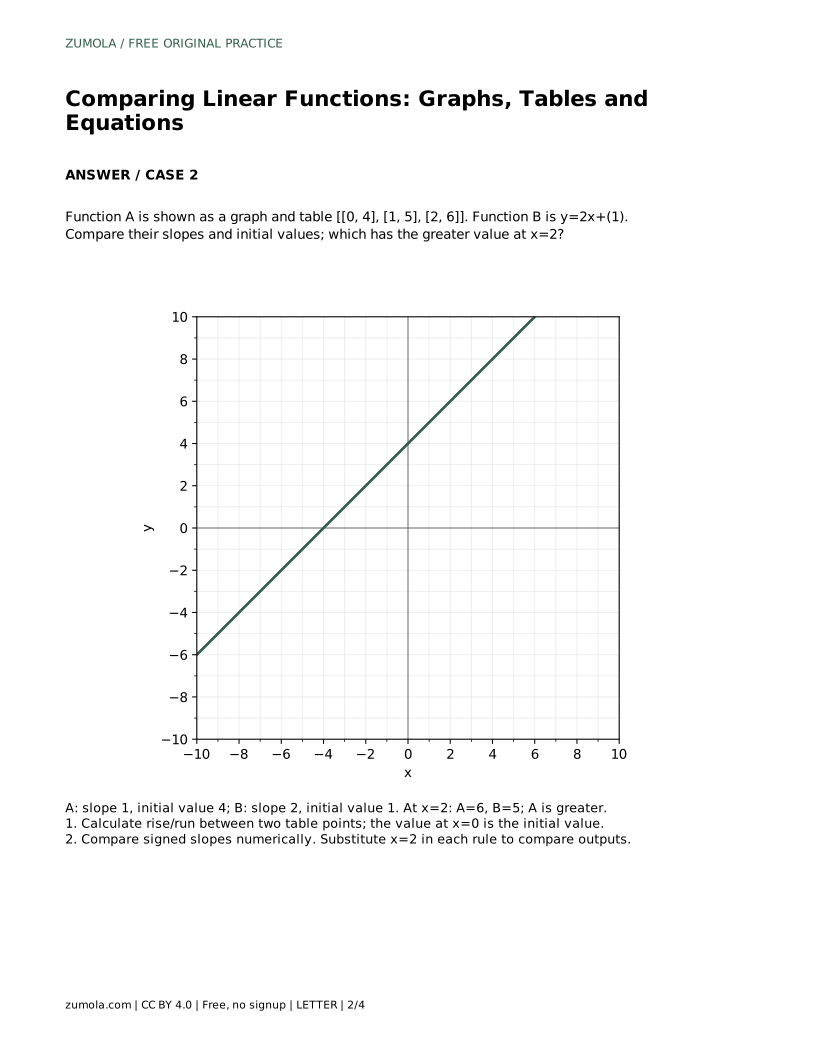
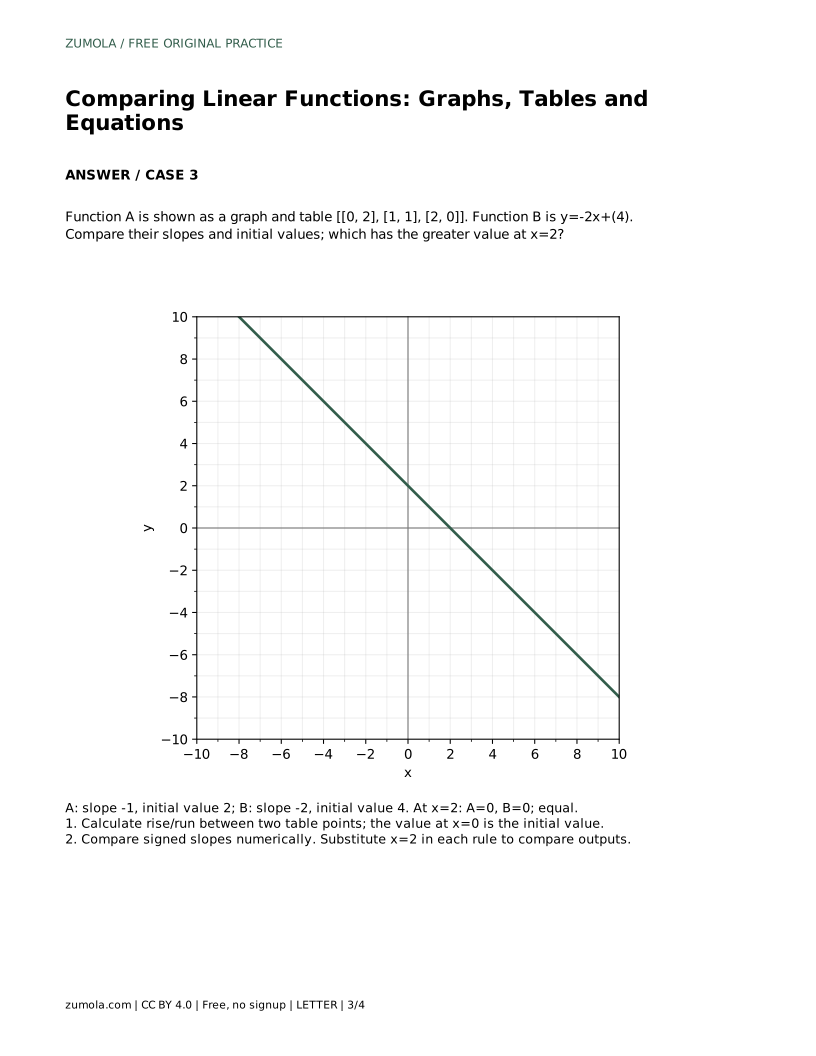
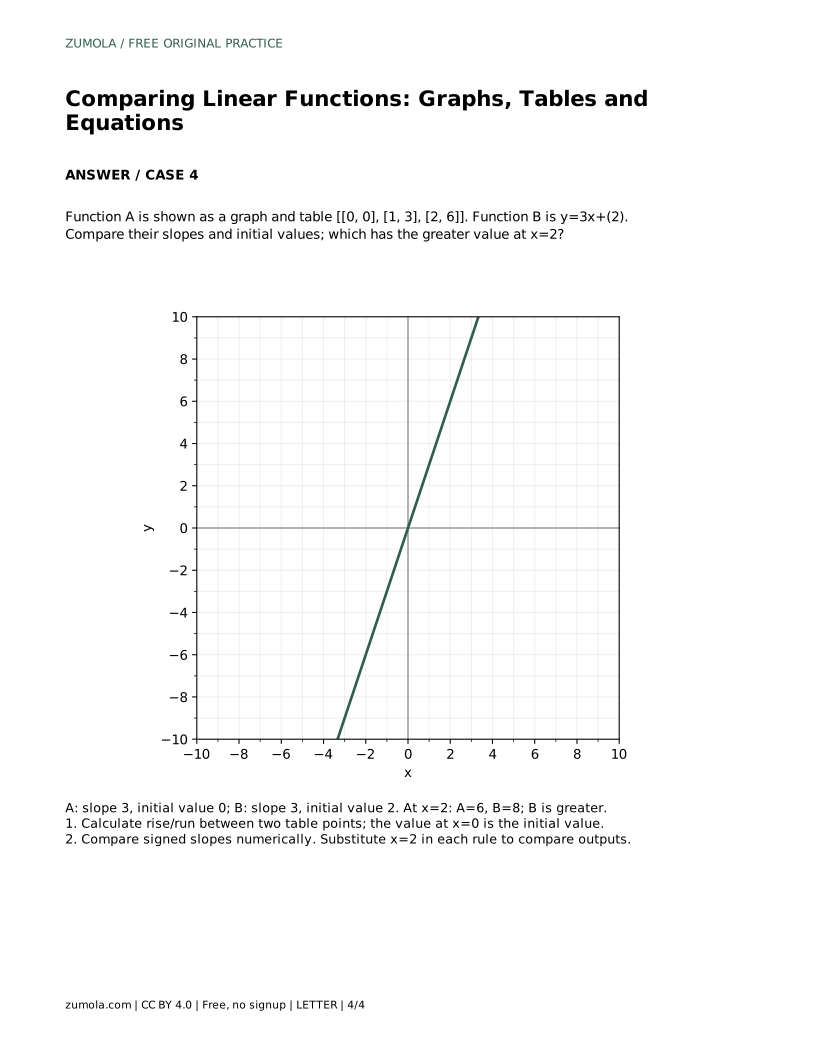
Use the labeled points and grid intersections to read slope and intercept. If the graph is unclear, rely on the table or equation for exact values.
All math worksheets · Free coordinate paper
Original resources · CC BY 4.0 · Free for personal and classroom use with attribution.