Reference diagrams
LETTER · Download PDF
A4 · Download PDF
Free original resources
Learn to decide whether a plotted relation is a function of x by checking x-values and applying the vertical line test to points and curves.
Four original cases, with reference diagrams, practice sheets and worked answers. Everything is free; no signup required.
LETTER · Download PDF
A4 · Download PDF
LETTER · Download PDF
A4 · Download PDF
LETTER · Download PDF
A4 · Download PDF
Use A4 or US Letter to match your printer. Graph coordinates determine the answers; these worksheets are not physical measuring rulers.
A relation pairs inputs with outputs. When x is the input, the relation is a function only if every x-value is paired with exactly one y-value. Graphs make this visible: any vertical line can meet the graph at most once. This page explains how to read that condition from plotted points and curves, how repeated outputs differ from repeated inputs, and how to state a conclusion precisely.
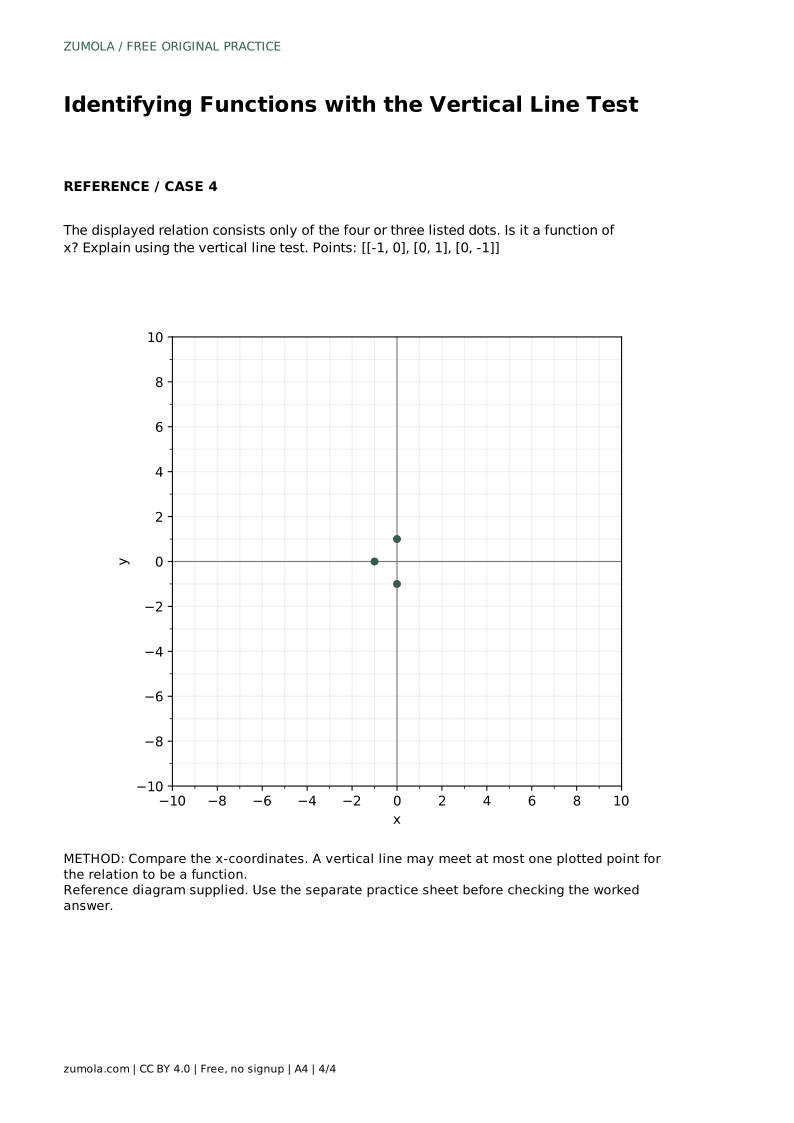
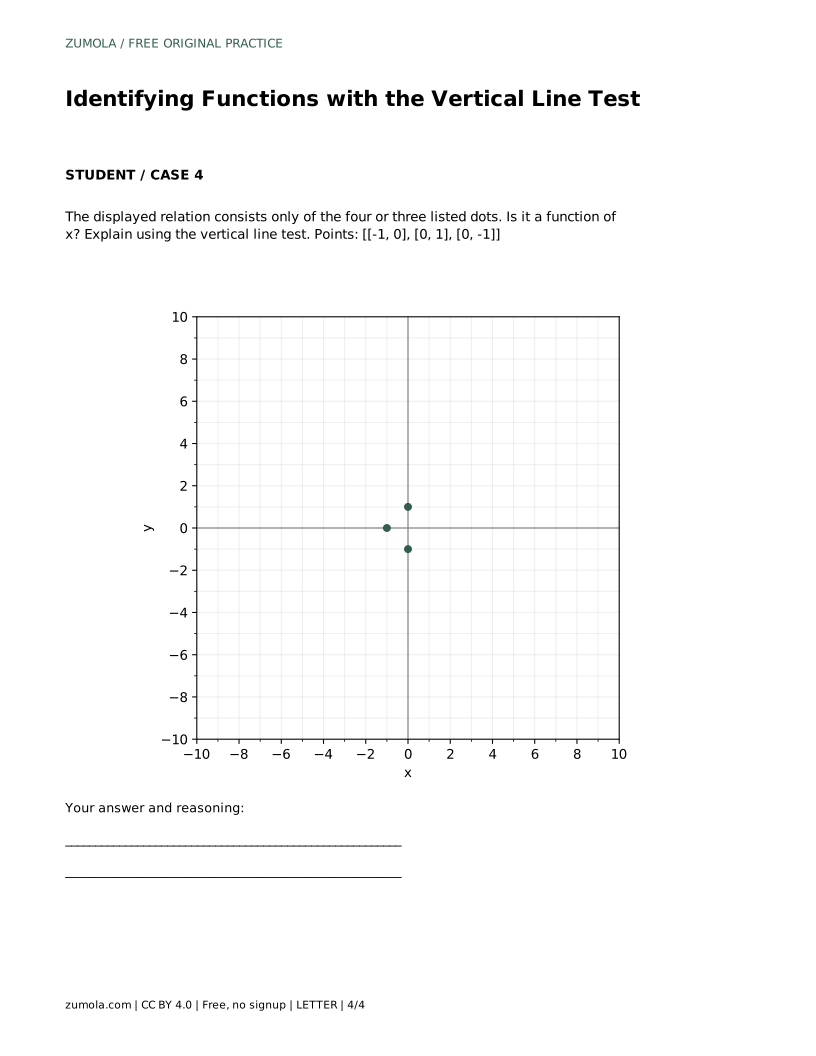
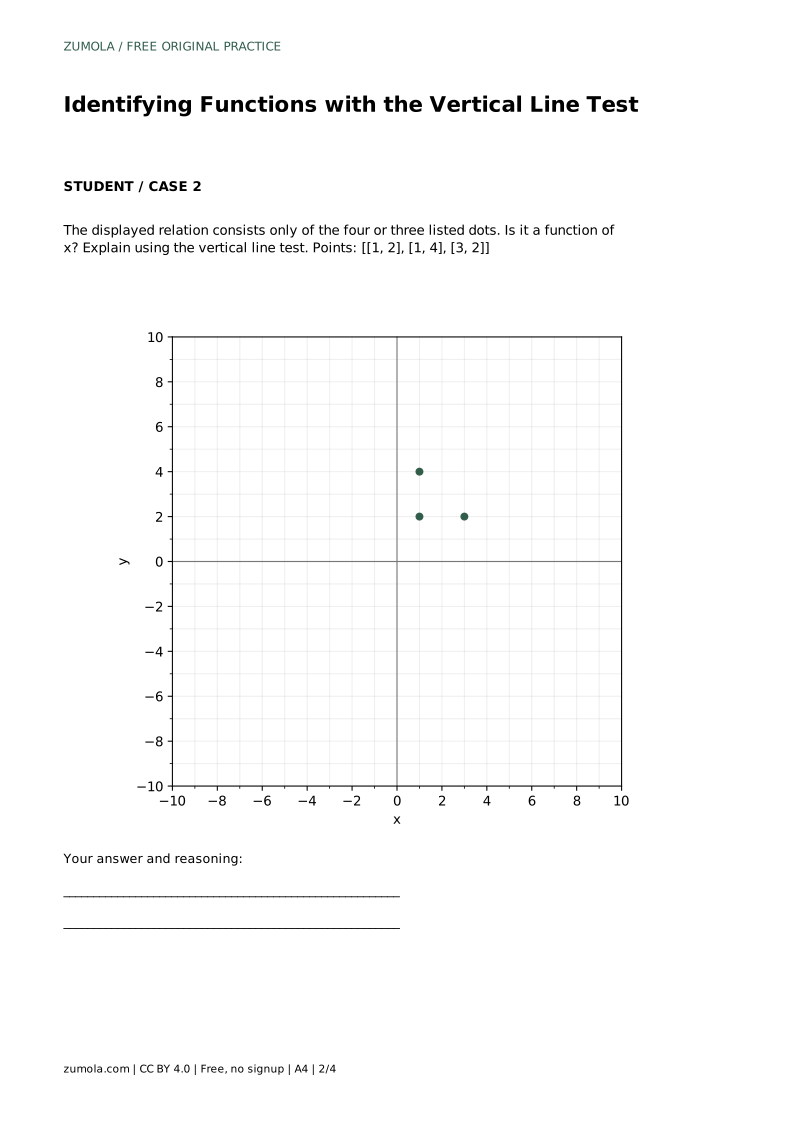
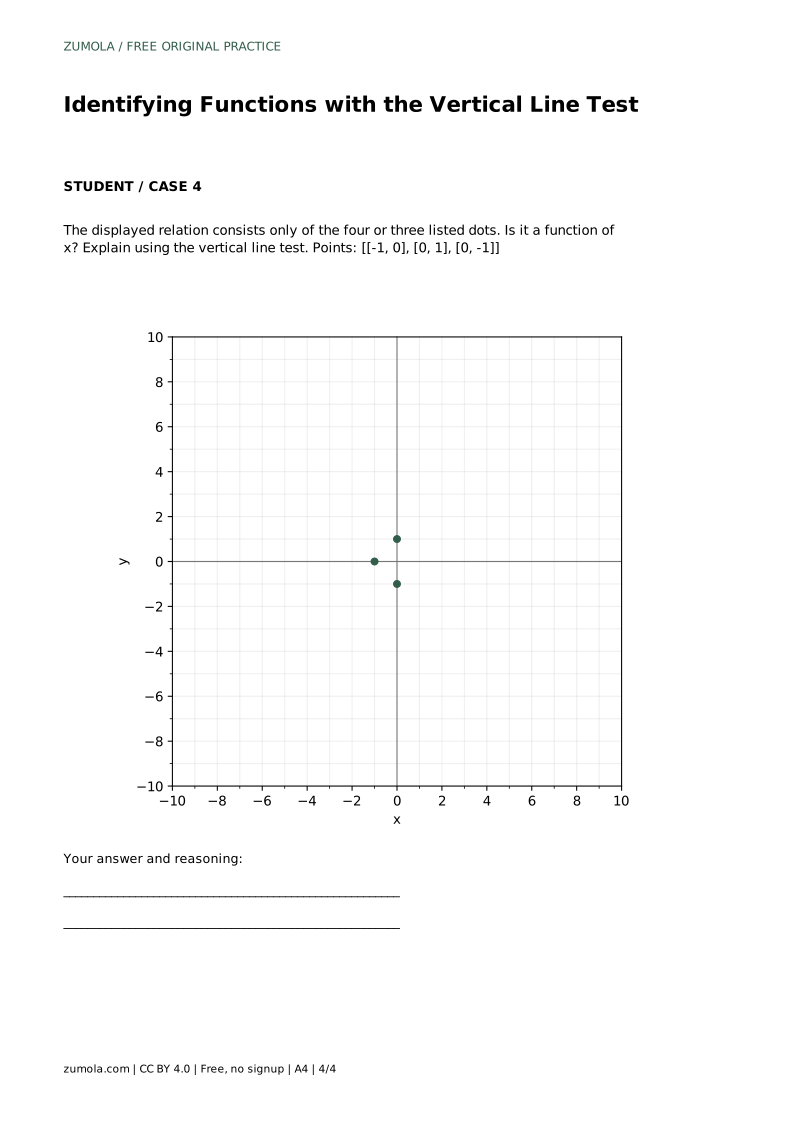
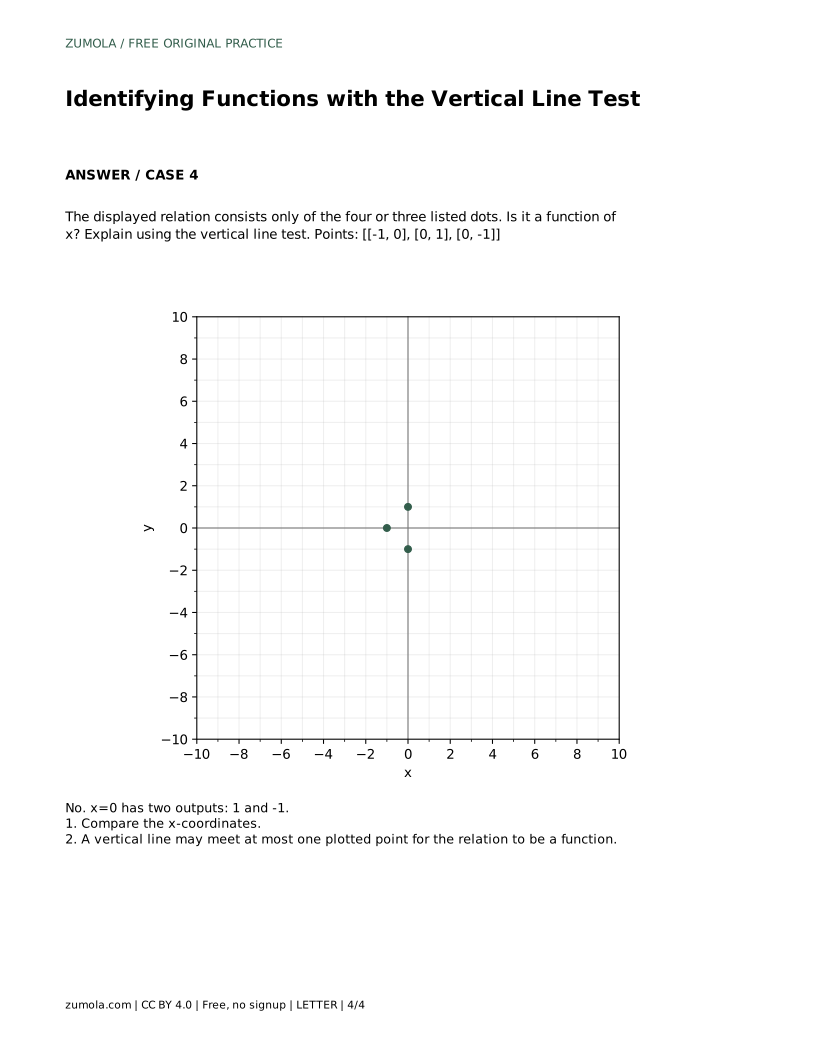
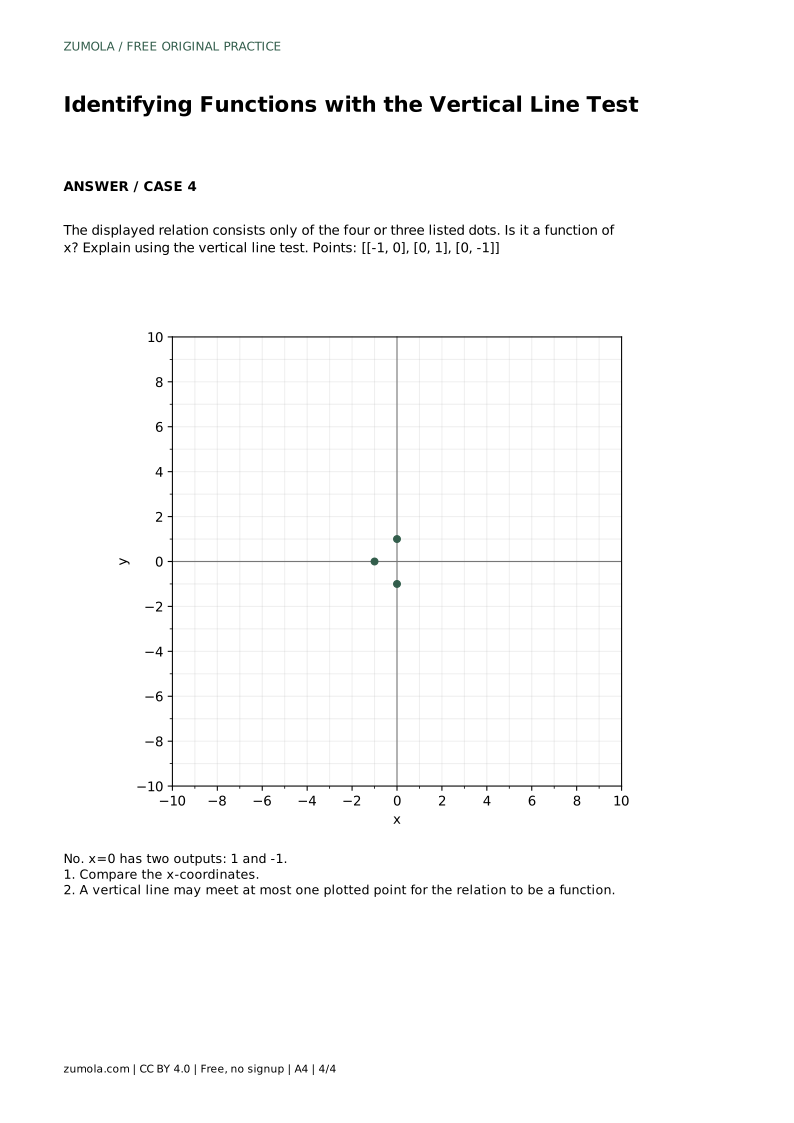
Treat the horizontal axis as the input x and the vertical axis as the output y. A vertical line holds x fixed while y varies. If one vertical line touches two or more points of the relation, then that single x-value has more than one output, so the relation is not a function of x.
The test is a visual form of comparing x-coordinates. For a finite set of plotted dots, list the x-values and check for repeats. For a curve, imagine sliding a vertical line across the graph; if it ever meets two separate pieces at the same x, the relation fails. A vertical line meeting one point, or none, is acceptable.
Passing the test does not require different x-values to have different y-values. Several inputs may share one output. What matters is that no input has two outputs.
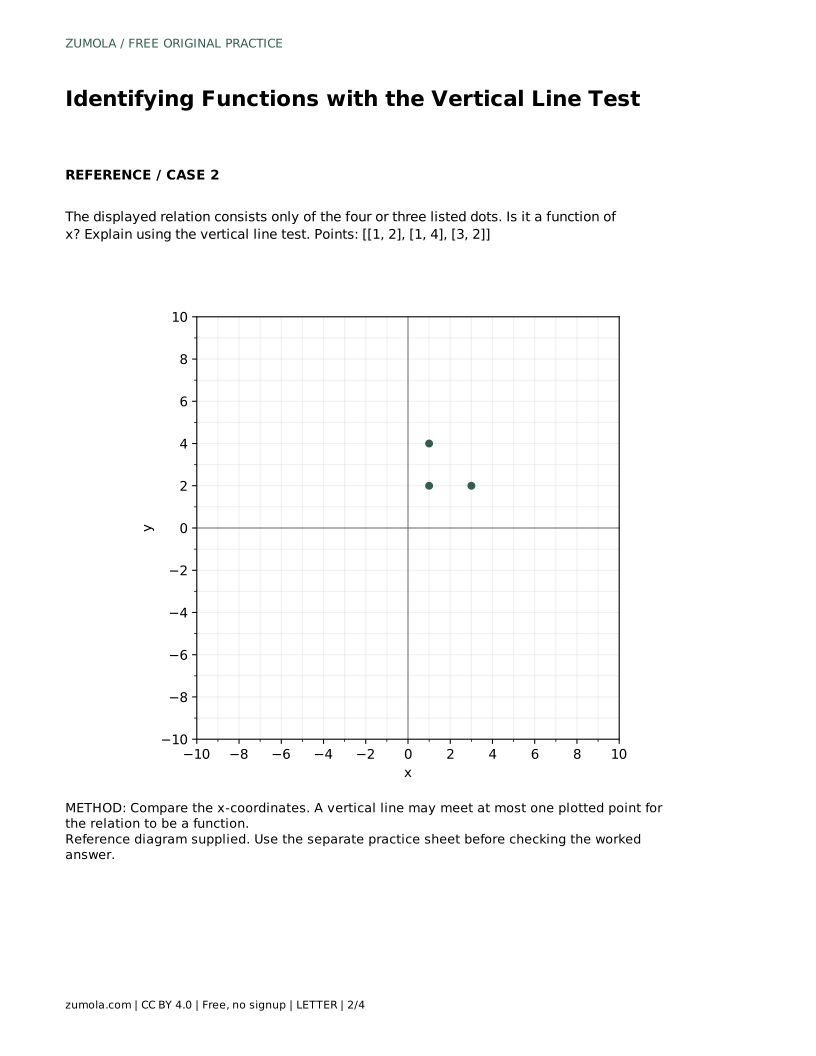
When a relation is given only as a list of dots, the graph consists of exactly those dots, not an implied curve through them. Check each x-coordinate. A repeated x with different y-values is an immediate failure. A repeated x with the same y-value would describe the same point listed twice, not two outputs.
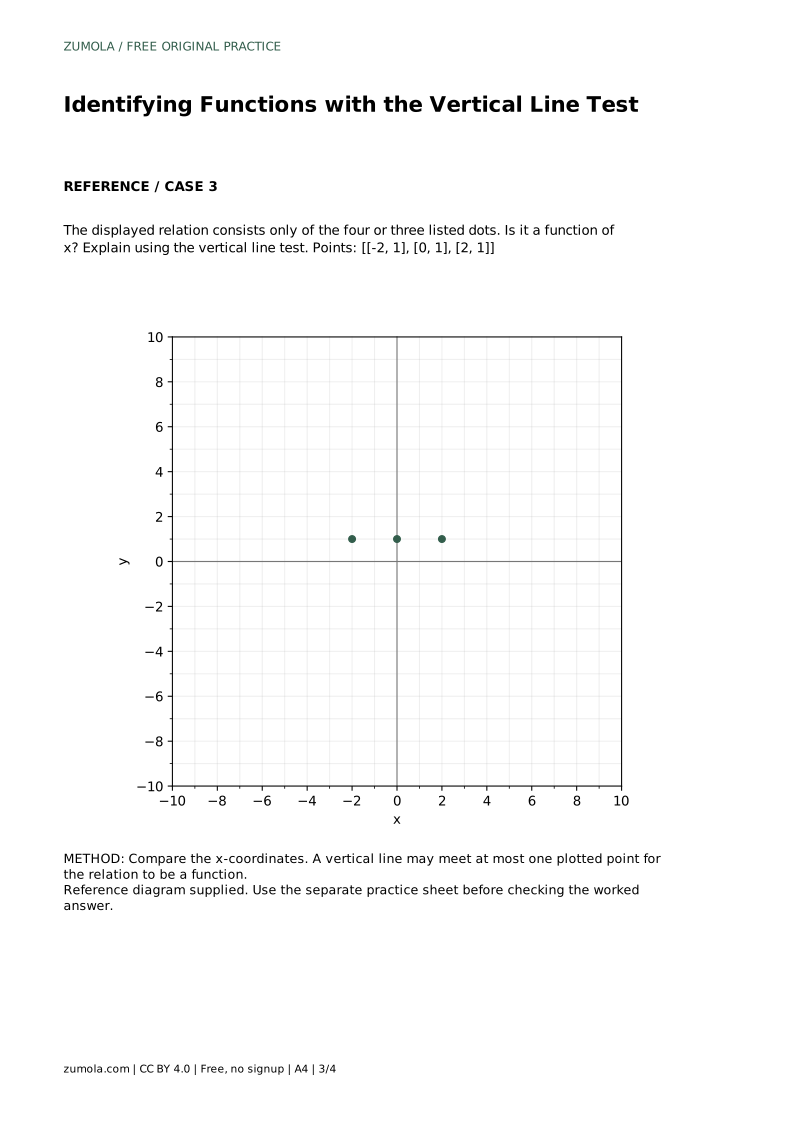
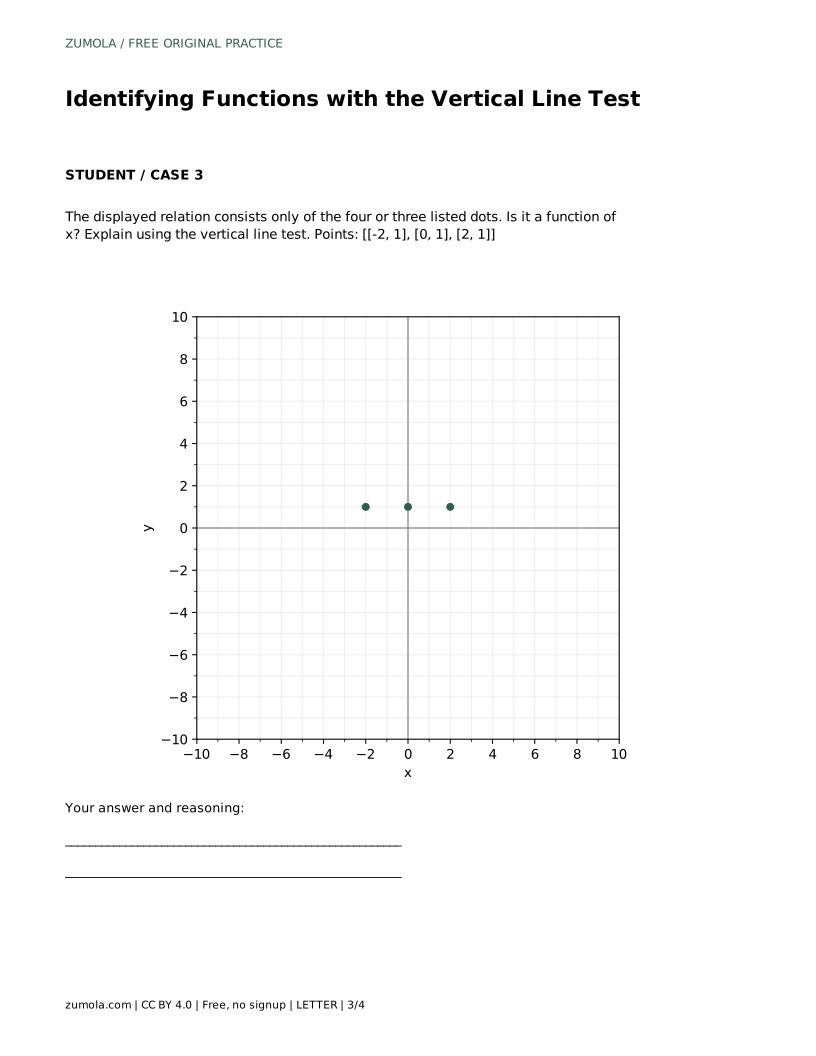
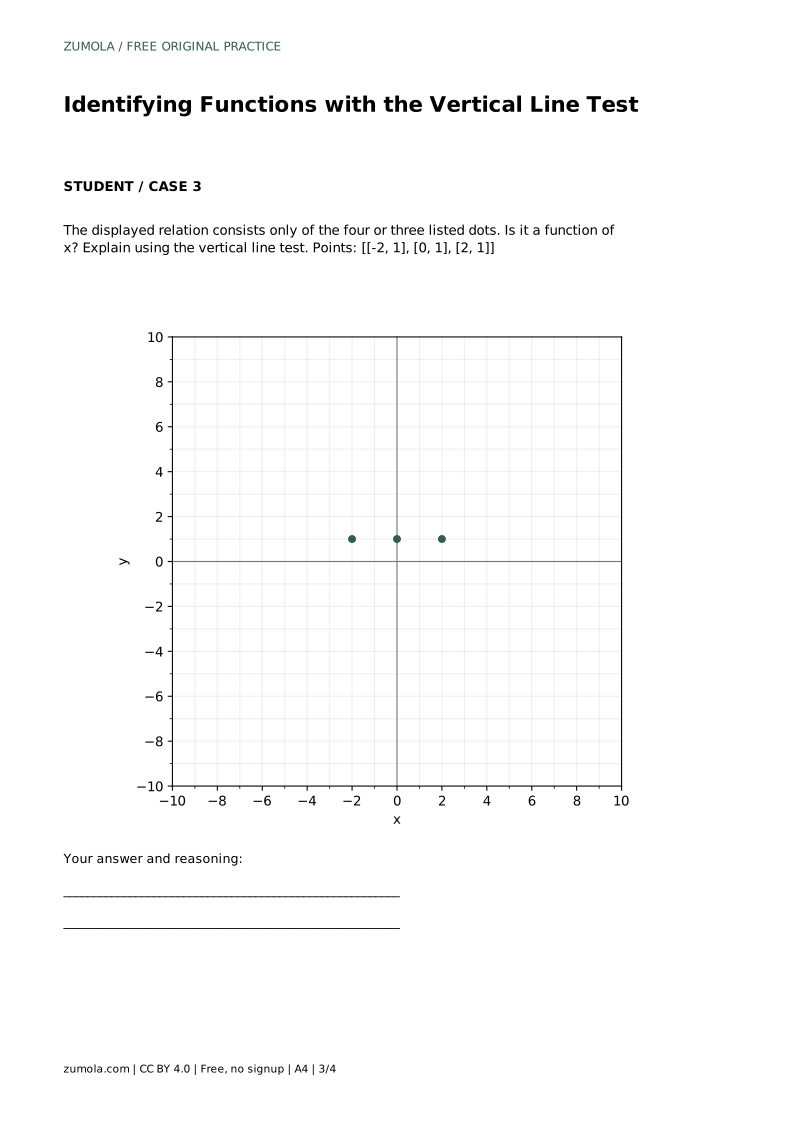
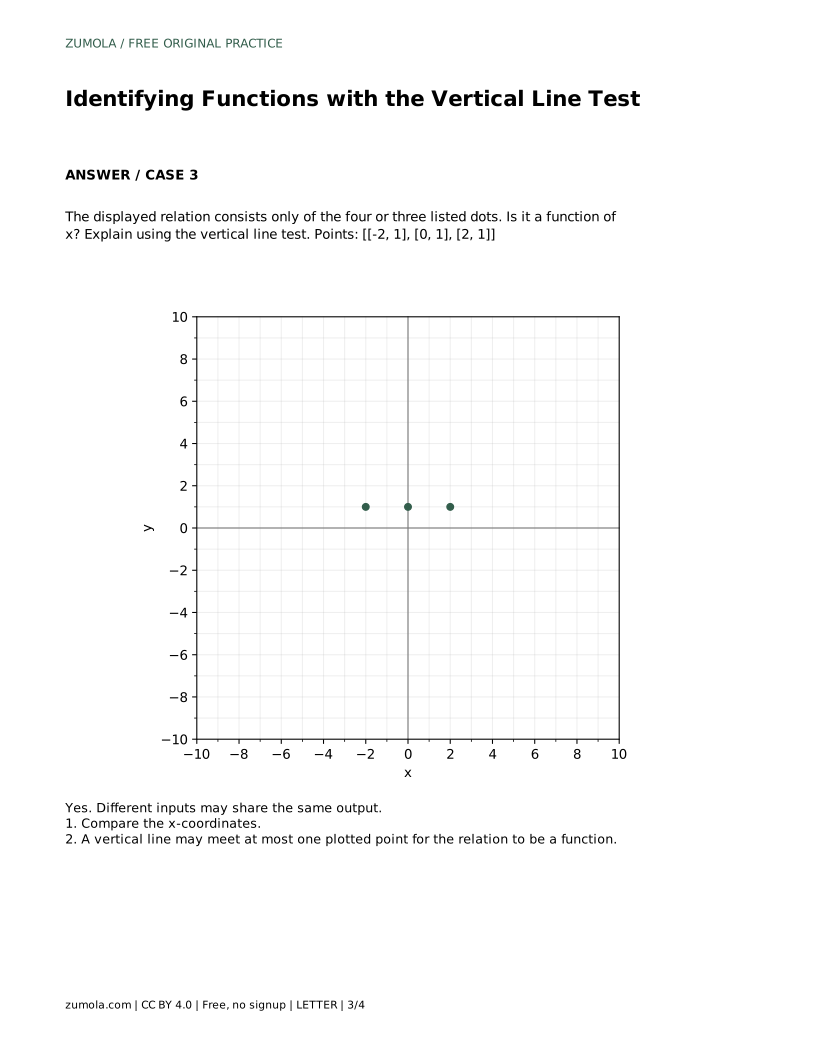
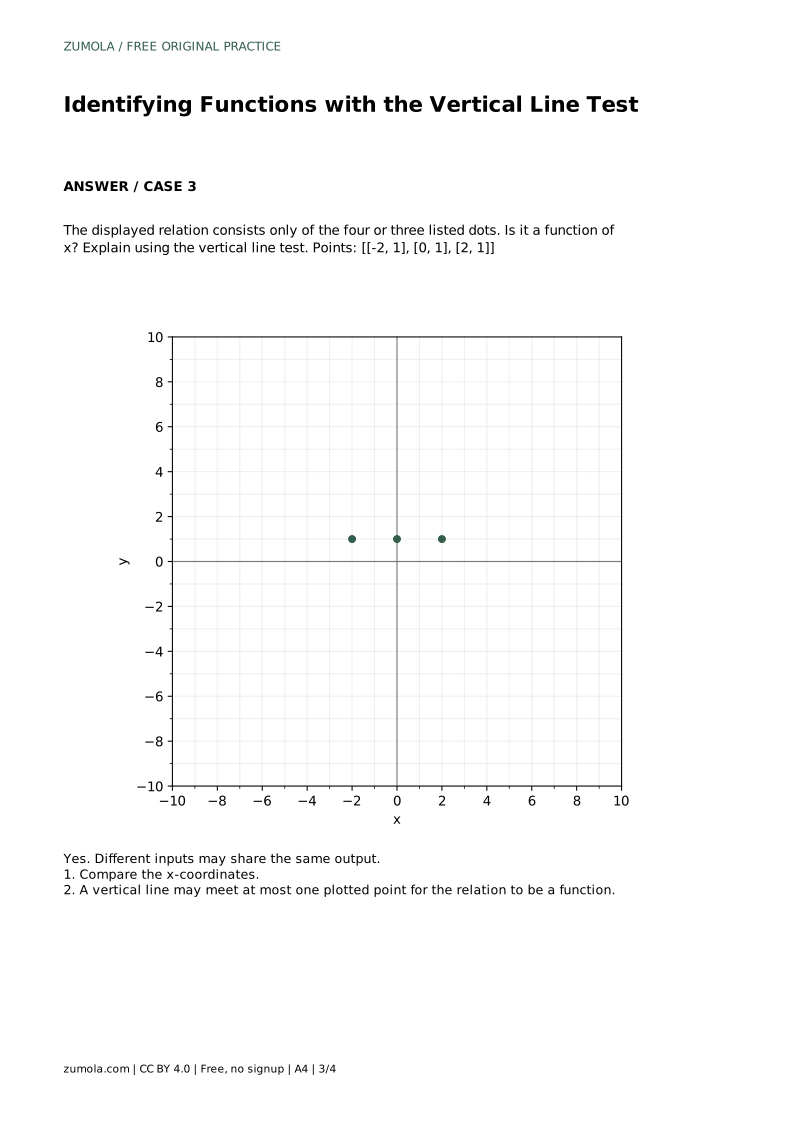
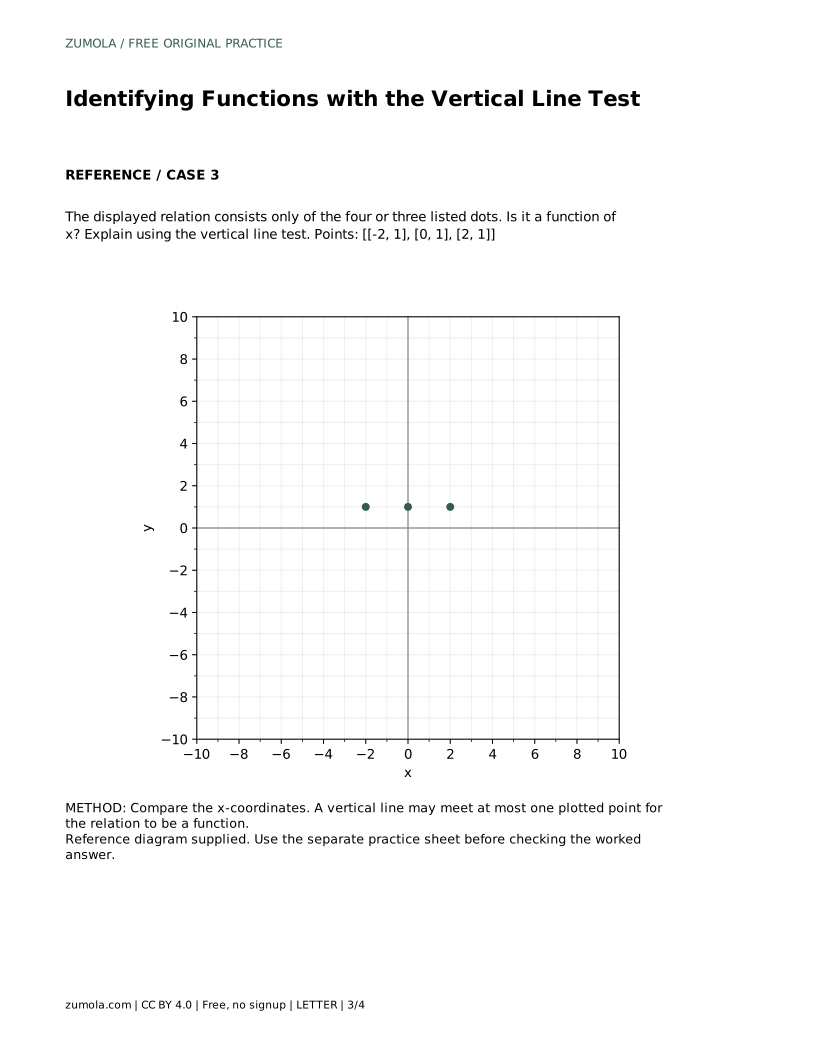
Points with different x-values may sit at the same height. That is allowed: outputs can repeat. For example, the points (-2, 1), (0, 1), and (2, 1) pass because each input appears once, even though every output is 1.
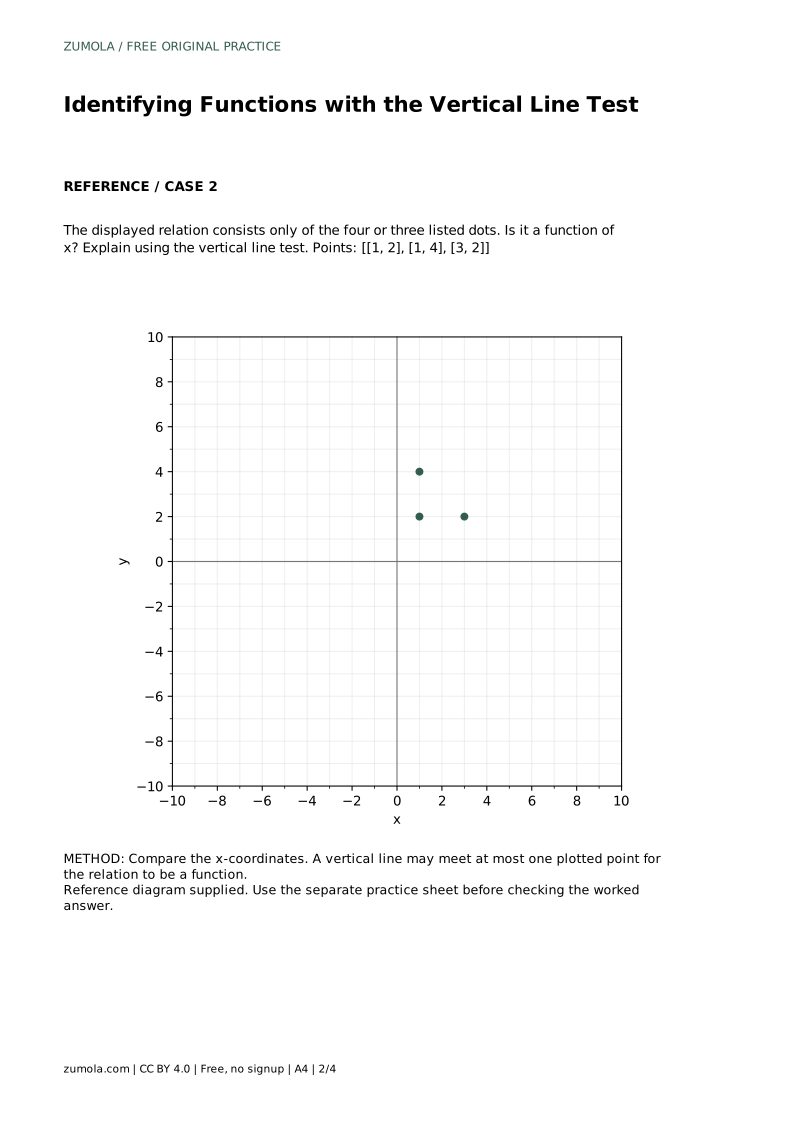
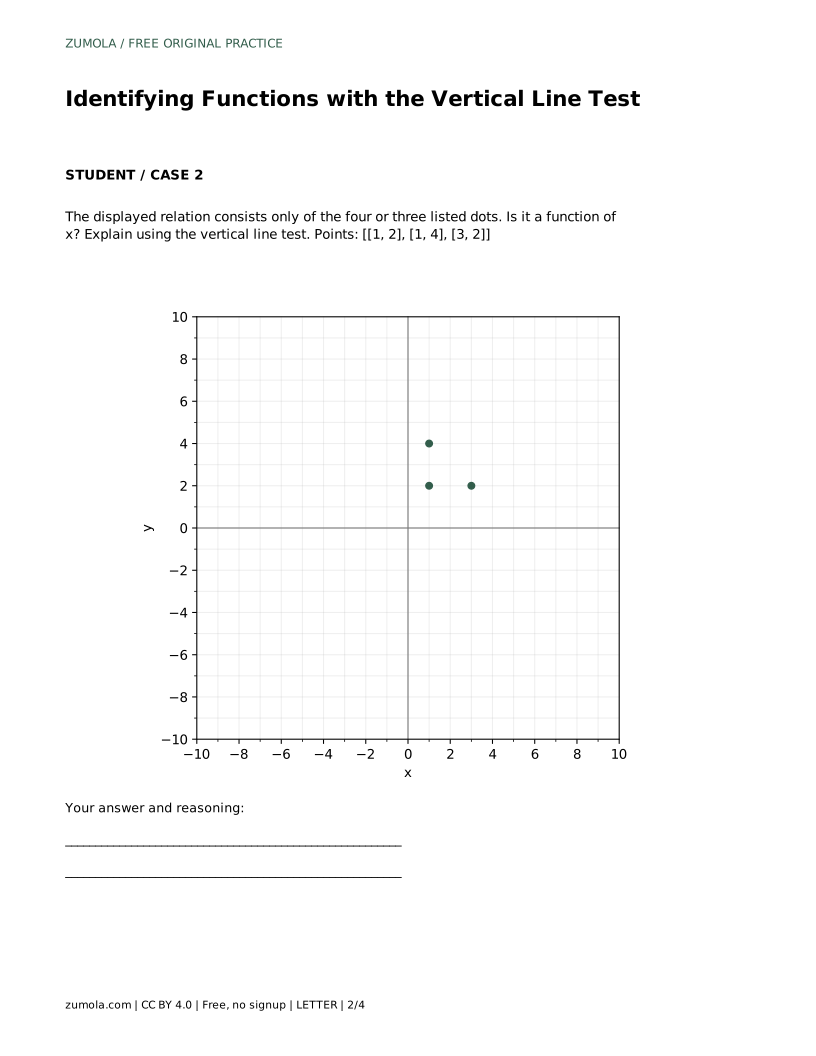
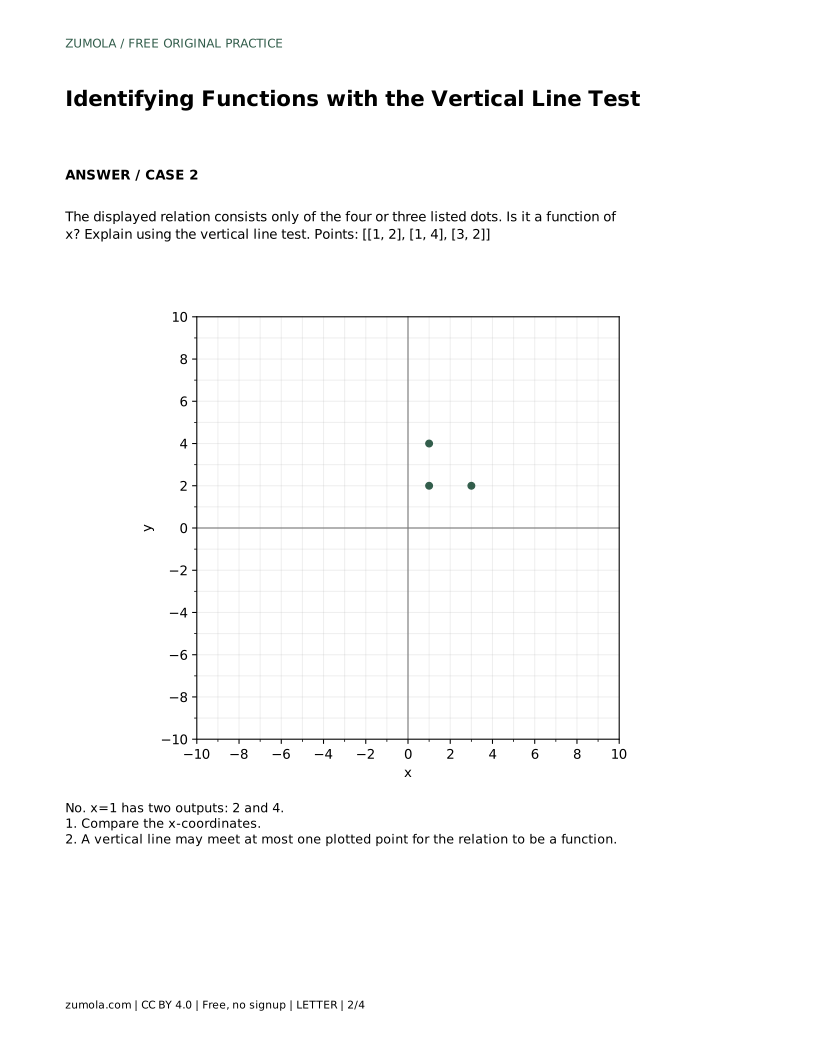
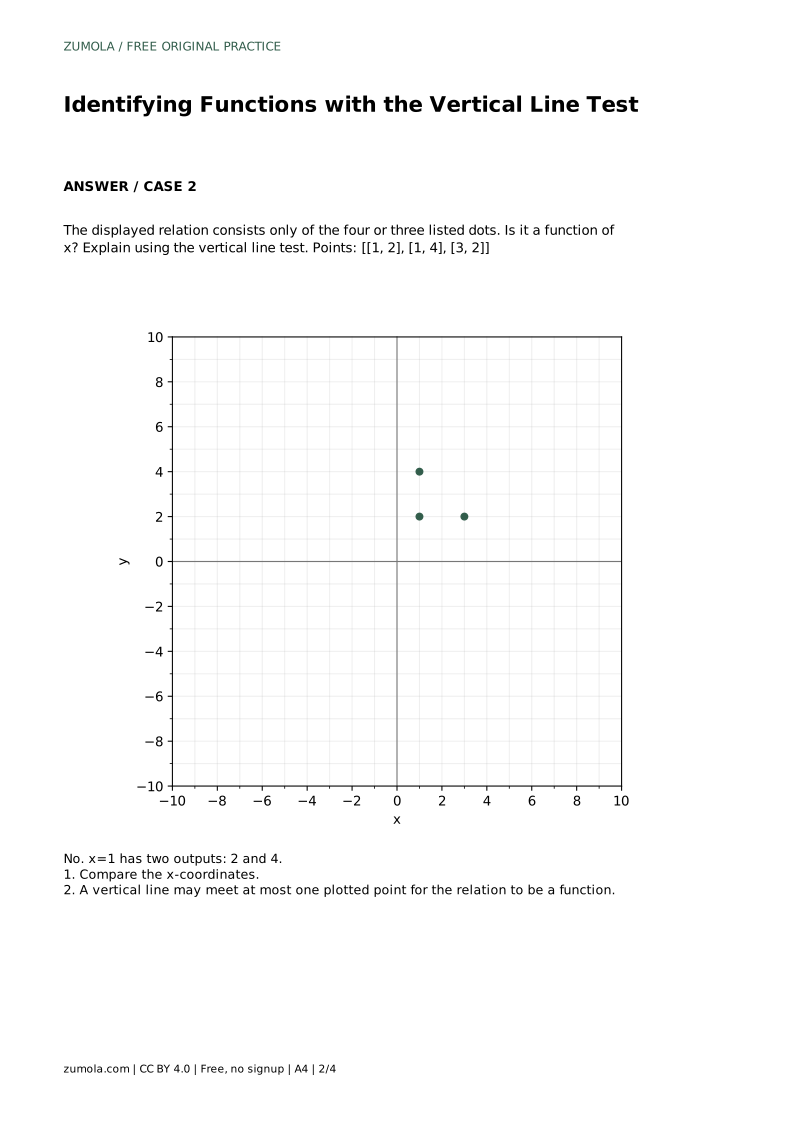
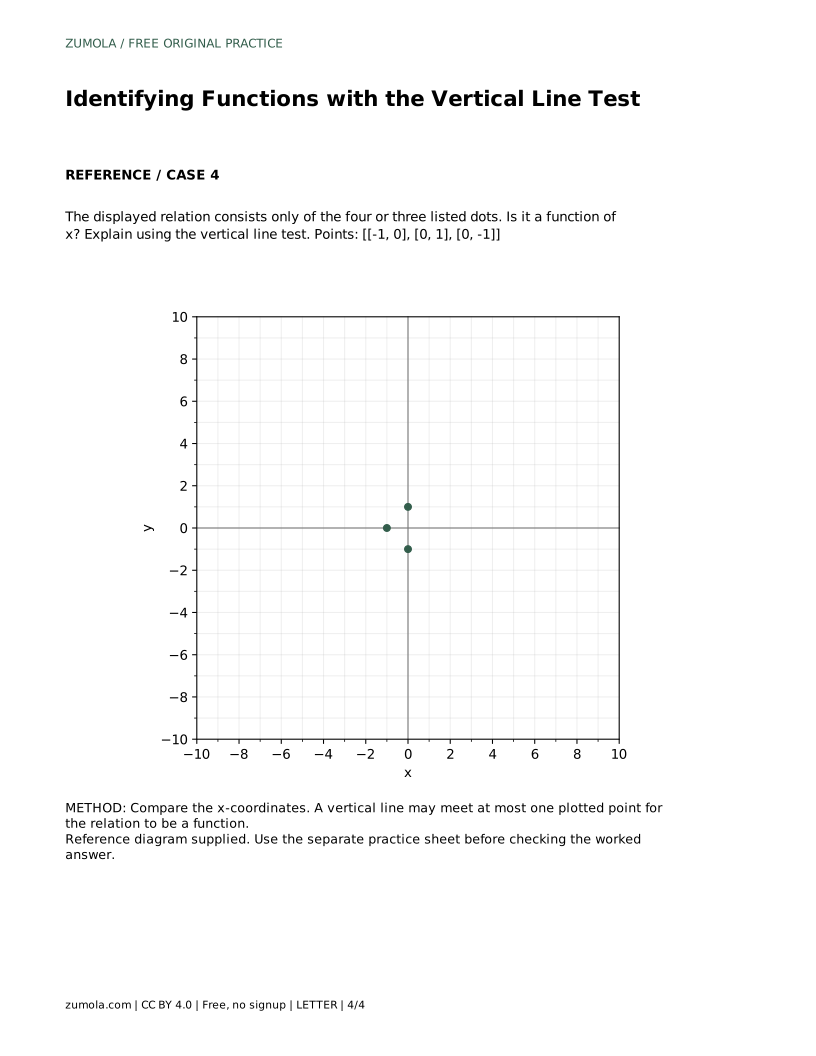
State the reason with the specific input involved. Saying x = 1 has outputs 2 and 4 is stronger than saying the graph looks vertical.
For a drawn curve, apply the test across the visible domain. A circle centered on the x-axis fails because a vertical line through its interior meets the curve twice. A parabola opening upward or downward passes because each vertical line meets it at most once. A sideways parabola fails.
Endpoints and open dots matter. A vertical line that meets a closed endpoint and another branch at the same x still counts as two meetings. If the graph is only partly shown, judge the relation as displayed and say so; do not assume hidden behavior outside the drawing.
The test concerns functions of x. A relation that fails as y = f(x) might still be a function of y, where horizontal lines are used instead. Keep the input variable explicit in your answer.
A complete answer names the test, applies it to a specific x-value or to the whole visible graph, and states the result. For a pass, explain that each input has exactly one output. For a fail, identify the input with two outputs.
Avoid claiming a graph is a function because it is smooth, connected, or passes through the origin. Those features are unrelated to the test. Also avoid saying a relation is not a function because two points share a y-value; repeated outputs are permitted.
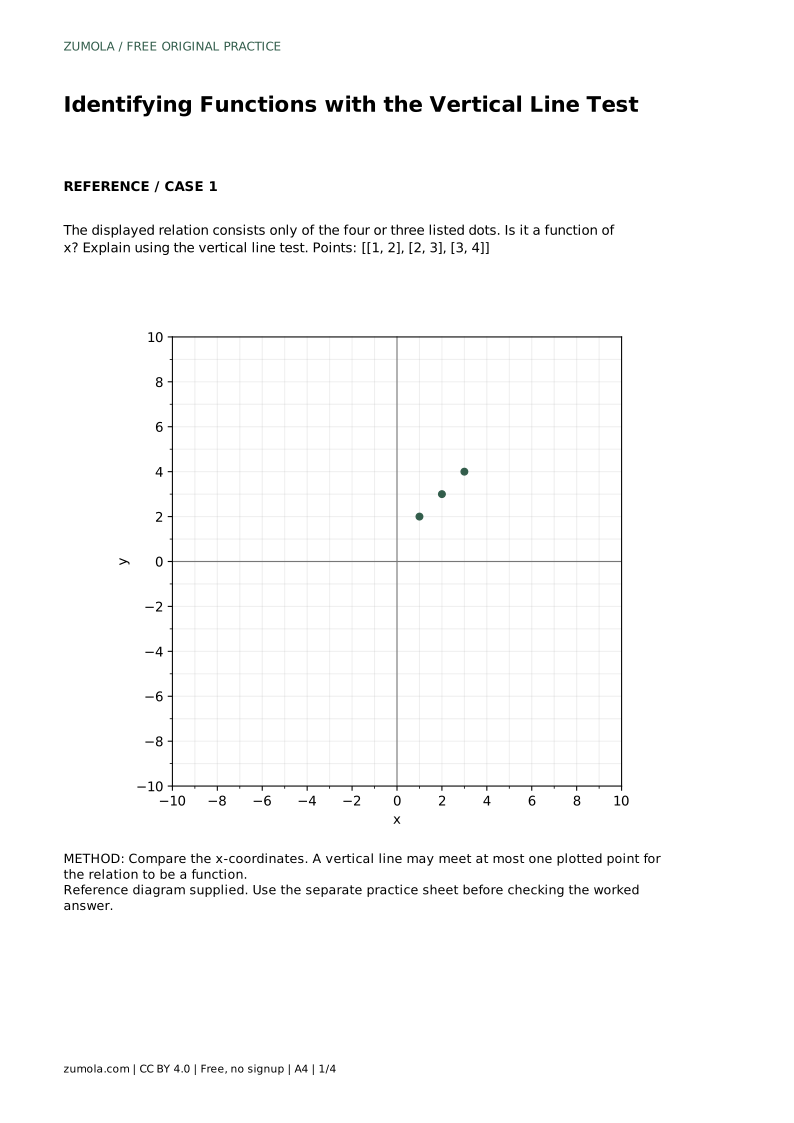
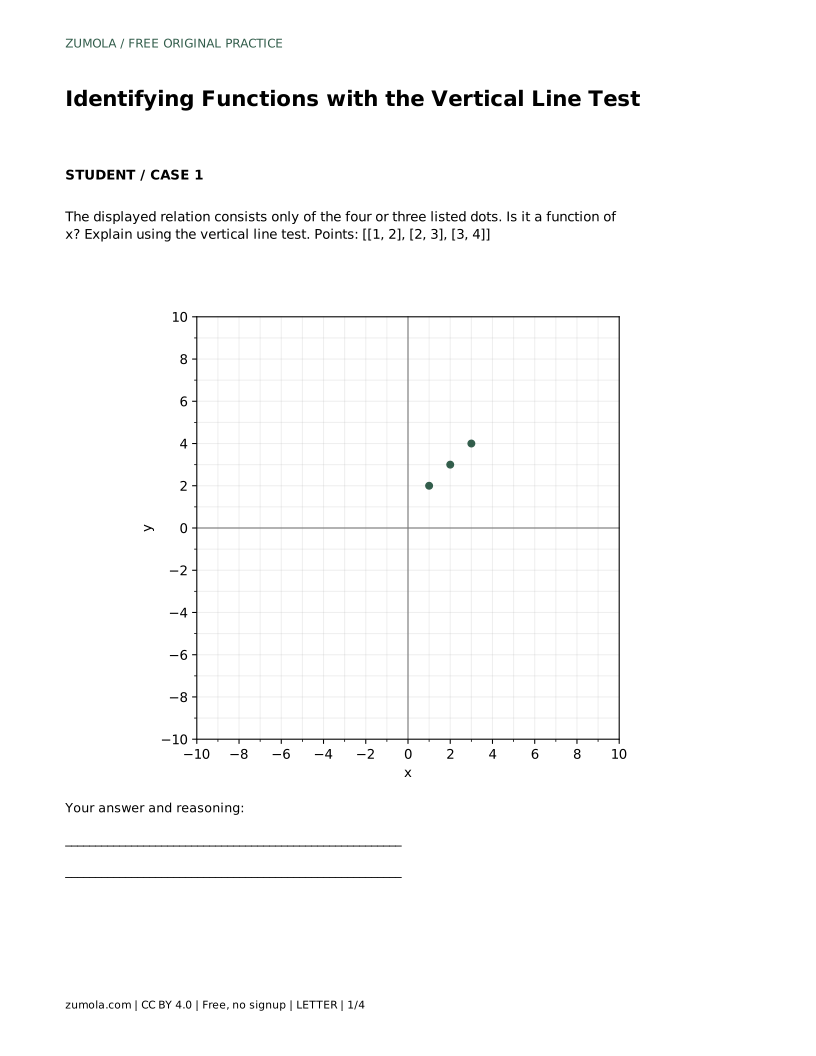
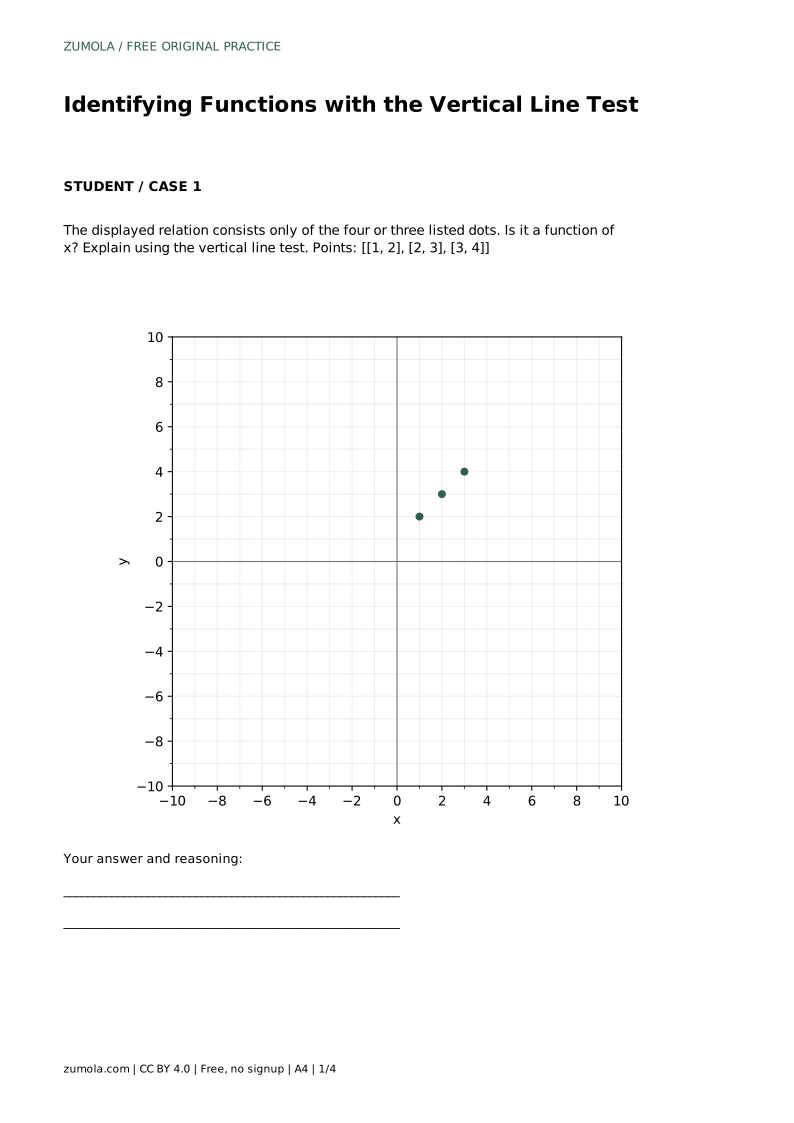
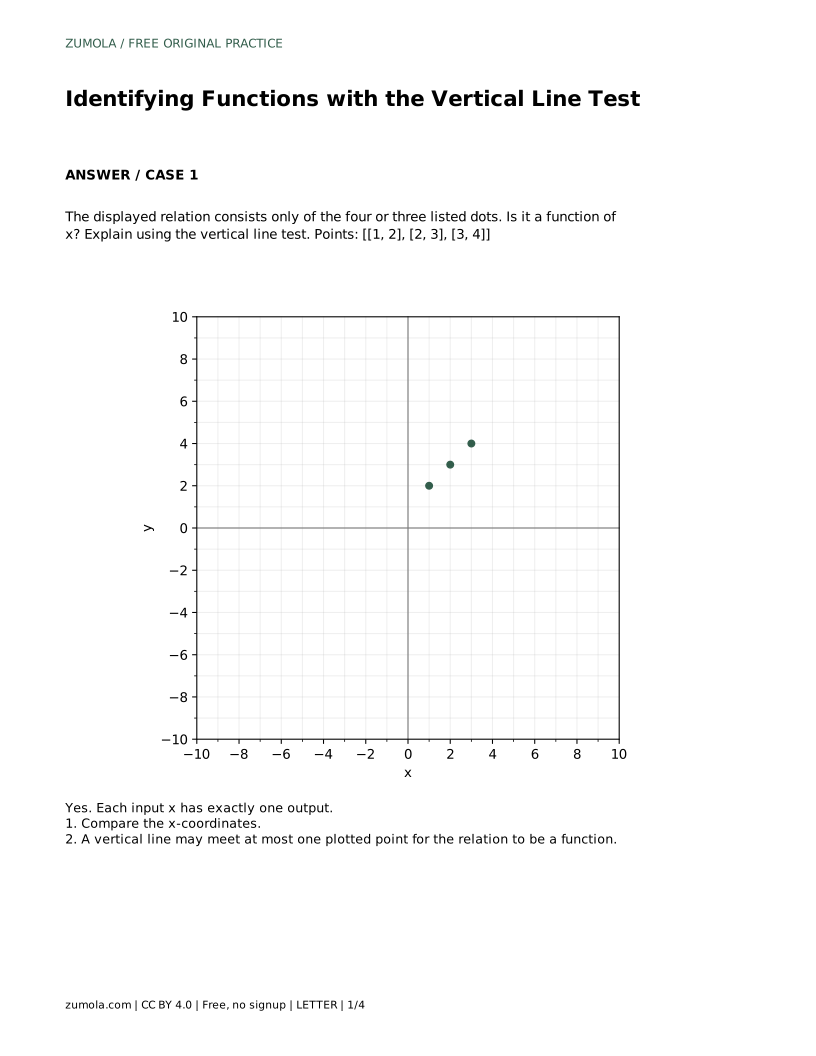
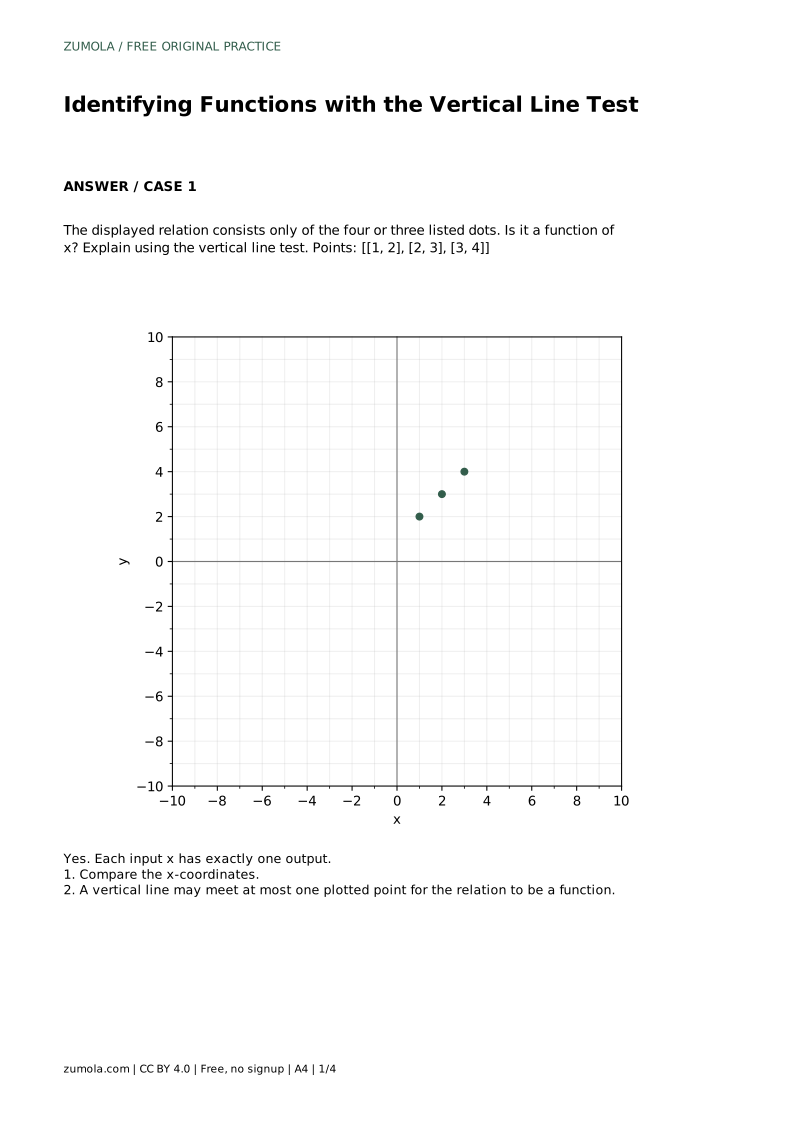
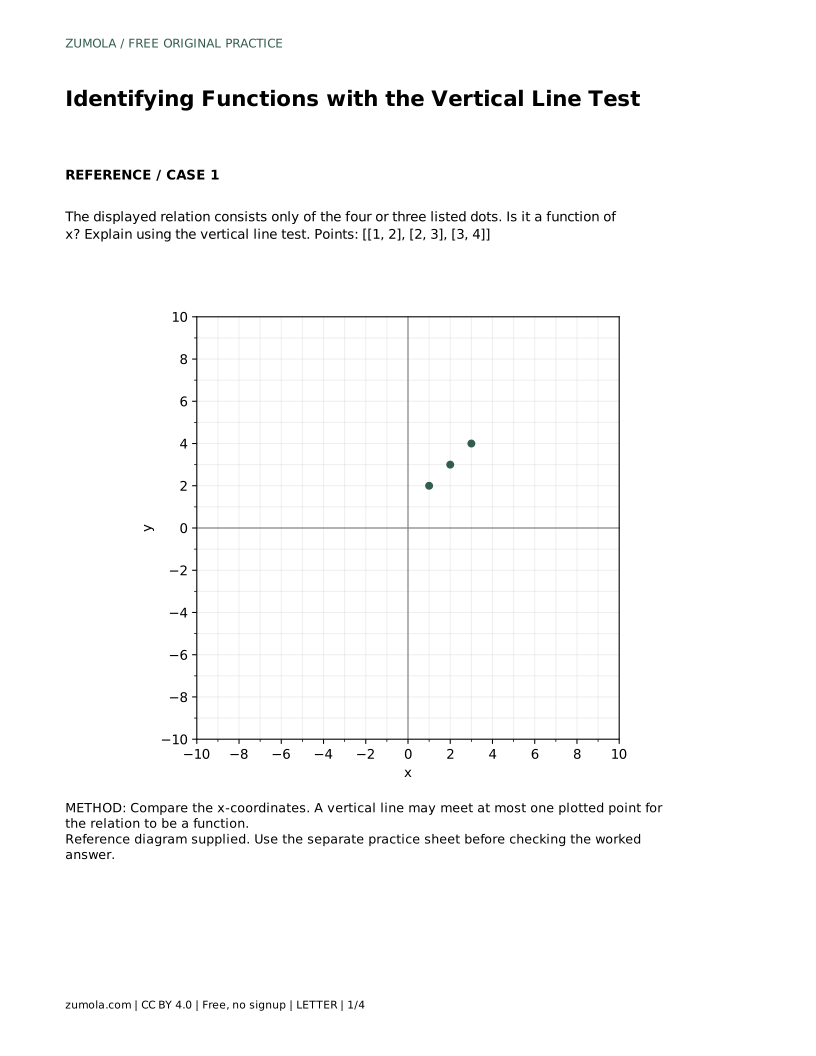
The displayed relation consists only of the three dots (1, 2), (2, 3), and (3, 4). Is it a function of x? Explain using the vertical line test.
Yes. The x-coordinates are 1, 2, and 3, each appearing once. Any vertical line meets at most one of these dots, so each input has exactly one output. The relation is a function of x.
No. A vertical line may meet the relation once or not at all. It must never meet it more than once.
Yes. For example, (-2, 1), (0, 1), and (2, 1) form a function of x because each input appears once.
Judge the relation as displayed and say that your conclusion applies to the visible portion. Do not assume behavior outside the drawing.
All math worksheets · Free coordinate paper
Original resources · CC BY 4.0 · Free for personal and classroom use with attribution.