Reference diagrams
LETTER · Download PDF
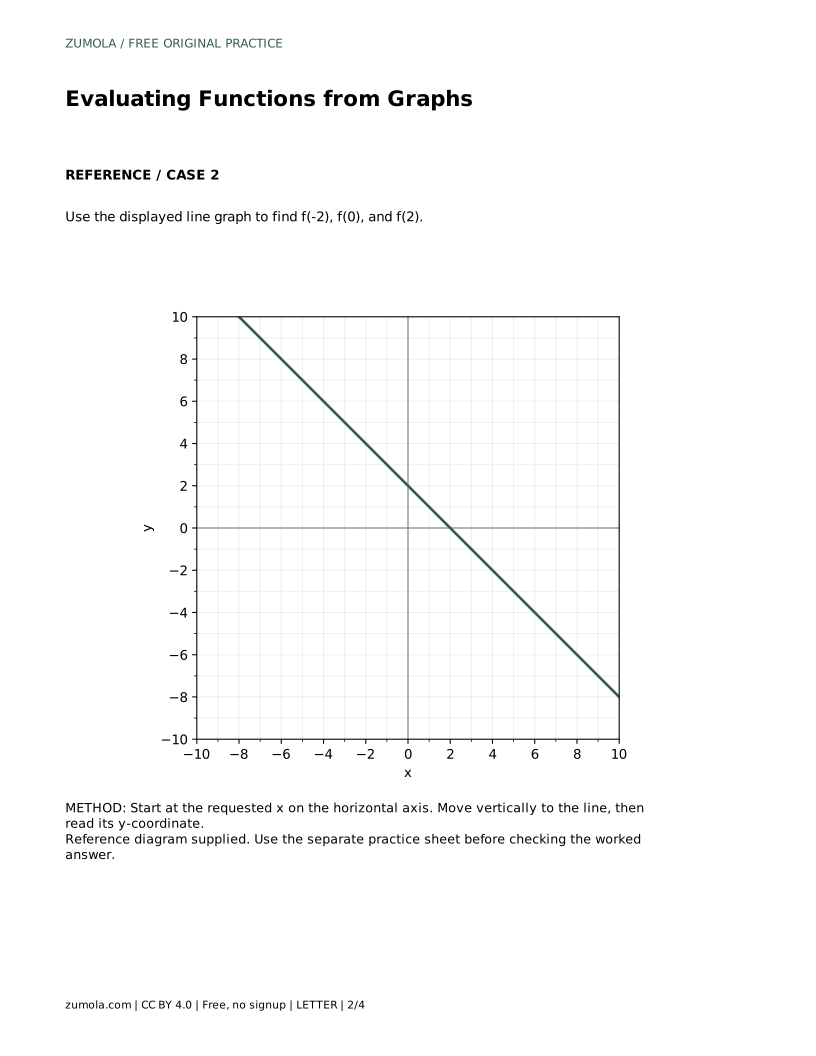
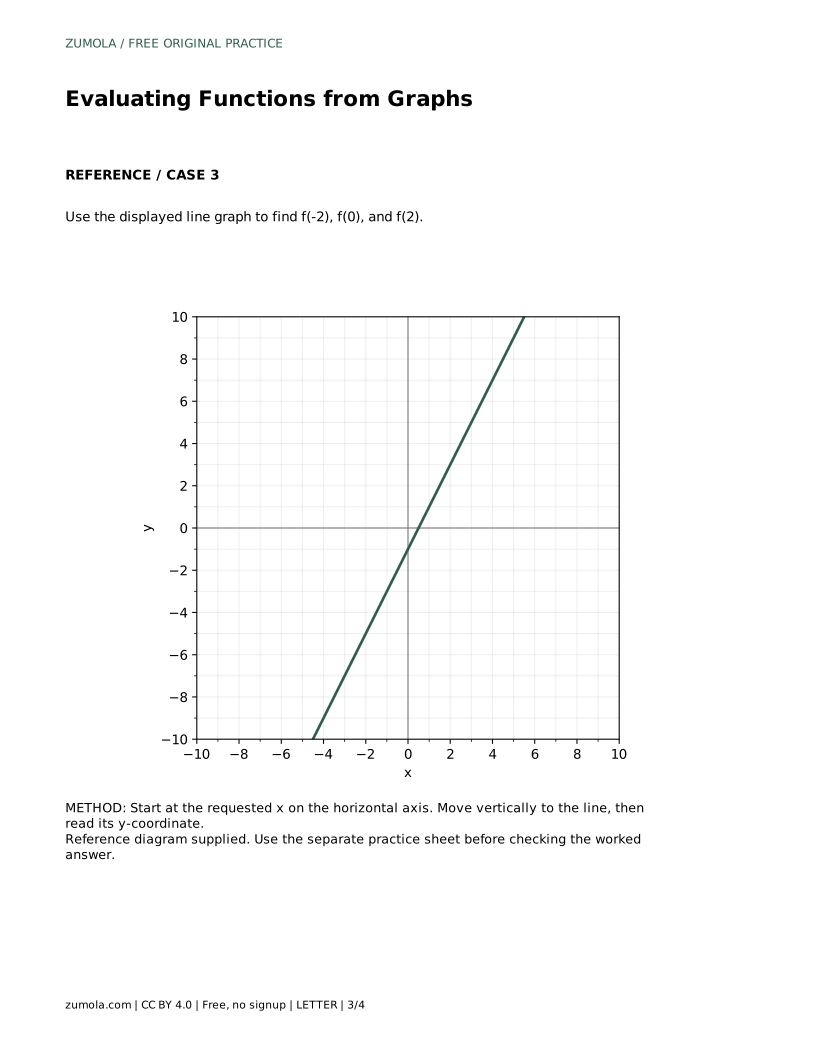
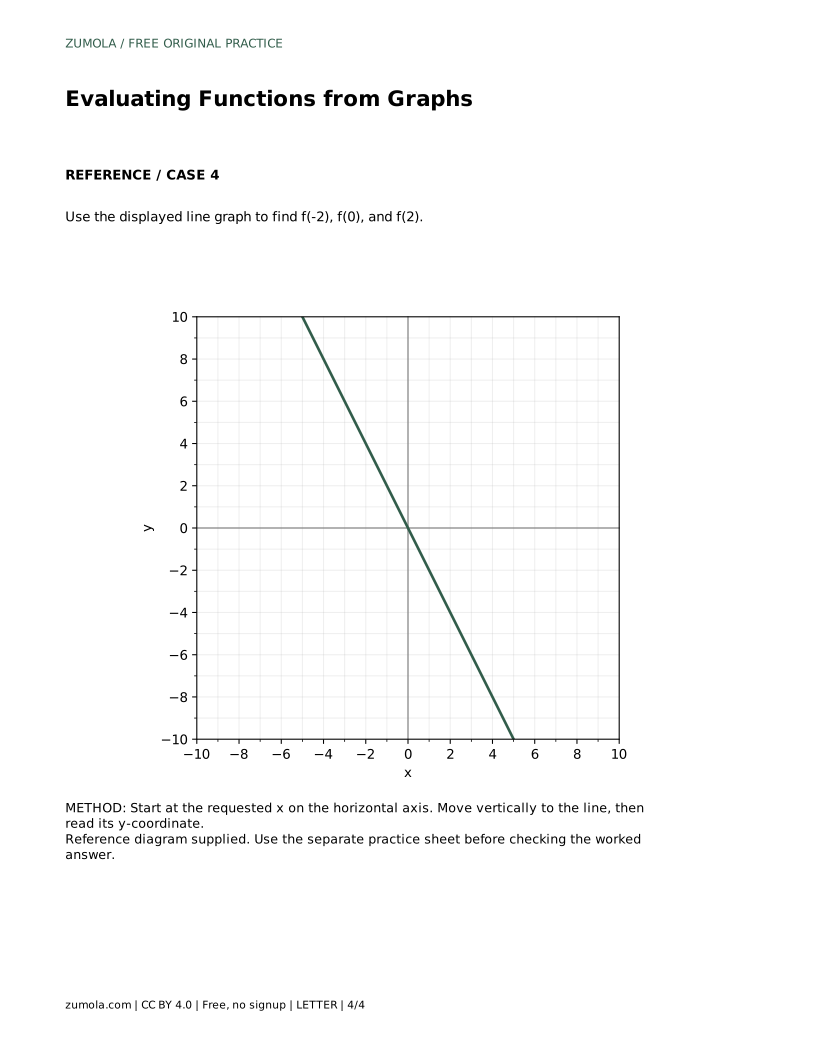
A4 · Download PDF
Free original resources
Learn to evaluate a function from its graph by locating an x-value, moving vertically to the line, and reading the matching y-value. Includes a worked example and rubric.
Four original cases, with reference diagrams, practice sheets and worked answers. Everything is free; no signup required.
LETTER · Download PDF
A4 · Download PDF
LETTER · Download PDF
A4 · Download PDF
LETTER · Download PDF
A4 · Download PDF
Use A4 or US Letter to match your printer. Graph coordinates determine the answers; these worksheets are not physical measuring rulers.
A graph shows a function as a set of points, and evaluating a function means finding the output that belongs to a chosen input. On a line graph, you start at the requested x-value on the horizontal axis, move straight up or down until you meet the line, then read the y-coordinate at that height. This page explains that reading process carefully, including how to handle negative inputs, axis scale, and points where the line crosses an axis.
A function pairs each allowed input with exactly one output. On a coordinate graph, the horizontal axis holds the input values and the vertical axis holds the output values. A point on the graph has coordinates written as (x, y), and for a function graph that point means f(x) = y. Evaluating f at a particular number asks for the y-value paired with that x-value.
The graph is the reference, not a formula you must derive. If the line passes through the point (-2, -1), then f(-2) = -1. You do not need to calculate a slope or intercept to answer a single evaluation question, although checking a formula can confirm your reading. The key discipline is to begin at the correct x and move vertically, not diagonally.
Negative inputs sit to the left of zero on the horizontal axis. Move left first, then vertically to the line. A common error is to move left and then read the vertical position as if it were also negative, even when the line is above the horizontal axis. The sign of the output comes from the vertical axis, not from the sign of the input.
When the requested input is zero, the point lies on the vertical axis. The output is the y-intercept, the height where the line crosses that axis. When the line crosses the horizontal axis, the output is zero at that input. Reading these crossings accurately helps you check whether your other readings are plausible, because a line changes height steadily as you move along the horizontal axis.
Grid lines may represent one unit, two units, or another interval. Read the axis labels before counting squares. If each square is two units, a point three squares above the axis has a y-coordinate of six, not three. Mixing horizontal and vertical scales is another source of error, so confirm each axis separately.
A useful check is to compare two or more evaluations from the same line. If the input increases by a fixed amount, the output on a straight line changes by a consistent amount. If one reading breaks that pattern, recheck the starting position and the vertical movement. Printed sheets should be produced at 100% only after checking a calibration bar, since resizing can distort grid spacing and make readings unreliable.
A complete answer states the input, the point reached, and the output. Writing f(-2) = -1 is concise, but adding that the graph passes through (-2, -1) shows the reasoning. This matters when a teacher or peer checks the work, because the point identifies exactly where the reading came from.
Graph reading is a skill of careful observation, and different students may describe the same point in slightly different words. Judge the accuracy of the coordinates and the clarity of the explanation rather than the exact phrasing. A correct answer should use the displayed scale, preserve signs, and connect each input to one output.
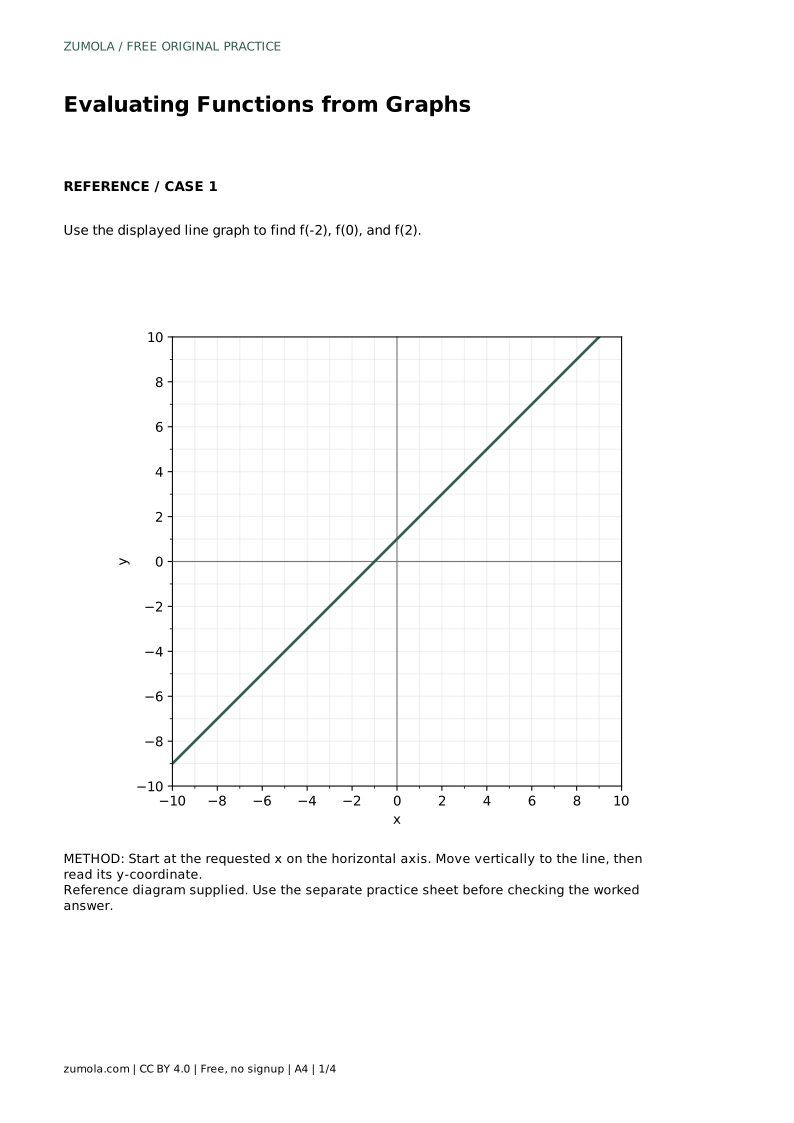
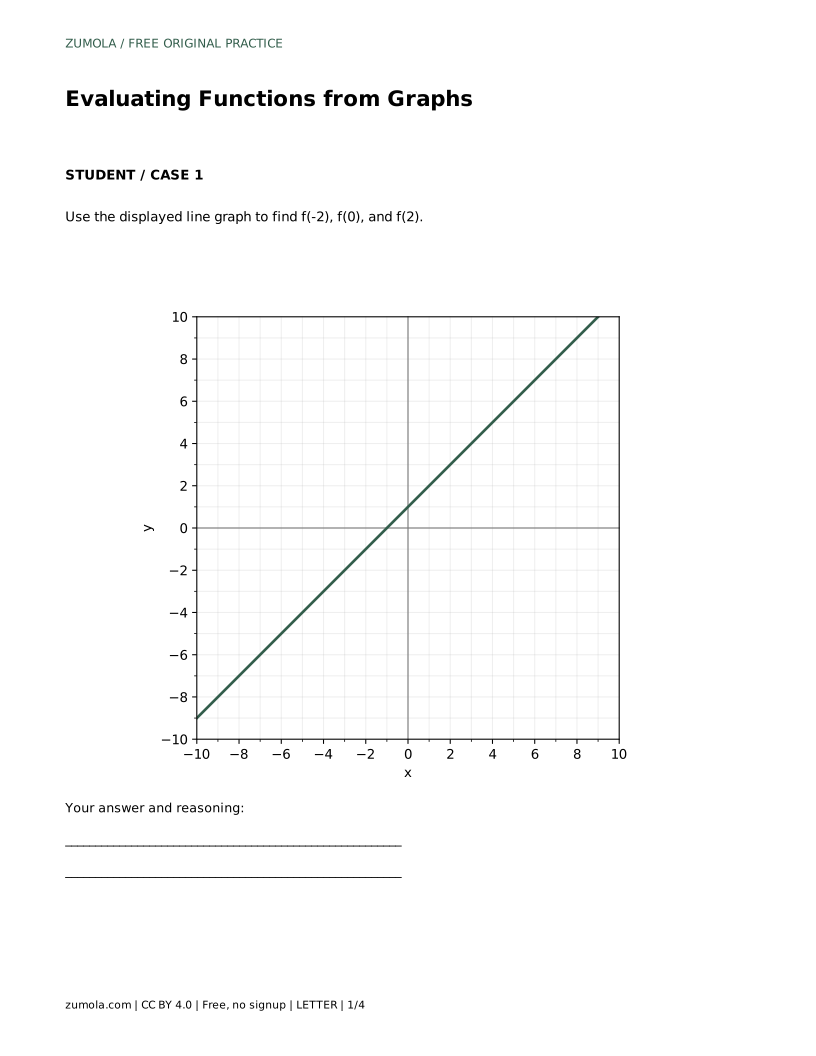
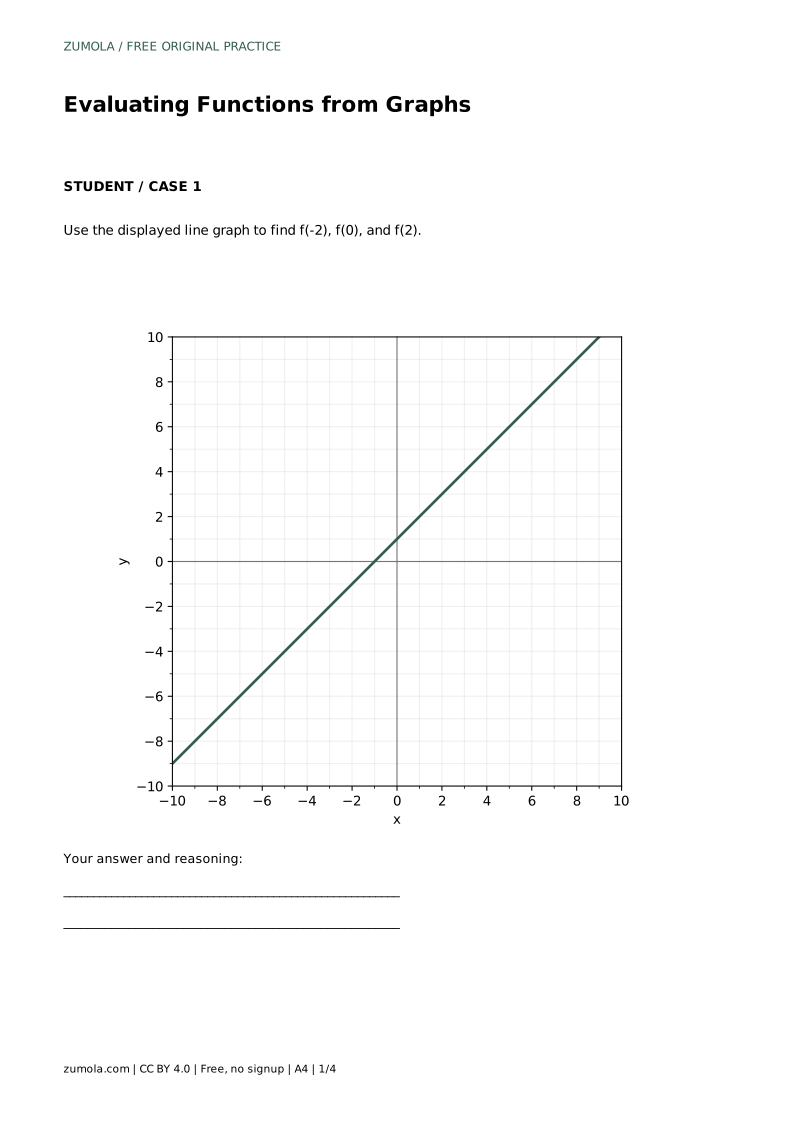
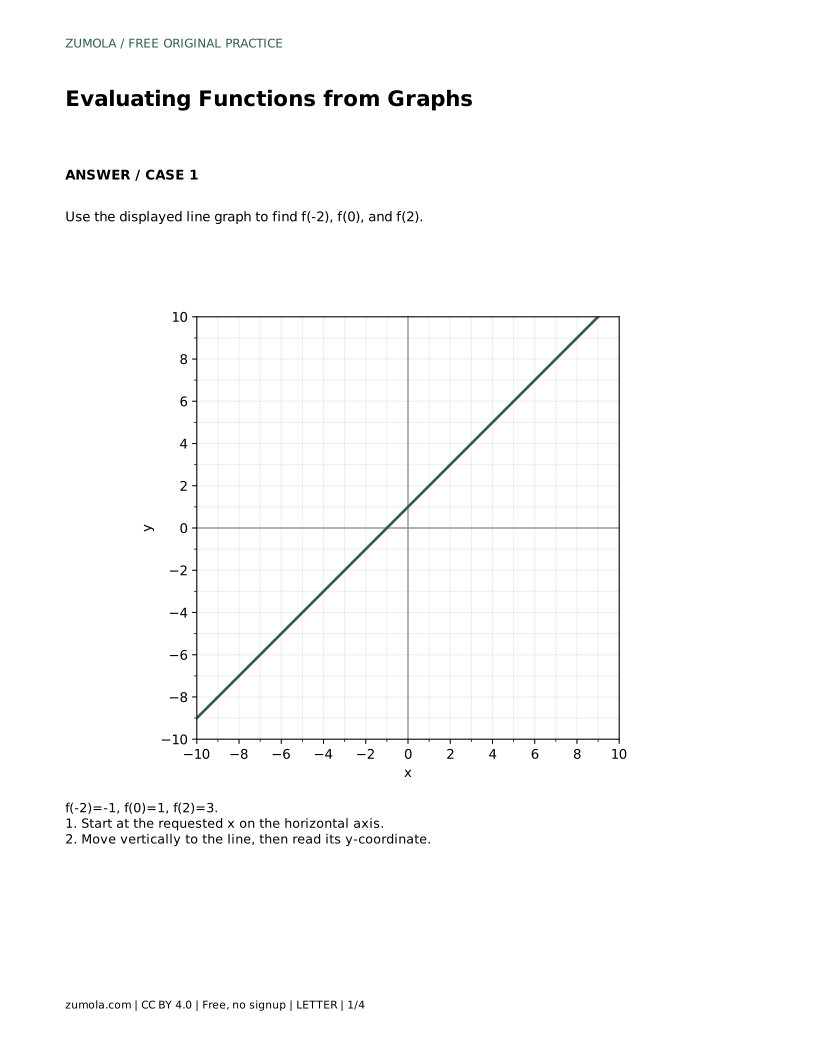
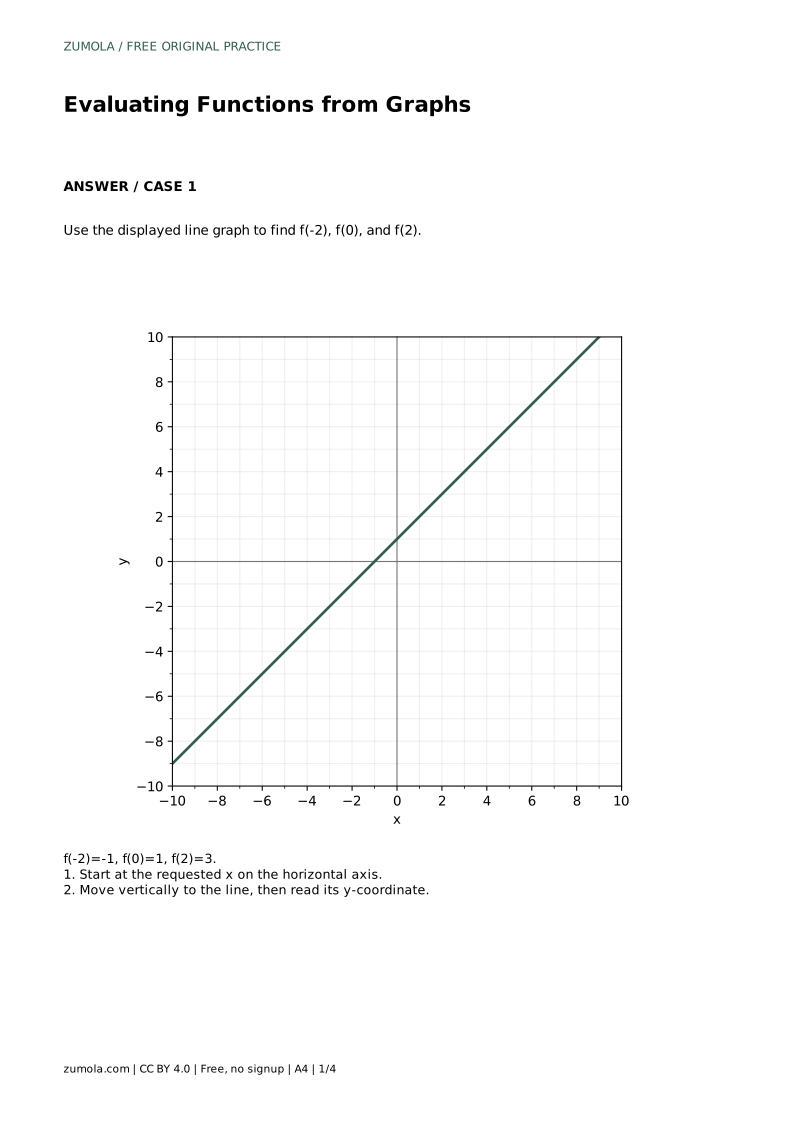
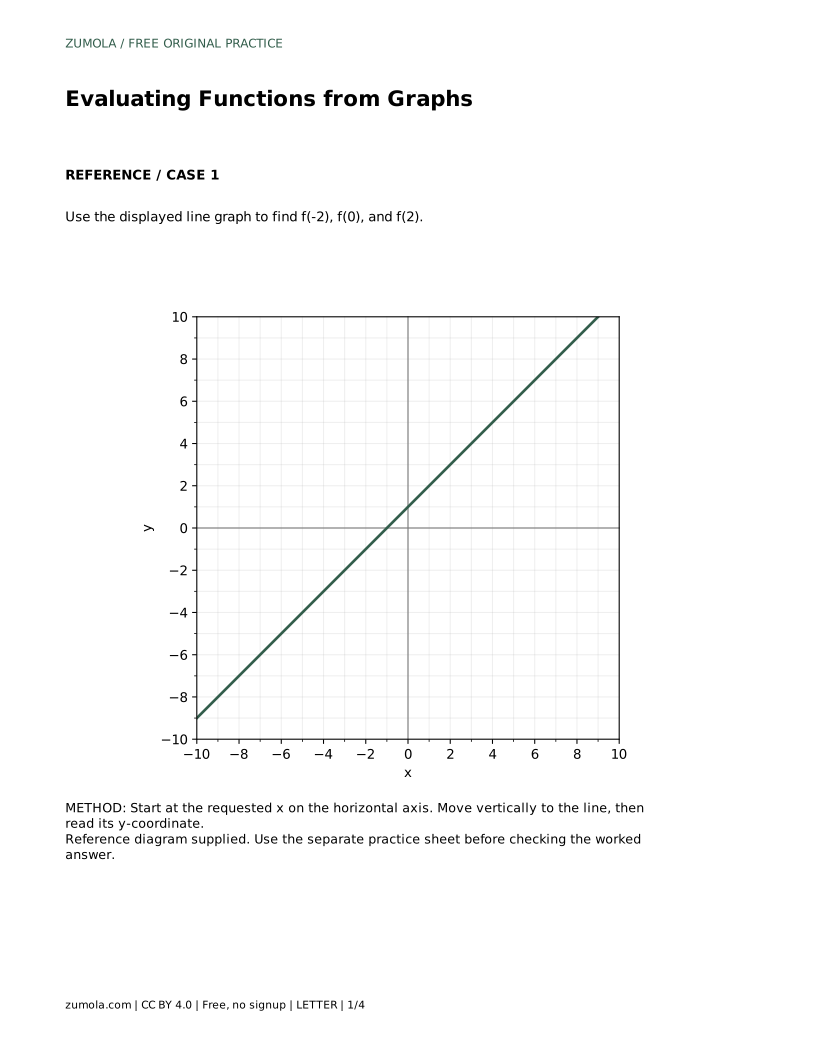
Use the displayed line graph to find f(-2), f(0), and f(2). The line shown is y = x + 1, so each output is one more than the input. Start at x = -2 on the horizontal axis, move vertically to the line, and read y = -1. At x = 0, the line meets the vertical axis at y = 1. At x = 2, move up to the line and read y = 3. Therefore f(-2) = -1, f(0) = 1, and f(2) = 3. The points (-2, -1), (0, 1), and (2, 3) all lie on the same straight line, and the output increases by two each time the input increases by two.
Use the displayed line graph of y = x + 1 to find f(-2), f(0), and f(2).
At x = -2, the line is at y = -1, so f(-2) = -1. At x = 0, the line crosses the vertical axis at y = 1, so f(0) = 1. At x = 2, the line is at y = 3, so f(2) = 3. The points (-2, -1), (0, 1), and (2, 3) lie on the line.
It is the output when the input is zero, so it is the y-coordinate where the graph meets the vertical axis.
No. A function pairs each allowed input with exactly one output, so a vertical line through that x-value should meet the graph at most once.
No. You can read the output directly from the graph. The equation is useful only as a check.
All math worksheets · Free coordinate paper
Original resources · CC BY 4.0 · Free for personal and classroom use with attribution.