Reference diagrams
LETTER · Download PDF
A4 · Download PDF
Free original resources
Learn to complete input-output tables for linear rules and plot the resulting ordered pairs as sampled points. Includes a worked example, common mistakes, and a rubric.
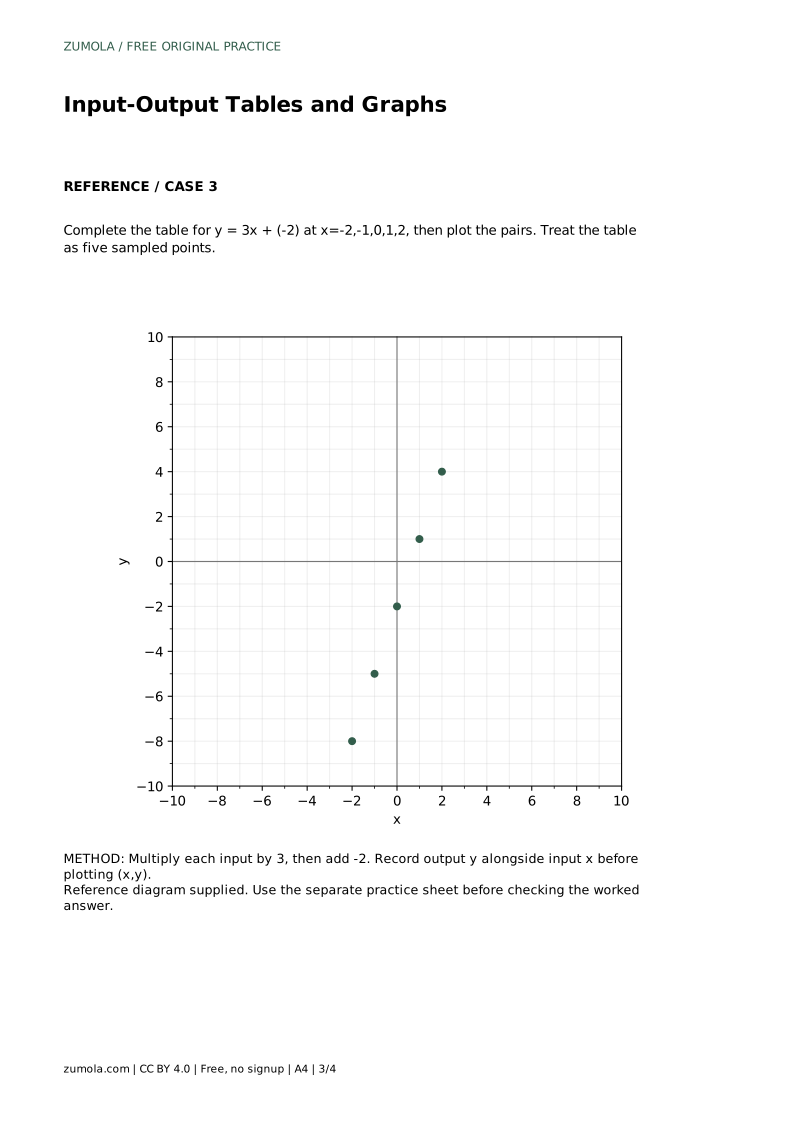
Four original cases, with reference diagrams, practice sheets and worked answers. Everything is free; no signup required.
LETTER · Download PDF
A4 · Download PDF
LETTER · Download PDF
A4 · Download PDF
LETTER · Download PDF
A4 · Download PDF
Use A4 or US Letter to match your printer. Graph coordinates determine the answers; these worksheets are not physical measuring rulers.

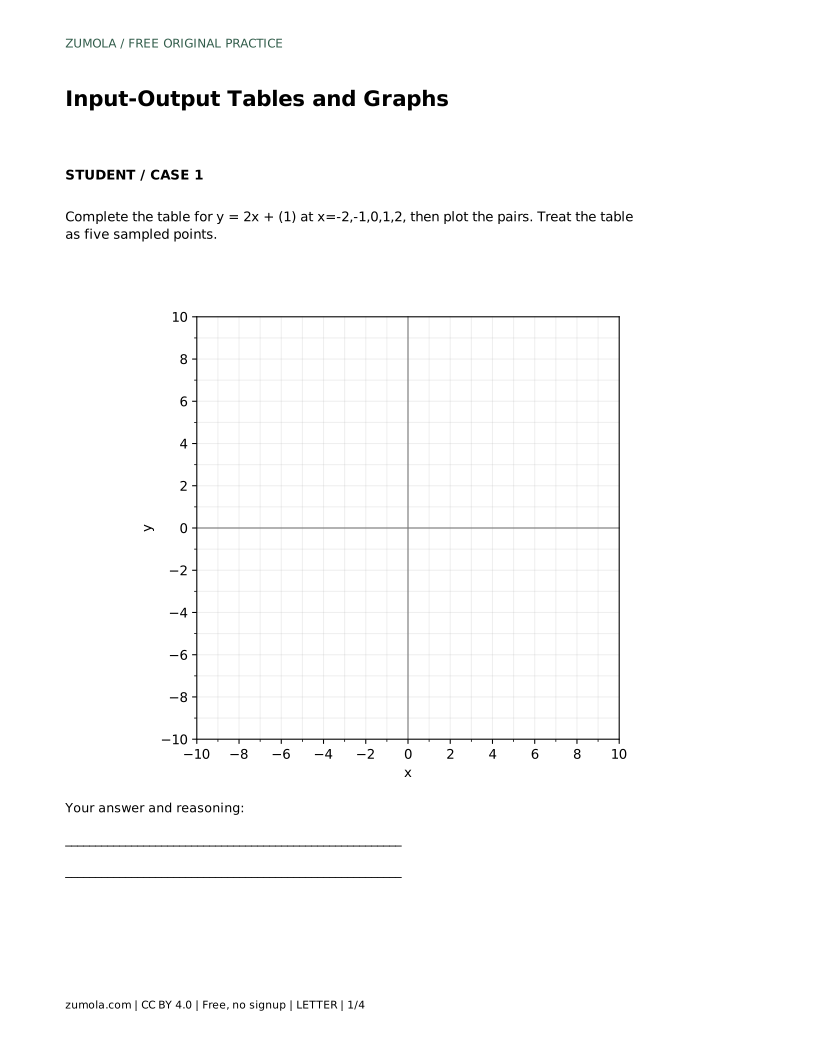
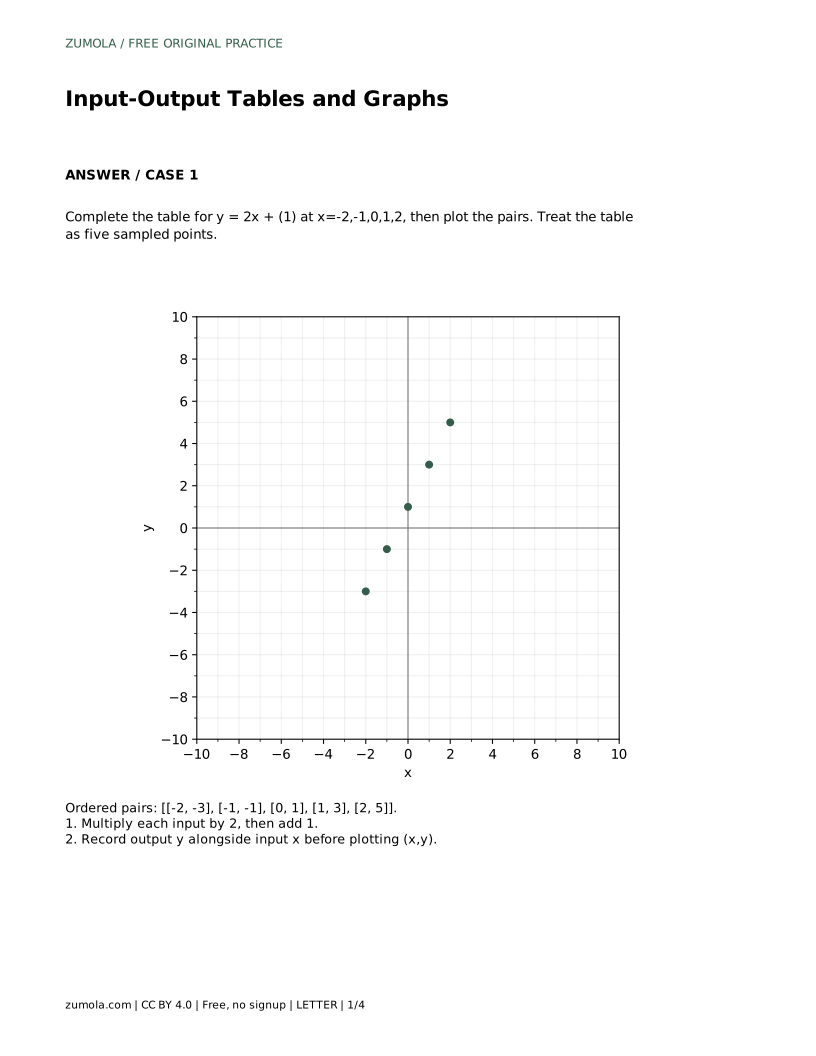
An input-output table records pairs of values: each input x is substituted into a rule to produce an output y. Plotting those pairs as (x, y) shows the sampled points on a coordinate grid. This page explains the method step by step, using the rule y = 2x + 1 sampled at x = -2, -1, 0, 1, 2. The table is a set of five discrete samples, not a continuous line unless you choose to connect them. Work through the example, check the common mistakes, and use the rubric to judge your own table and graph.
Start with the rule and a list of inputs. For each input x, replace x in the rule with that number, then carry out the arithmetic in the correct order: multiply first, then add. Record the output y in the same row as its input so the pair stays together. In the example y = 2x + 1, the input -2 gives 2(-2) + 1 = -4 + 1 = -3. The input 0 gives 2(0) + 1 = 1. Keep negative signs inside parentheses when substituting to avoid sign errors.
A table is complete when every listed input has exactly one output. The five inputs -2, -1, 0, 1, 2 produce five ordered pairs. These are samples of the rule, not every possible point. If you later connect the points, you are assuming the rule continues smoothly between samples; that is a choice, not a requirement of the table.
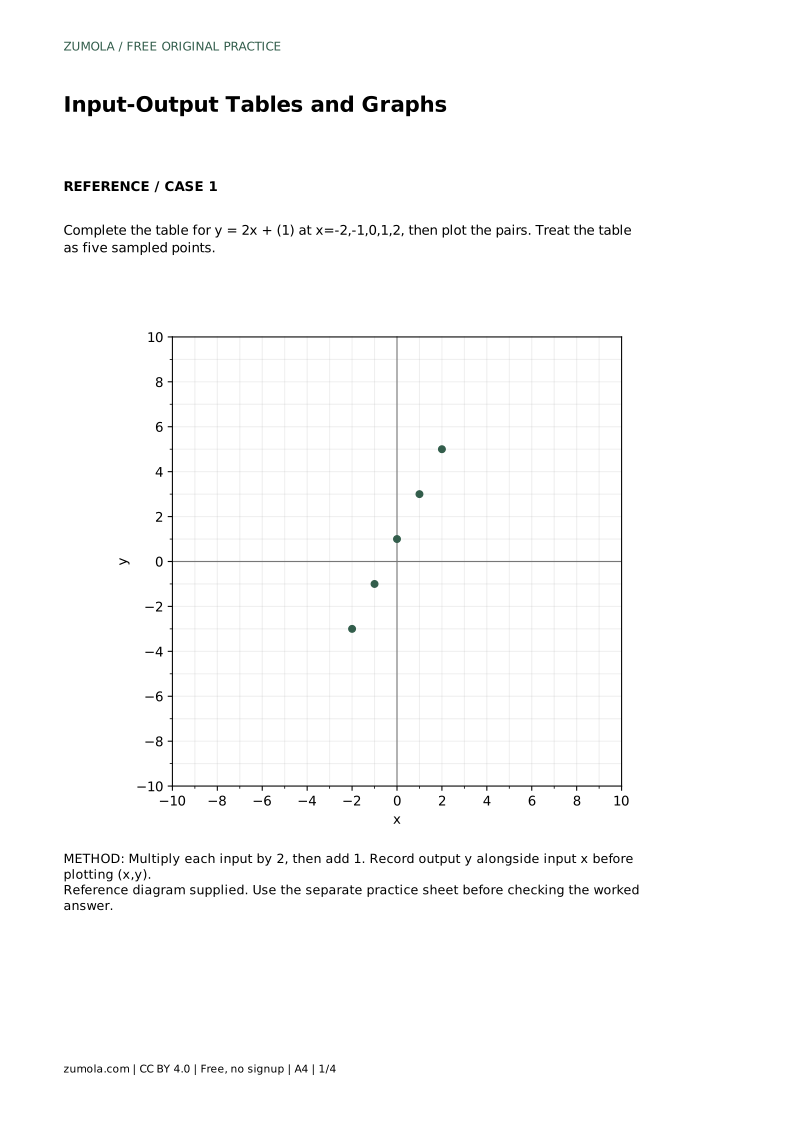
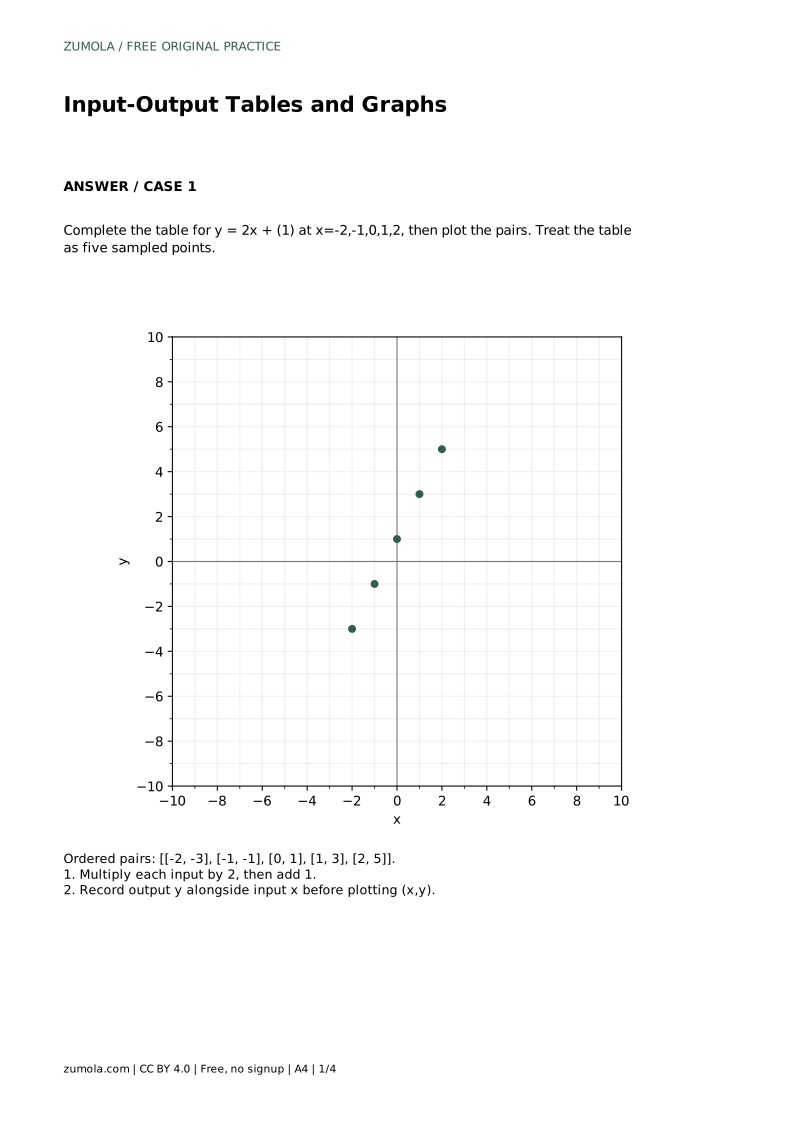
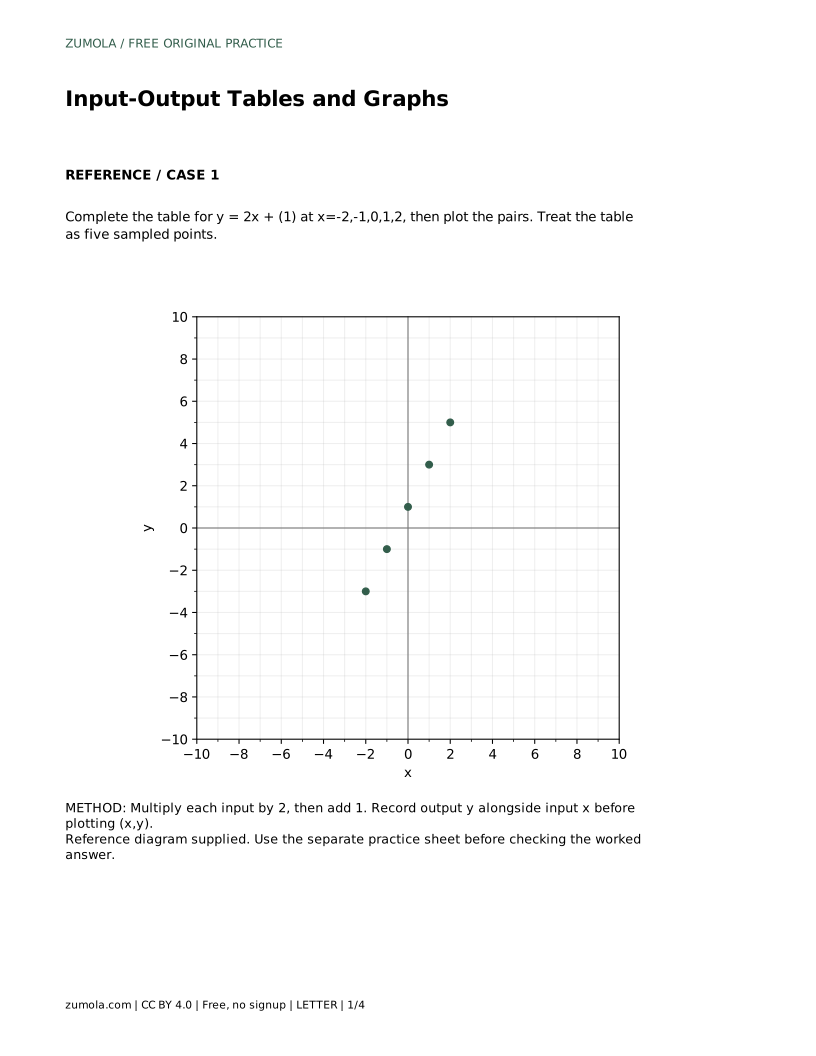
Each row of the table becomes one point. The input is the x-coordinate (horizontal position) and the output is the y-coordinate (vertical position). Plot (x, y), not (y, x). For y = 2x + 1, the pairs are (-2, -3), (-1, -1), (0, 1), (1, 3), and (2, 5). Start at the origin, move along the x-axis by the input value, then move parallel to the y-axis by the output value.
Label each plotted point with its coordinates or keep the table beside the graph so the correspondence is clear. If the points appear to lie on a straight path, that is consistent with a linear rule, but the table alone only guarantees five plotted samples. Decide explicitly whether to connect the points; if you do, state that you are treating the rule as continuous between the sampled inputs.
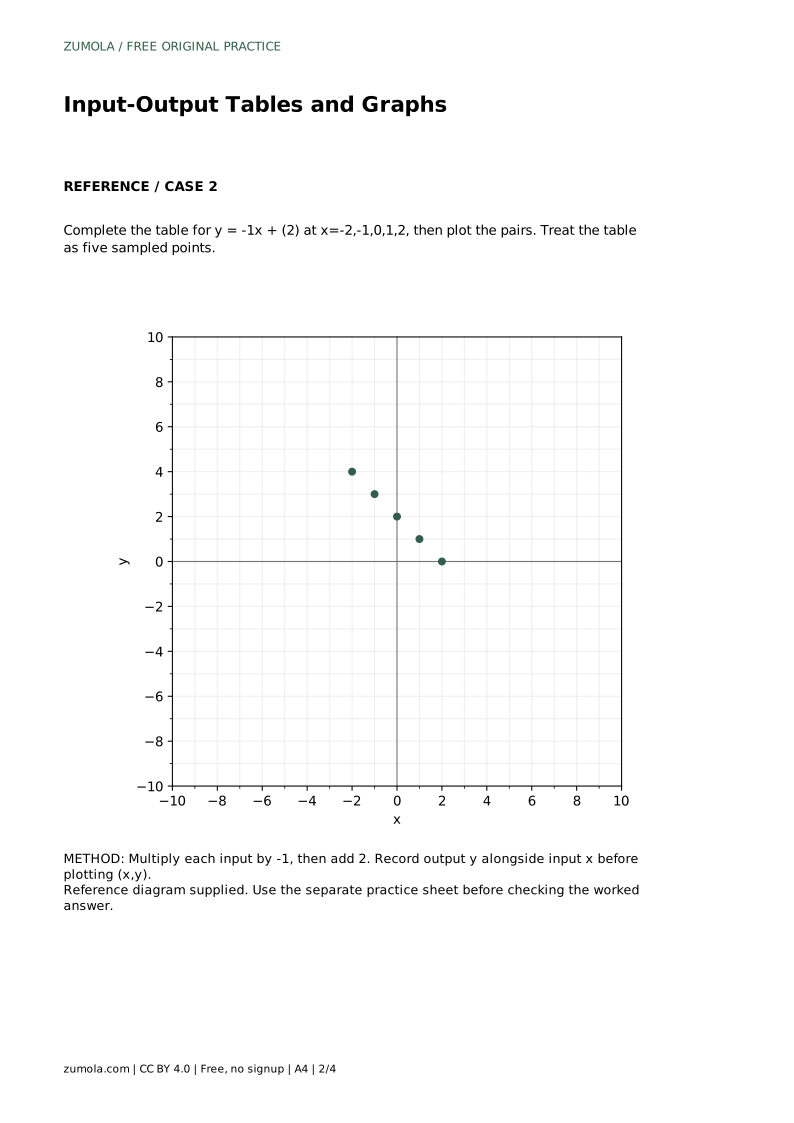
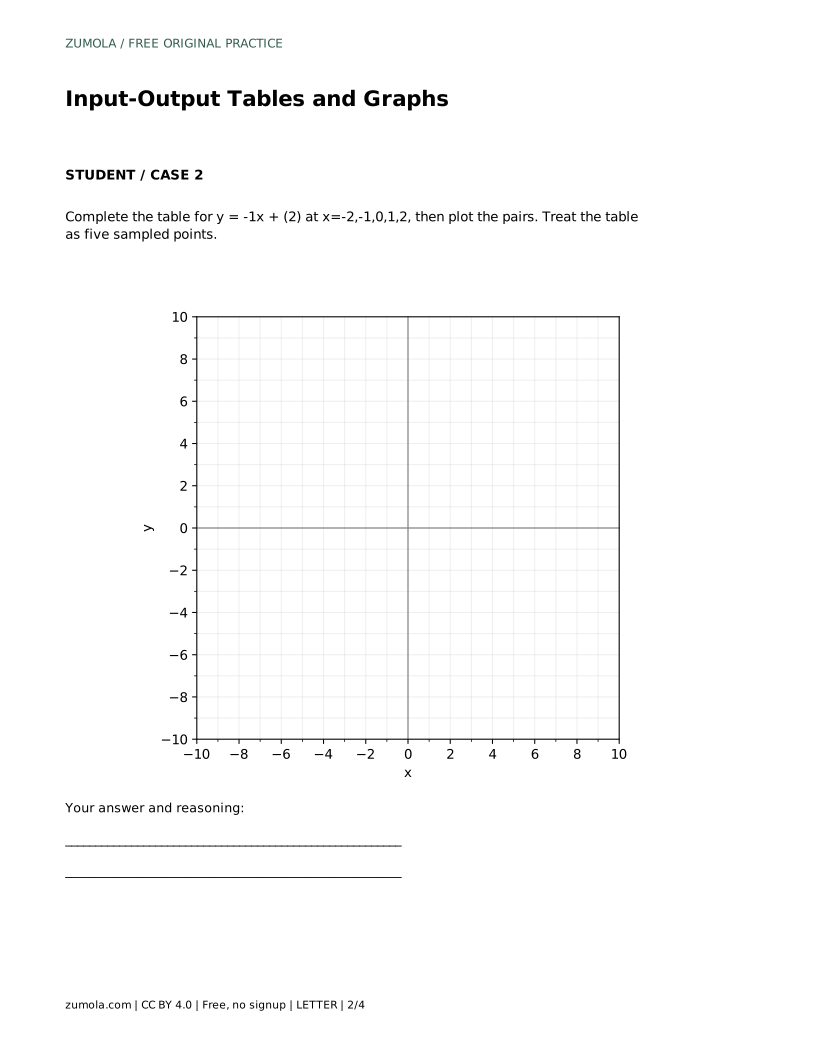
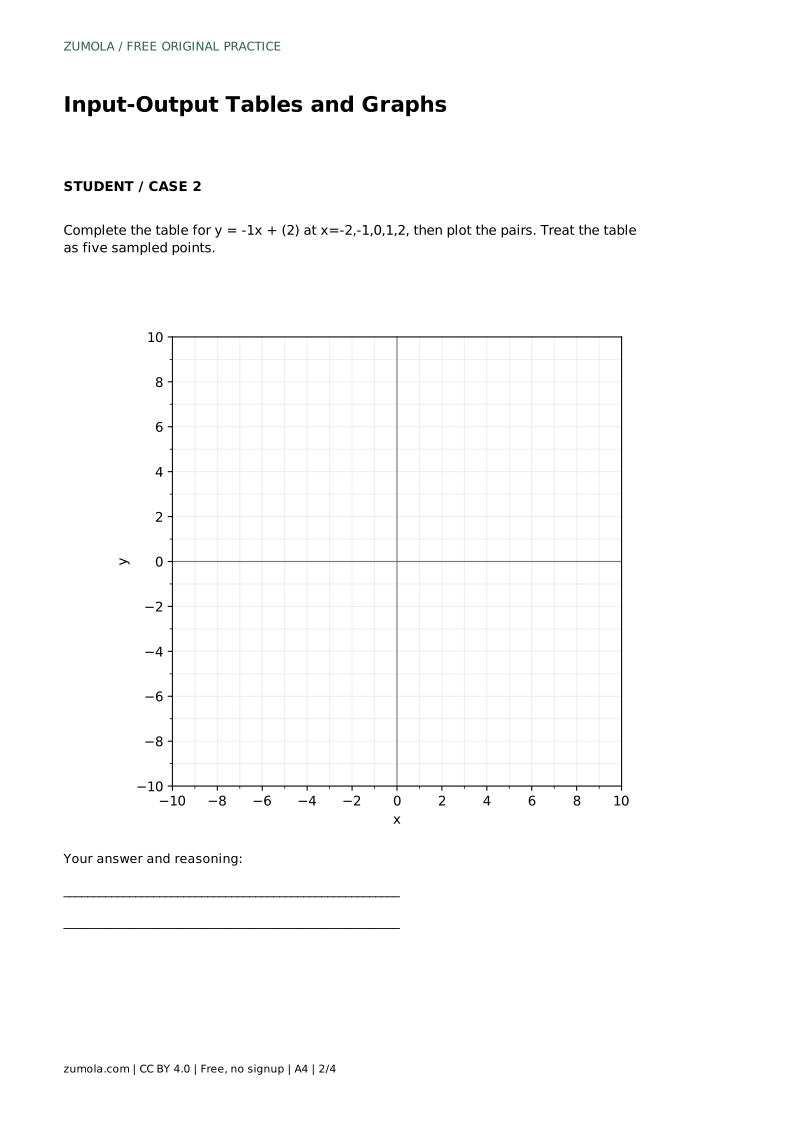
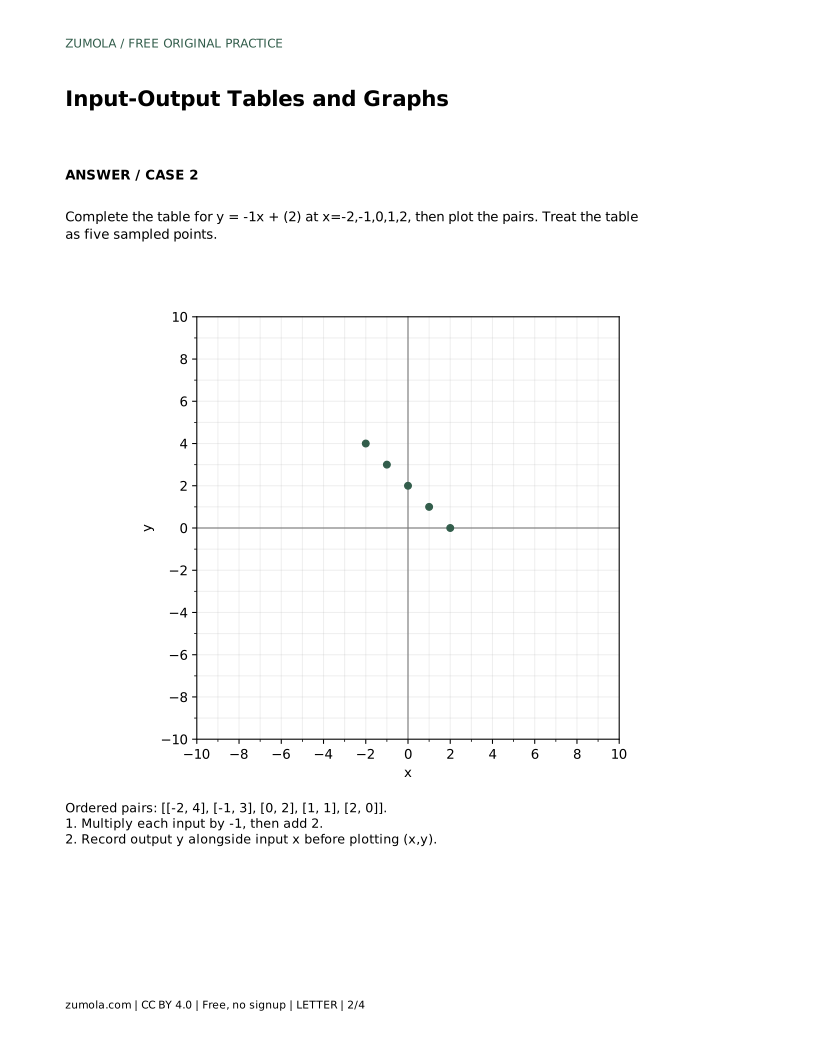
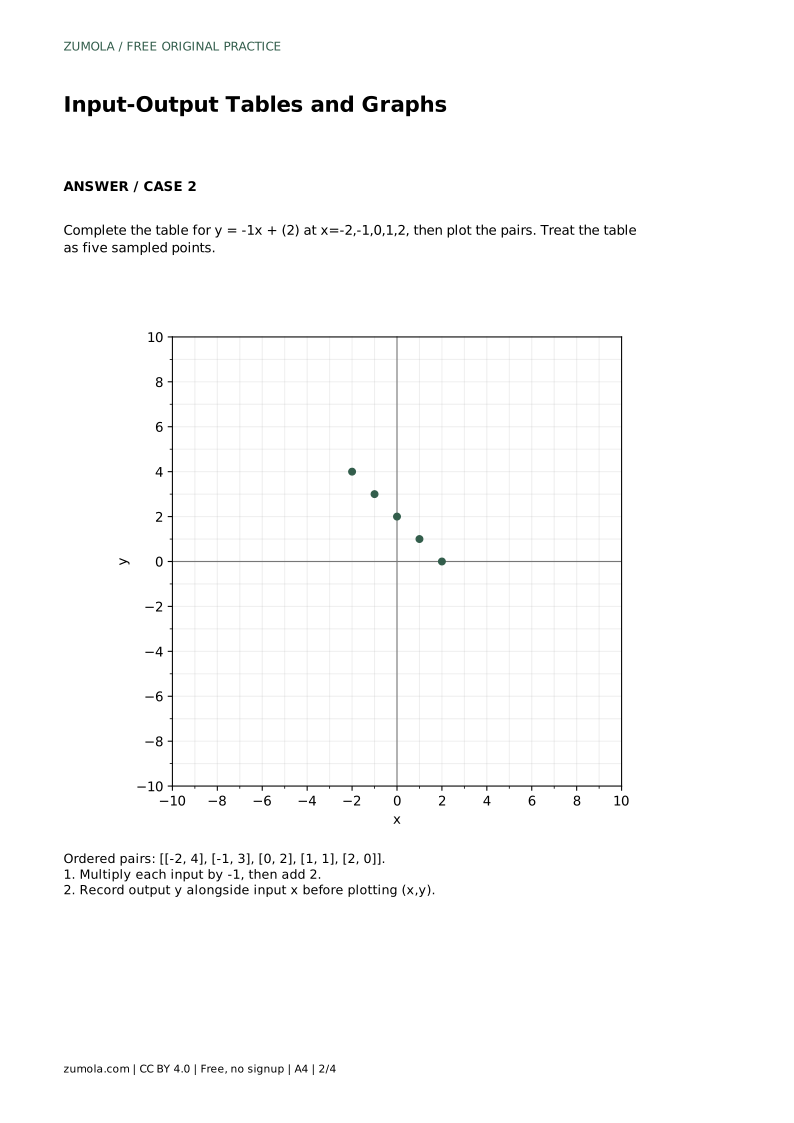
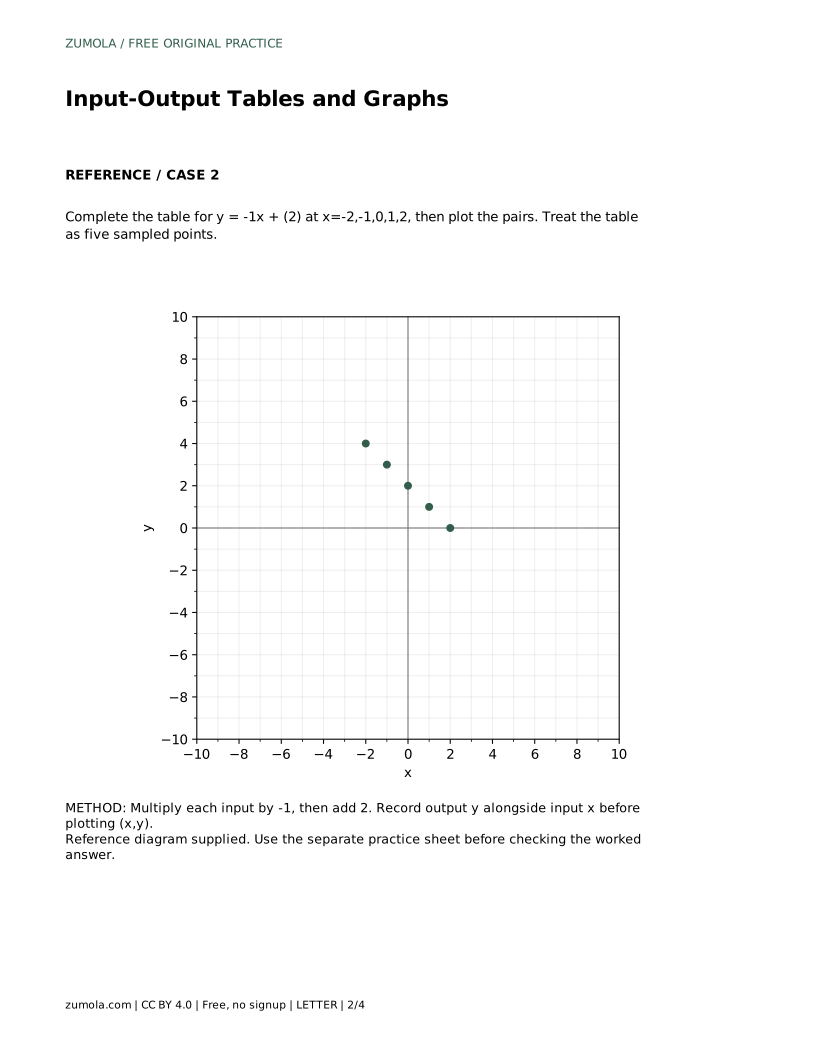
Negative inputs and negative coefficients are the most common source of errors. In y = 2x + 1, substituting x = -1 gives 2(-1) + 1 = -2 + 1 = -1, not -3. Write the substitution in parentheses before simplifying. For a rule such as y = -1x + 2, the pairs are (-2, 4), (-1, 3), (0, 2), (1, 1), (2, 0); the outputs decrease by 1 each time the input increases by 1.
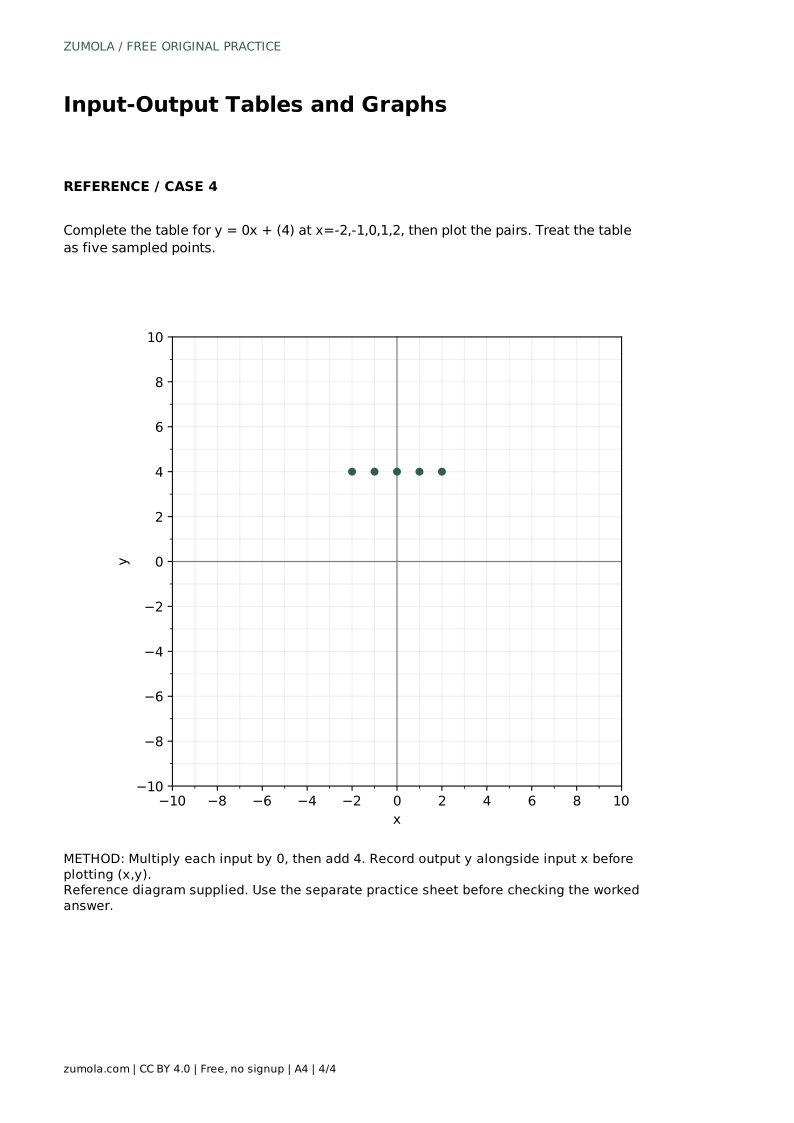
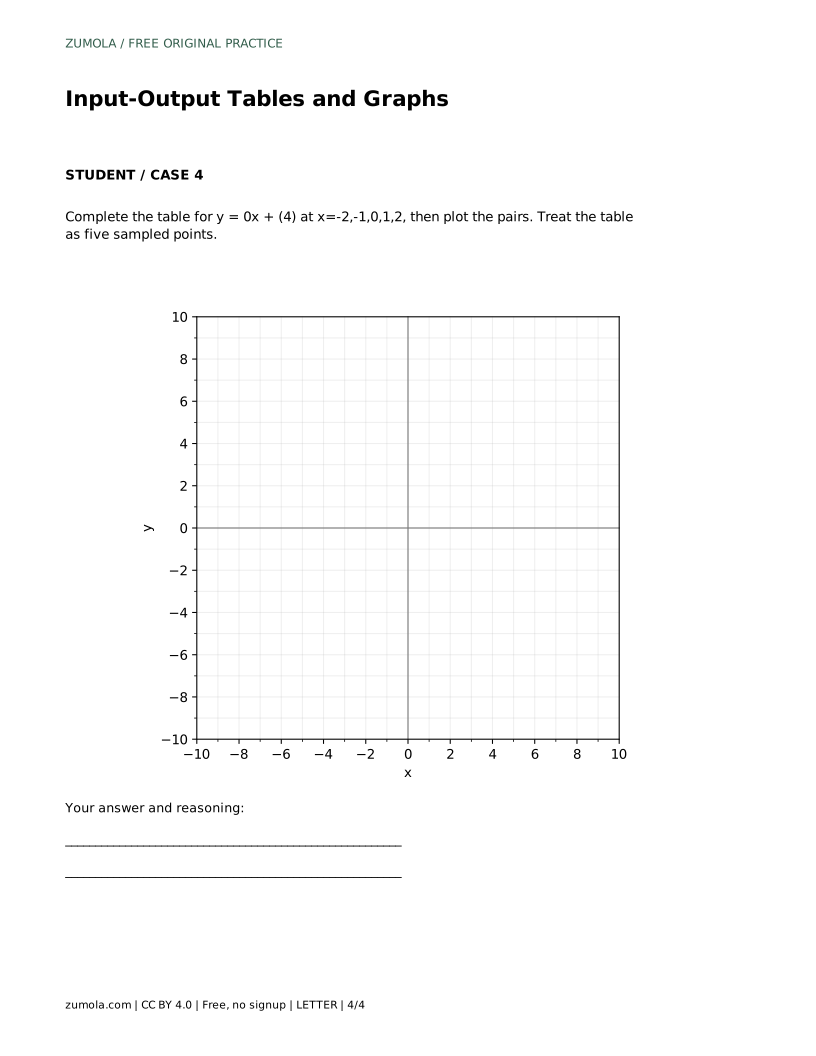
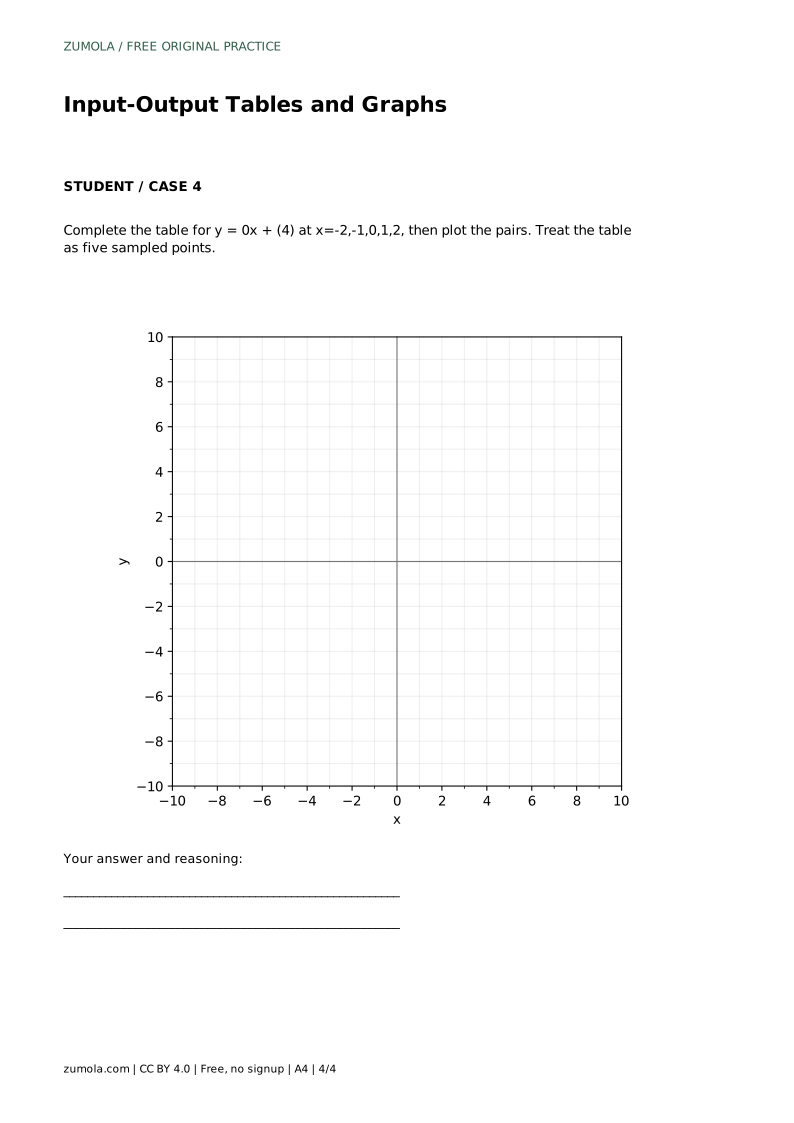
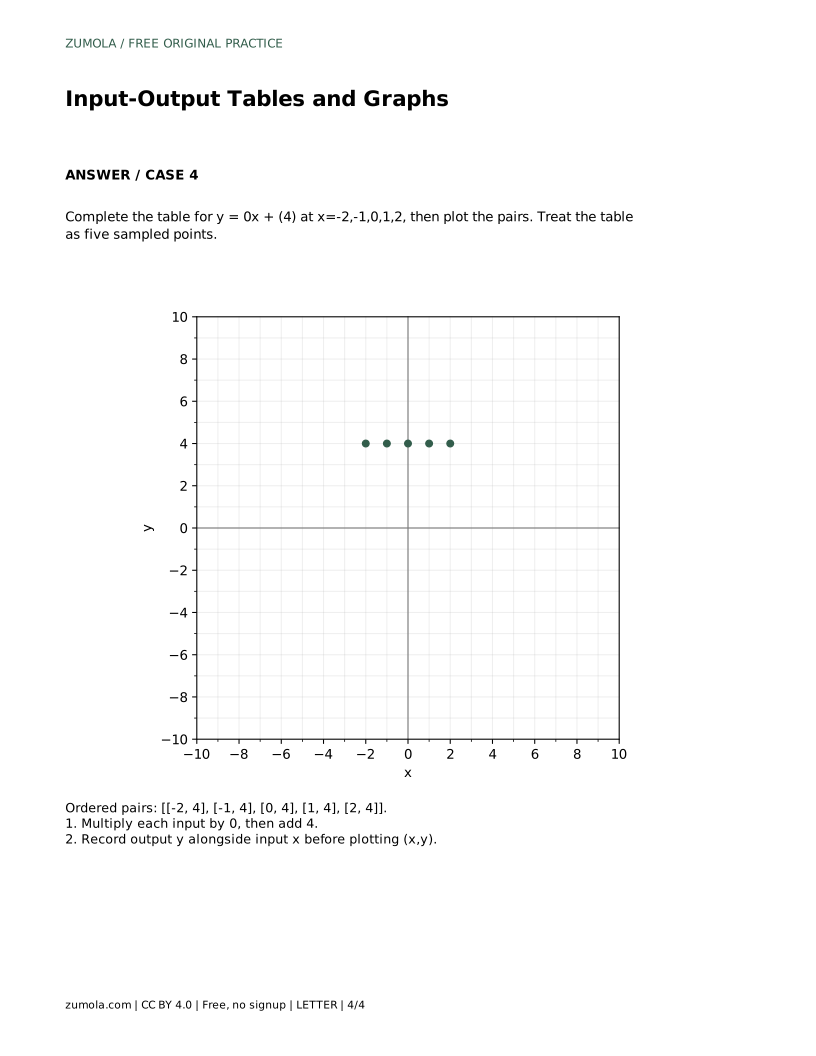
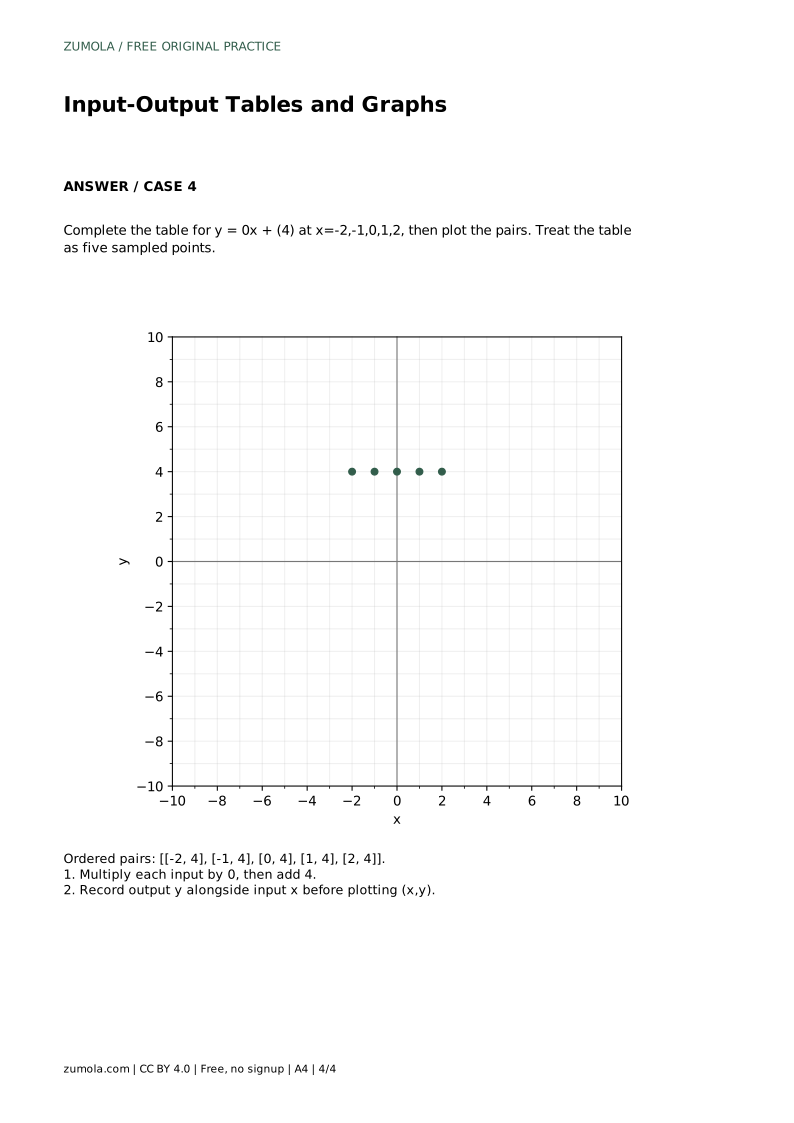
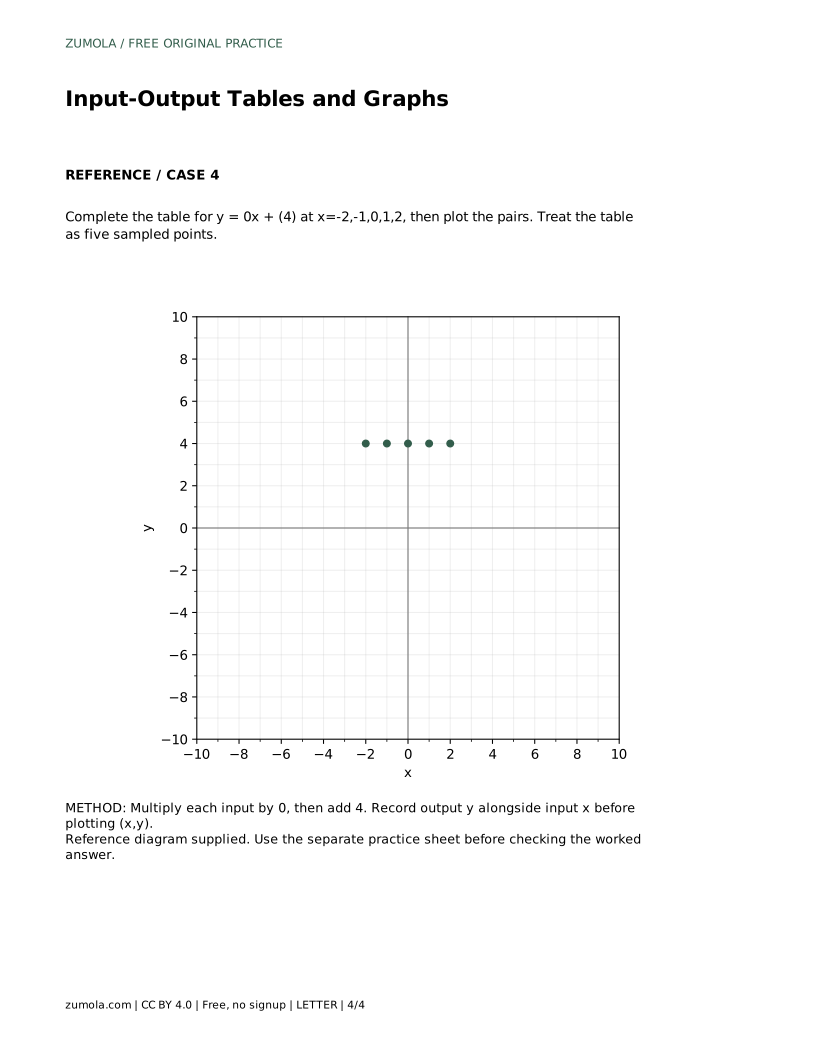
A rule with a zero coefficient, such as y = 0x + 4, gives the same output for every input: (-2, 4), (-1, 4), (0, 4), (1, 4), (2, 4). The plotted points form a horizontal set at y = 4. Recognizing this pattern helps you check whether a table is plausible before plotting.
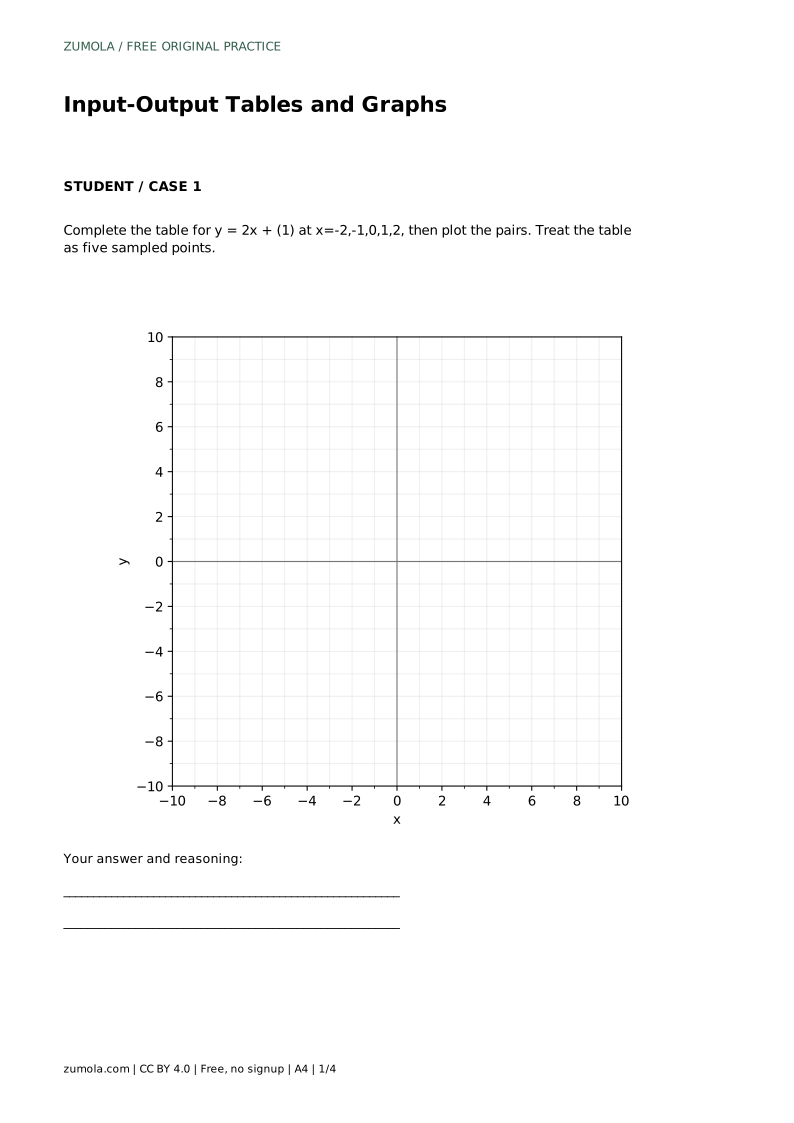
Complete the table for y = 2x + 1 at x = -2, -1, 0, 1, 2, then plot the ordered pairs as five sampled points.
Substitute each input: x = -2 gives 2(-2) + 1 = -4 + 1 = -3; x = -1 gives 2(-1) + 1 = -2 + 1 = -1; x = 0 gives 2(0) + 1 = 1; x = 1 gives 2(1) + 1 = 3; x = 2 gives 2(2) + 1 = 5. The ordered pairs are (-2, -3), (-1, -1), (0, 1), (1, 3), and (2, 5). Plot each pair with the input on the horizontal axis and the output on the vertical axis. The five points are samples; leave them unconnected unless you explicitly assume the rule continues between the listed inputs.
No. The table gives five discrete samples. Connecting them is a separate choice that assumes the rule applies continuously between the listed inputs; state that assumption if you connect them.
That is valid. For y = 0x + 4, every input gives output 4, so the points lie on a horizontal set at y = 4. Each input still has exactly one output.
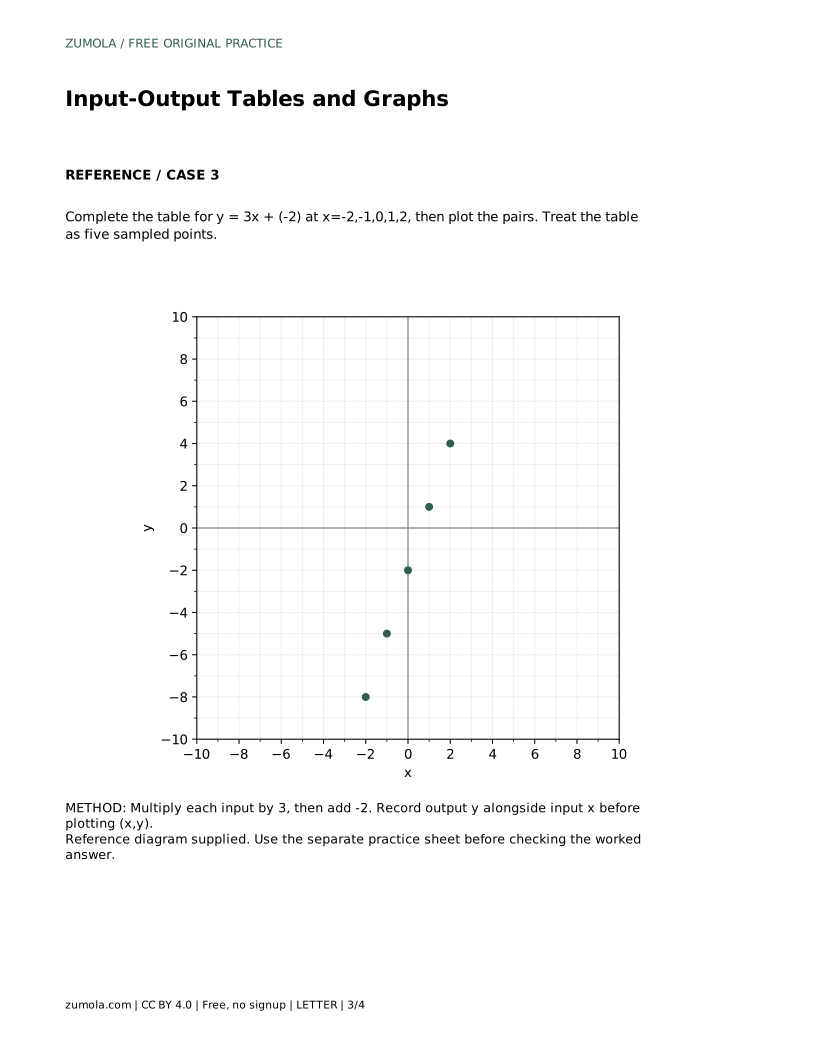
Look at how the output changes as the input increases by 1. For y = 2x + 1, outputs increase by 2 each step; for y = -1x + 2, they decrease by 1. A consistent step size supports a correct table.
All math worksheets · Free coordinate paper
Original resources · CC BY 4.0 · Free for personal and classroom use with attribution.