Reference diagrams
LETTER · Download PDF
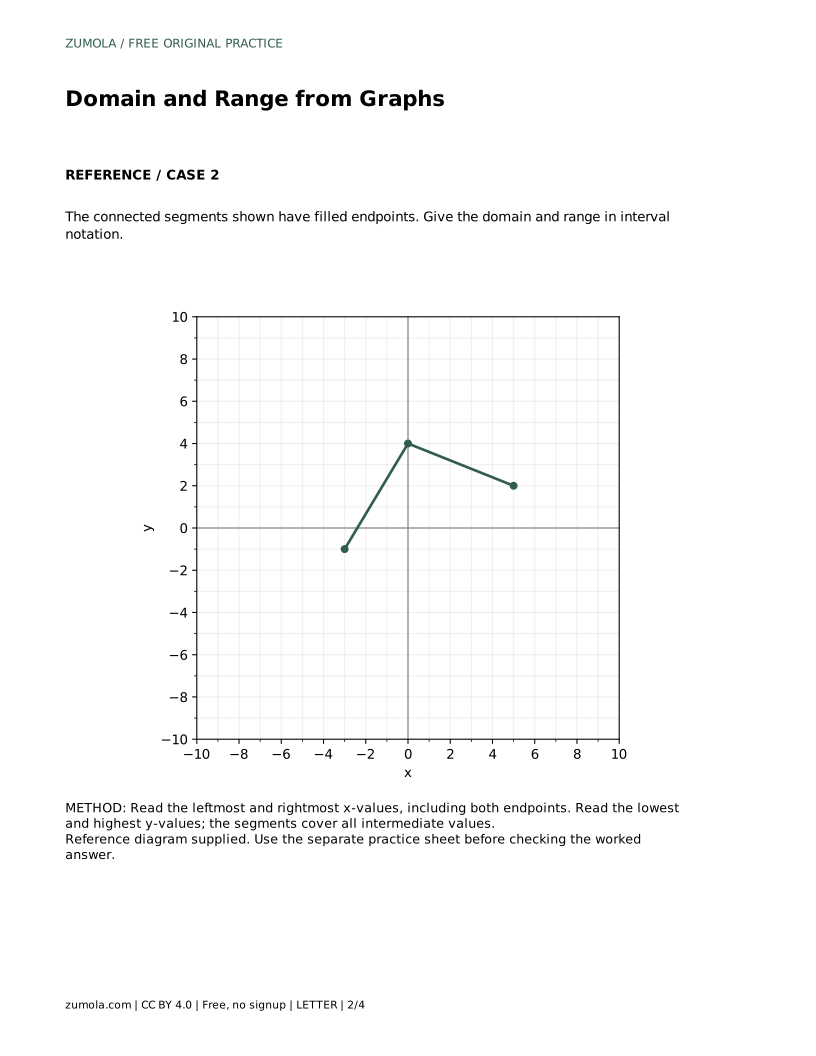
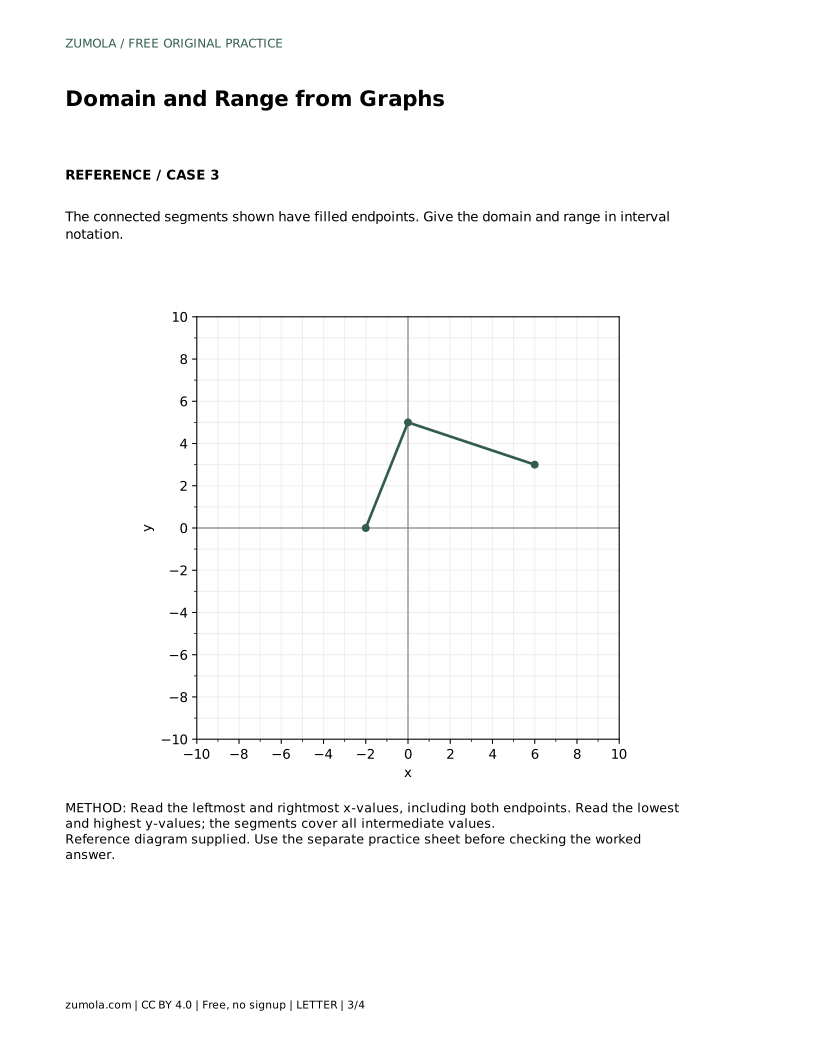
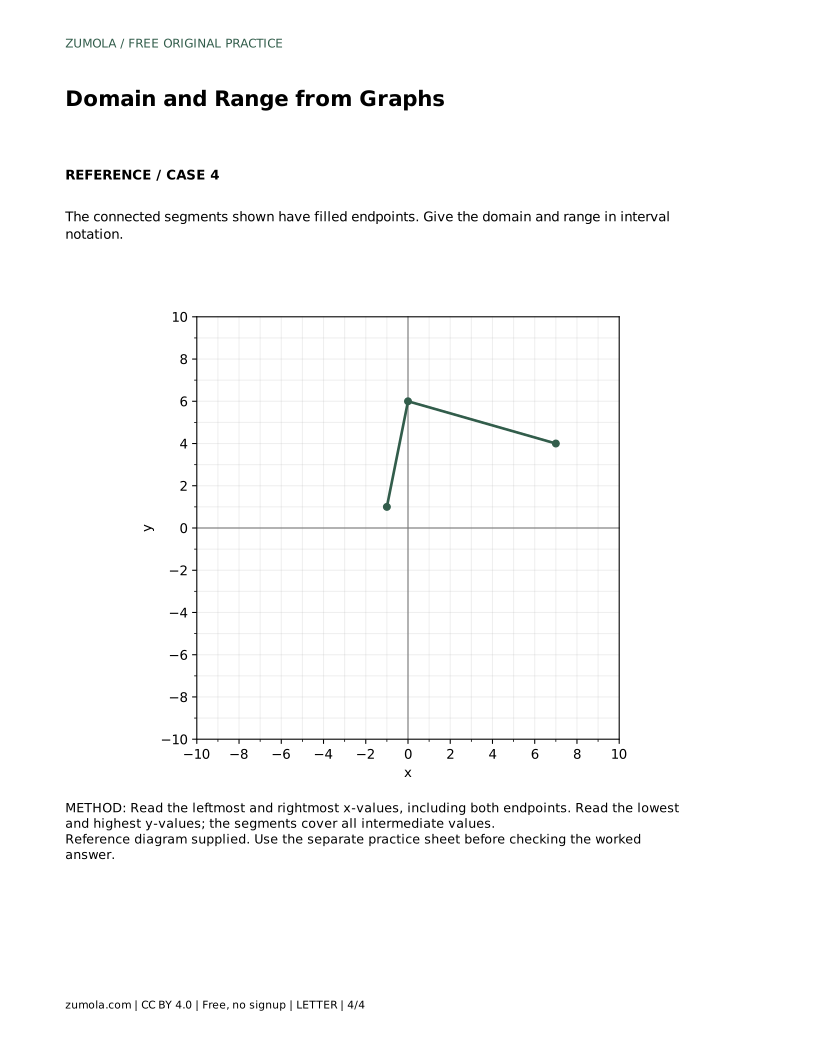
A4 · Download PDF
Free original resources
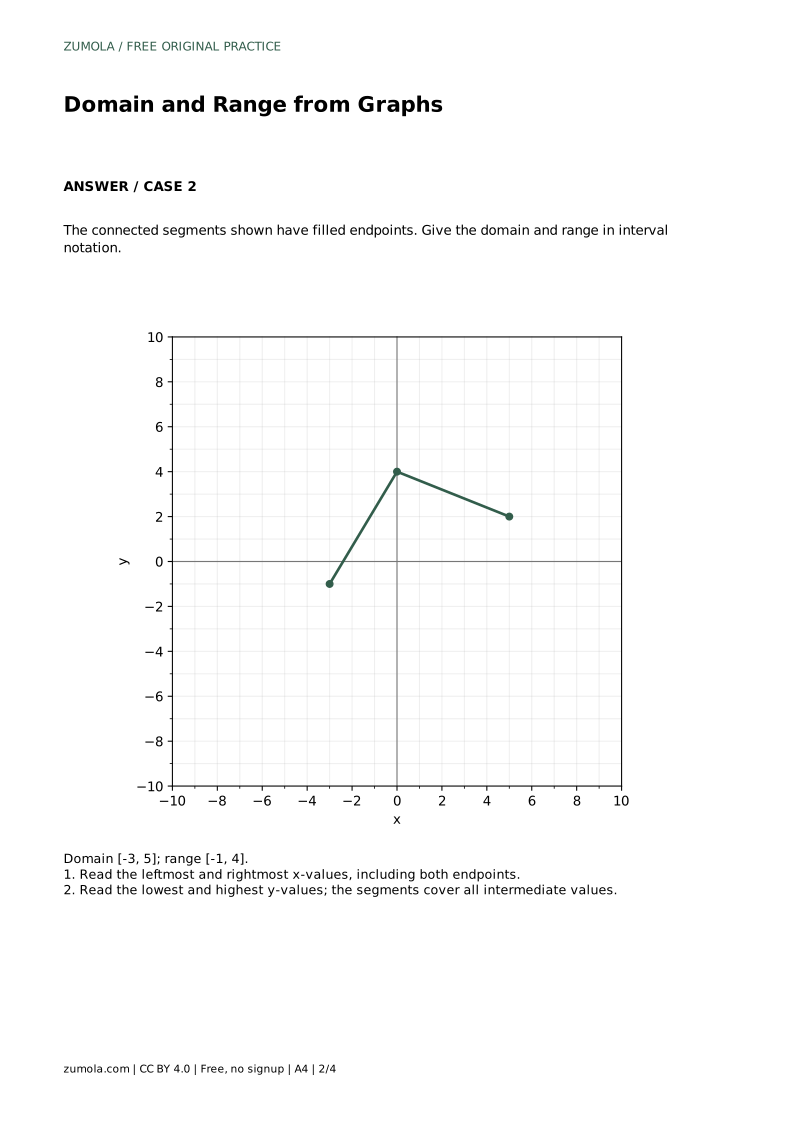
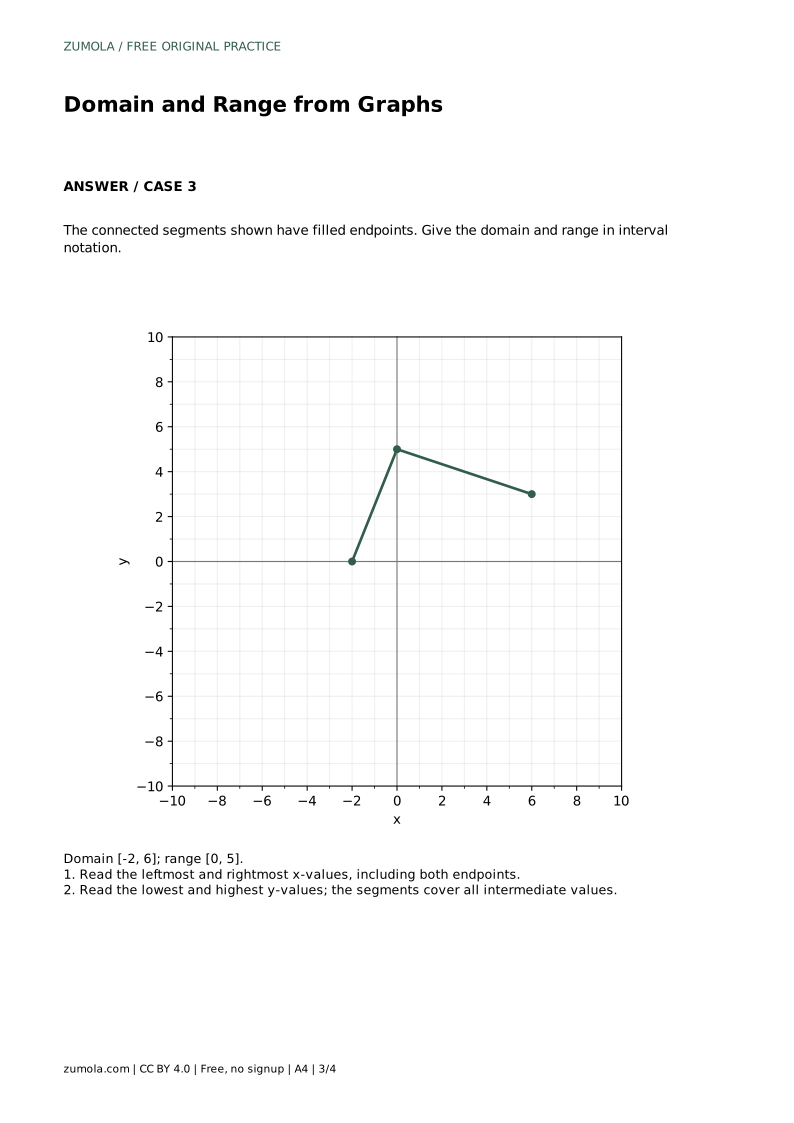
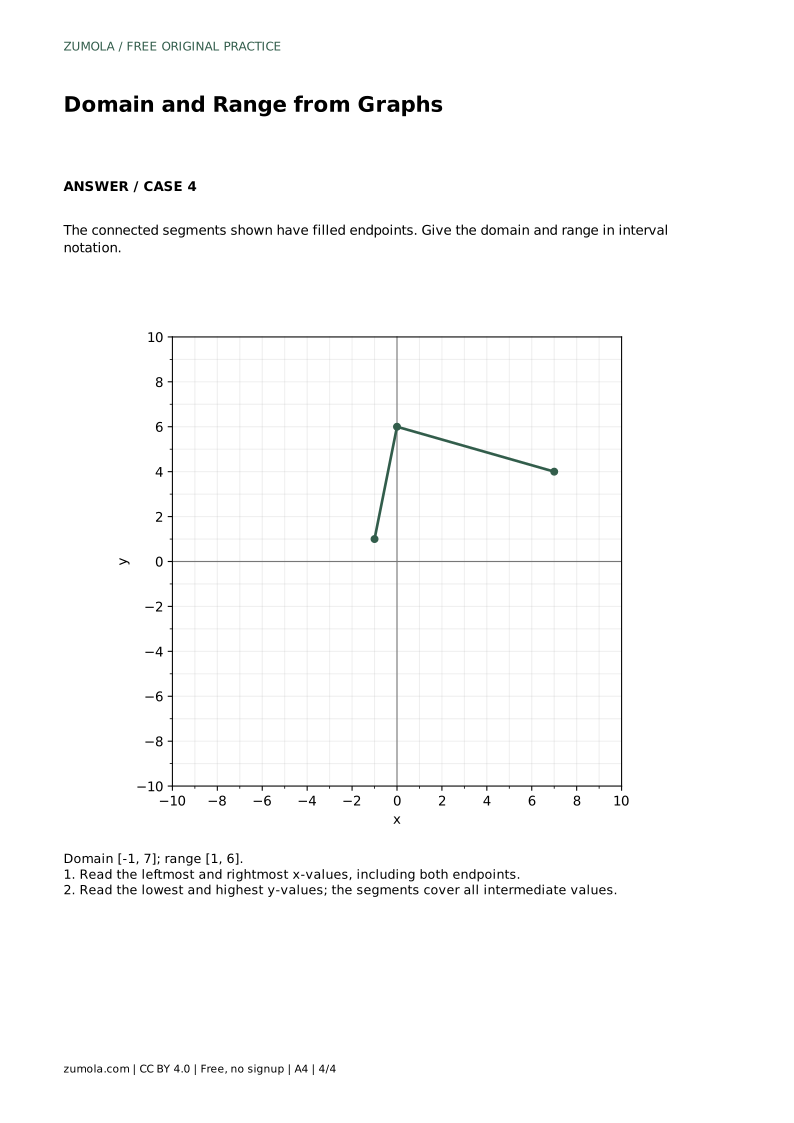
Learn to read a graph's leftmost and rightmost x-values for domain and lowest and highest y-values for range, then write both in interval notation with correct brackets.
Four original cases, with reference diagrams, practice sheets and worked answers. Everything is free; no signup required.
LETTER · Download PDF
A4 · Download PDF
LETTER · Download PDF
A4 · Download PDF
LETTER · Download PDF
A4 · Download PDF
Use A4 or US Letter to match your printer. Graph coordinates determine the answers; these worksheets are not physical measuring rulers.
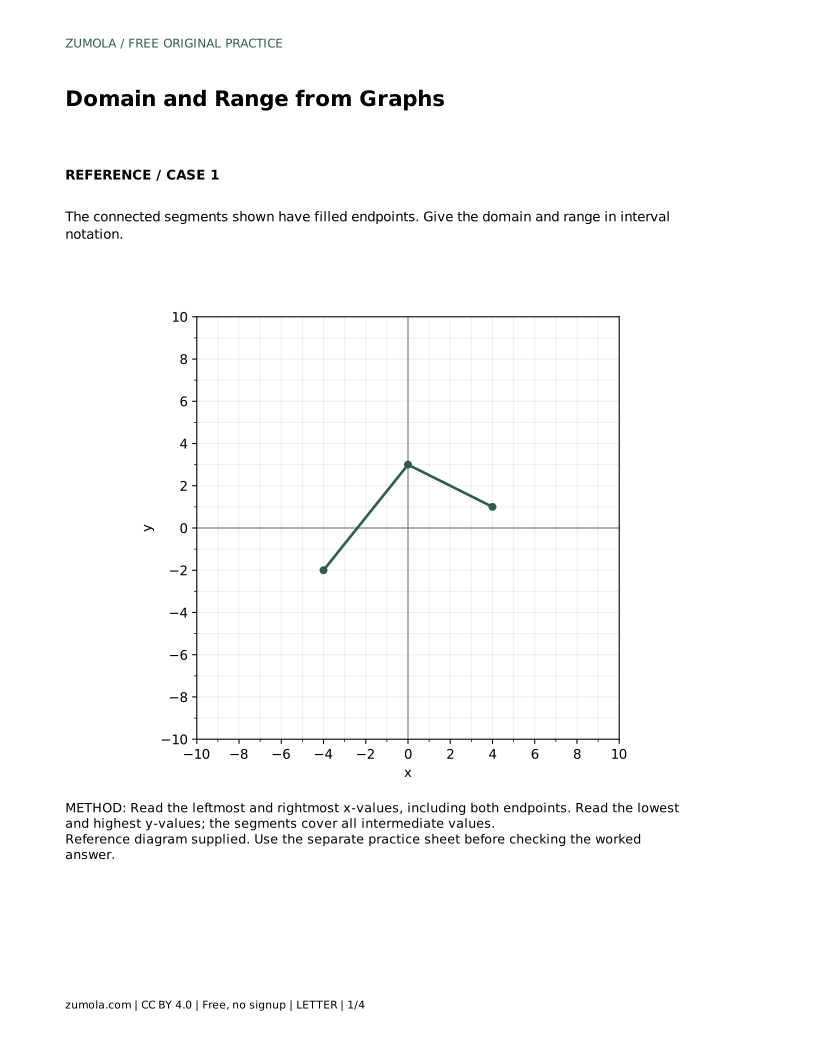

A graph shows a function's input and output values visually. The domain is the set of x-values the graph actually uses, read from left to right. The range is the set of y-values, read from bottom to top. For a connected graph with filled endpoints, both endpoints are included, so interval notation uses square brackets. This page explains how to read those endpoints carefully, how to check that intermediate values are covered, and how to avoid the most common bracket and axis errors.
The domain answers a simple question: which x-values appear somewhere on the graph? Trace the graph from its leftmost point to its rightmost point and note the smallest and largest x-coordinates. On a connected graph, every x-value between those two extremes is used, so the domain is one interval rather than a list of separate numbers.
Endpoints matter. A filled dot includes that point; an open circle excludes that point. For each extreme x-value or y-value, check whether any included point on the graph attains it. Use a square bracket when that value is attained and a parenthesis otherwise. Arrows, or an explicit statement of continued behavior, indicate an unbounded graph; the edge of a cropped drawing alone does not.
The range works the same way on the vertical axis. Find the lowest y-value the graph reaches and the highest y-value it reaches. For a connected graph, all y-values between those extremes occur somewhere, so the range is also a single interval.
Do not confuse the range with the y-coordinates of the endpoints alone. The lowest or highest point may occur in the middle of the graph, at a peak or a valley, rather than at either end. Scan the whole curve before deciding. As with the domain, filled endpoints are included and open endpoints are excluded.
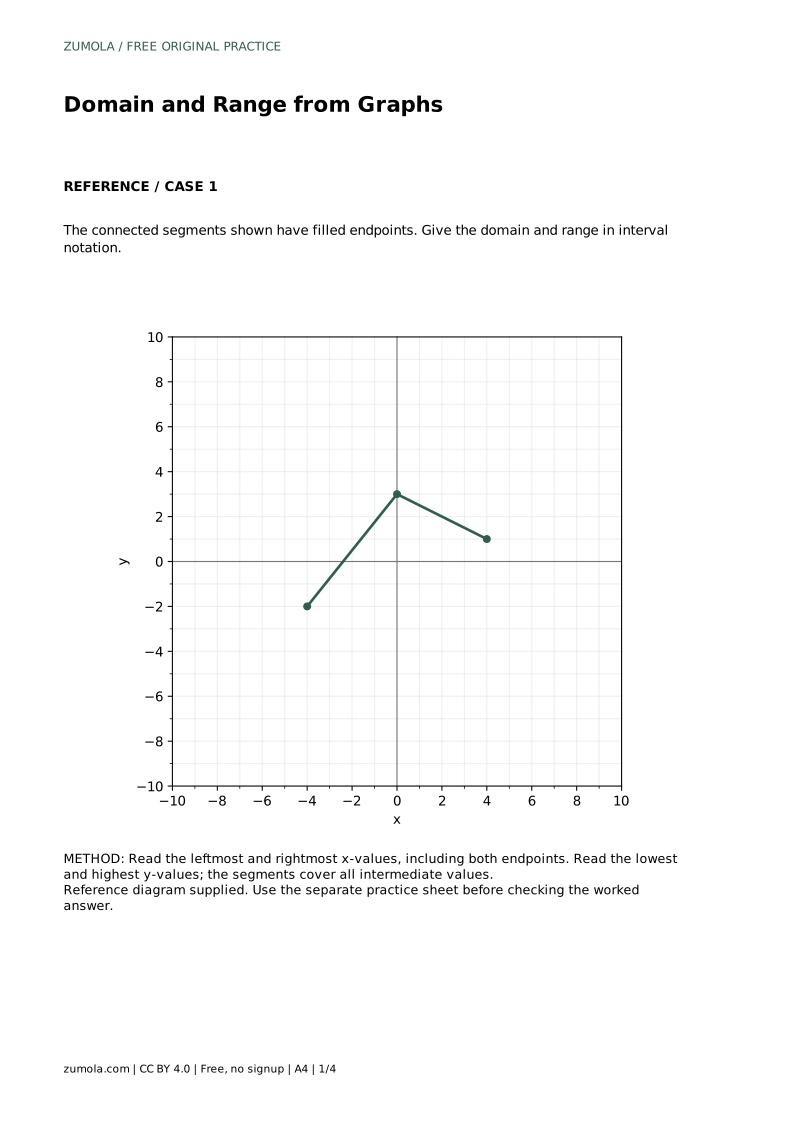
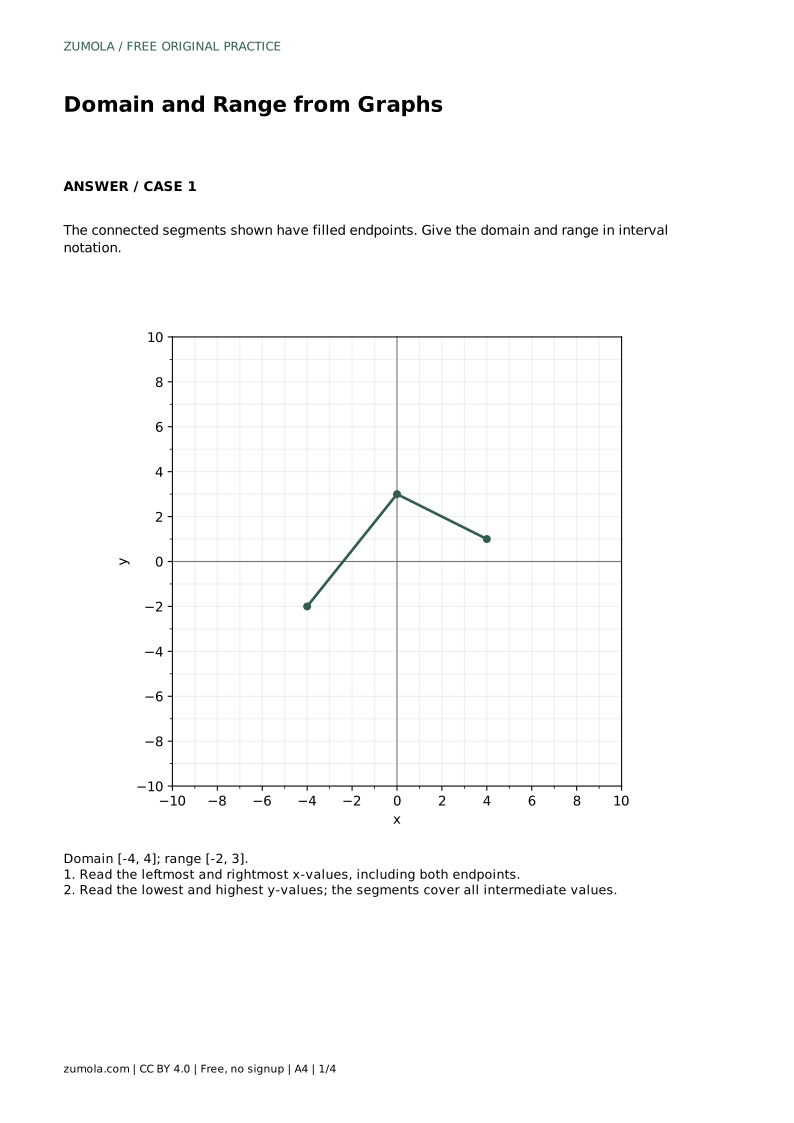
Interval notation lists the smaller value first and the larger value second, separated by a comma. Square brackets mean the endpoint is included; parentheses mean it is excluded. For example, a domain from x = -4 to x = 4 with both endpoints filled is written [-4, 4], and a range from y = -2 to y = 3 with both endpoints filled is written [-2, 3].
Keep the two answers separate and label them. A common slip is to swap the domain and range, or to write the range using x-values. Say the domain aloud as x-values and the range as y-values before writing. Also check the order: the smaller number always comes first, even when it is negative.
After writing both intervals, test them against the picture. Pick an x-value inside your domain and confirm the graph has a point at that x. Pick a y-value inside your range and confirm some point on the graph reaches that height. If a value falls outside your interval but the graph clearly passes through it, your endpoints are wrong.
Check each interval boundary separately. A range boundary can be reached at an interior peak or valley, even when a different endpoint is open. Do not count endpoint symbols to decide the number of brackets: ask whether the entire graph includes any point with that boundary coordinate.
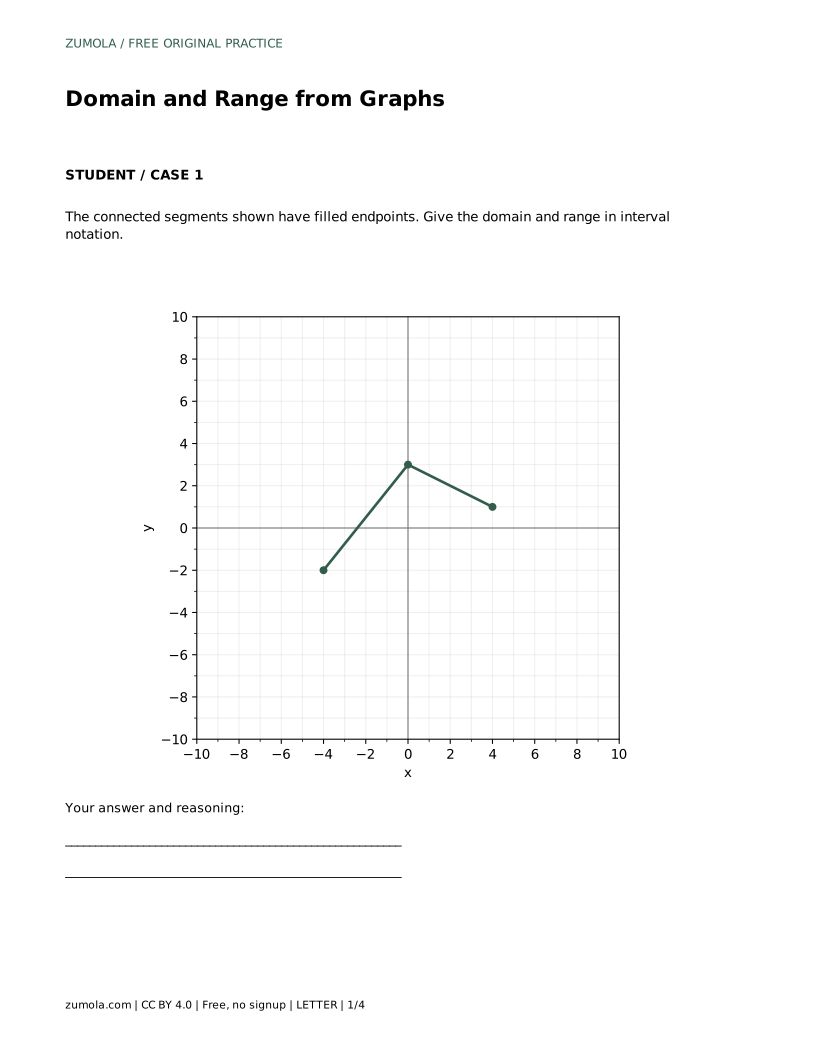
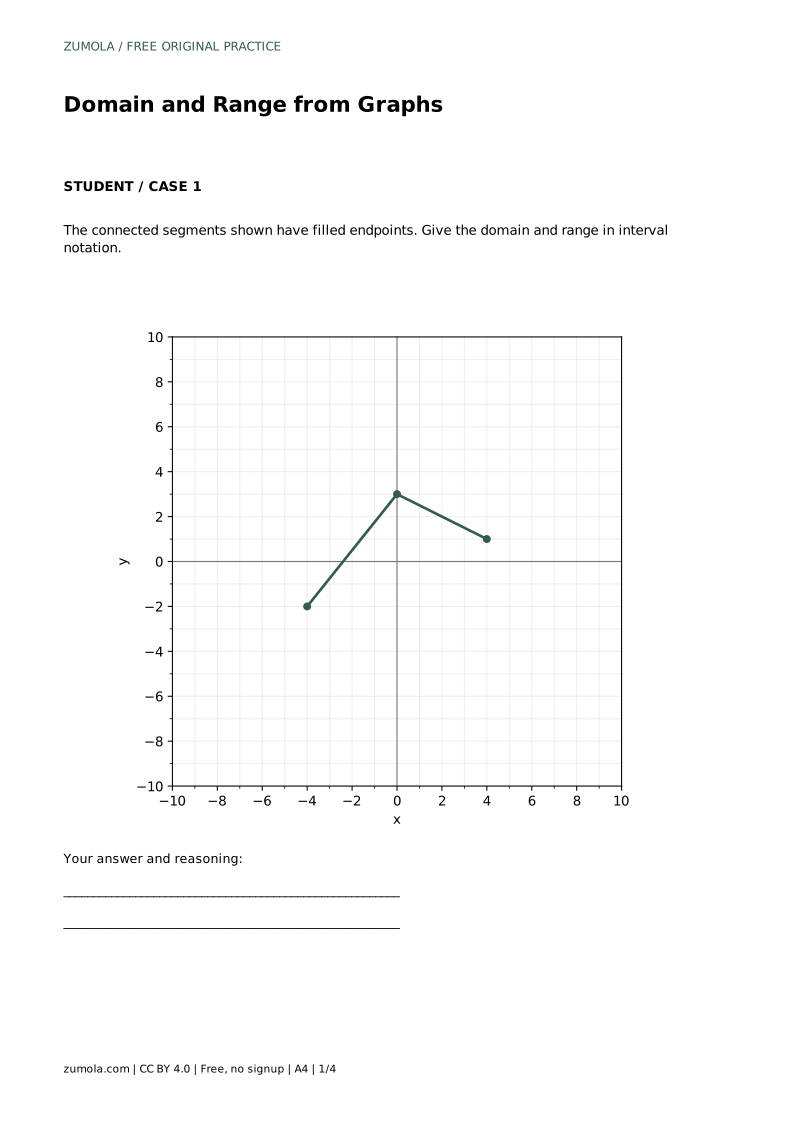
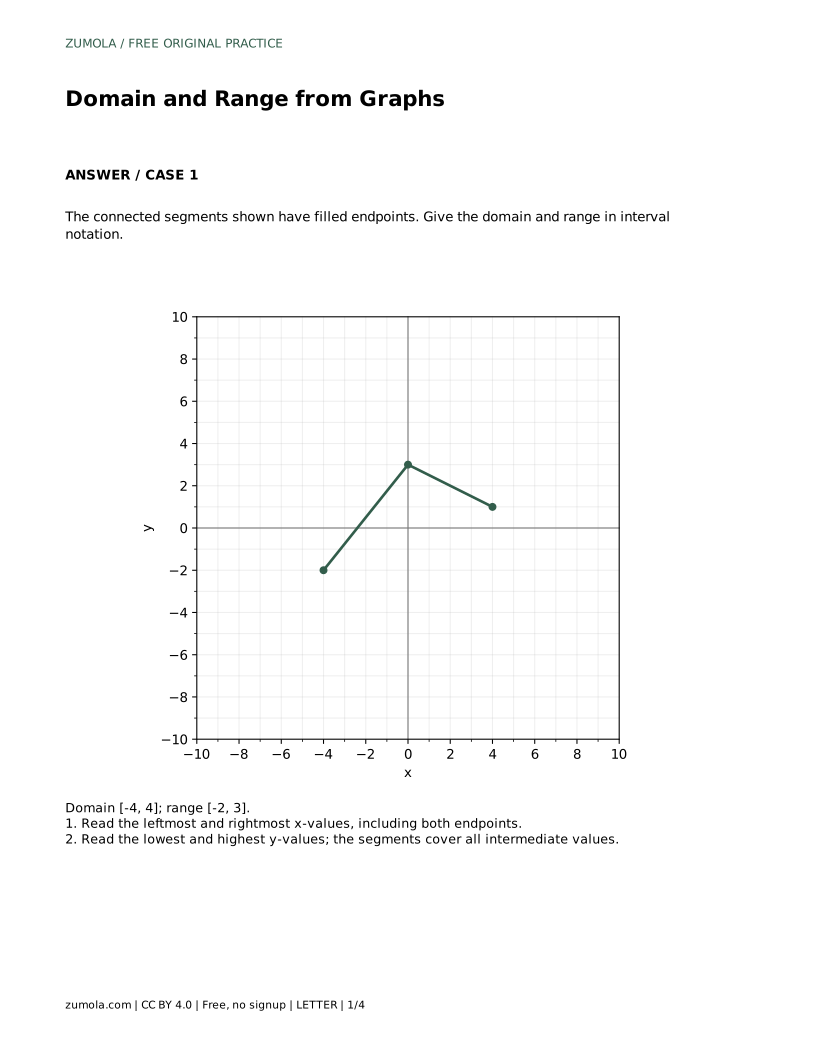
A graph joins the vertices (-4, -2), (0, 3), and (4, 1) with line segments. Both outer endpoints are filled and all three vertices are included. Give the domain and range in interval notation.
Domain: [-4, 4]. The leftmost x-value is -4 and the rightmost is 4, both at filled endpoints, and the connected segments cover every x-value between them. Range: [-2, 3]. The lowest y-value is -2 at the left endpoint and the highest is 3 at the middle point (0, 3), and the connected segments cover every height between them. Both endpoints are included, so both intervals use square brackets.
A filled endpoint is included in the interval, so that side uses a square bracket. An open circle is excluded and uses a parenthesis.
Infinity is not a reachable number, so it can never be included. Intervals extending without bound always use a parenthesis on that side.
If the graph is one connected curve or set of joined segments with no breaks, it passes through every intermediate x-value and y-value between its extremes.
All math worksheets · Free coordinate paper
Original resources · CC BY 4.0 · Free for personal and classroom use with attribution.