Reference diagrams
LETTER · Download PDF
A4 · Download PDF
Free original resources
Learn to graph arithmetic sequences as separate points, write the nth-term formula, and check slope, intercept, and domain assumptions with clear worked reasoning.
Four original cases, with reference diagrams, practice sheets and worked answers. Everything is free; no signup required.
LETTER · Download PDF
A4 · Download PDF
LETTER · Download PDF
A4 · Download PDF
LETTER · Download PDF
A4 · Download PDF
Use A4 or US Letter to match your printer. Graph coordinates determine the answers; these worksheets are not physical measuring rulers.

An arithmetic sequence changes by the same amount from one term to the next. Graphing it means plotting each term against its position number, so the horizontal axis shows n and the vertical axis shows the term value. The points lie on a straight line, but the sequence itself is discrete, so the graph should show separate points rather than a connected line. This page explains the method, the formula, and the checks that keep the graph accurate.
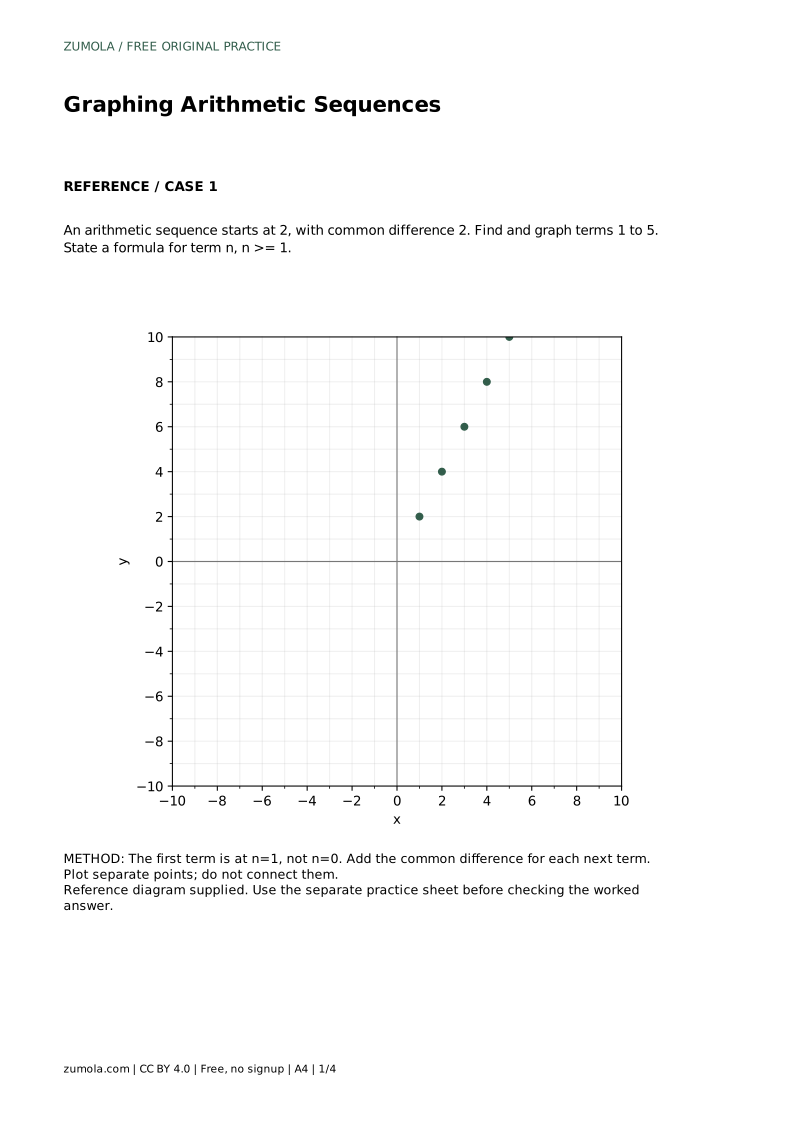
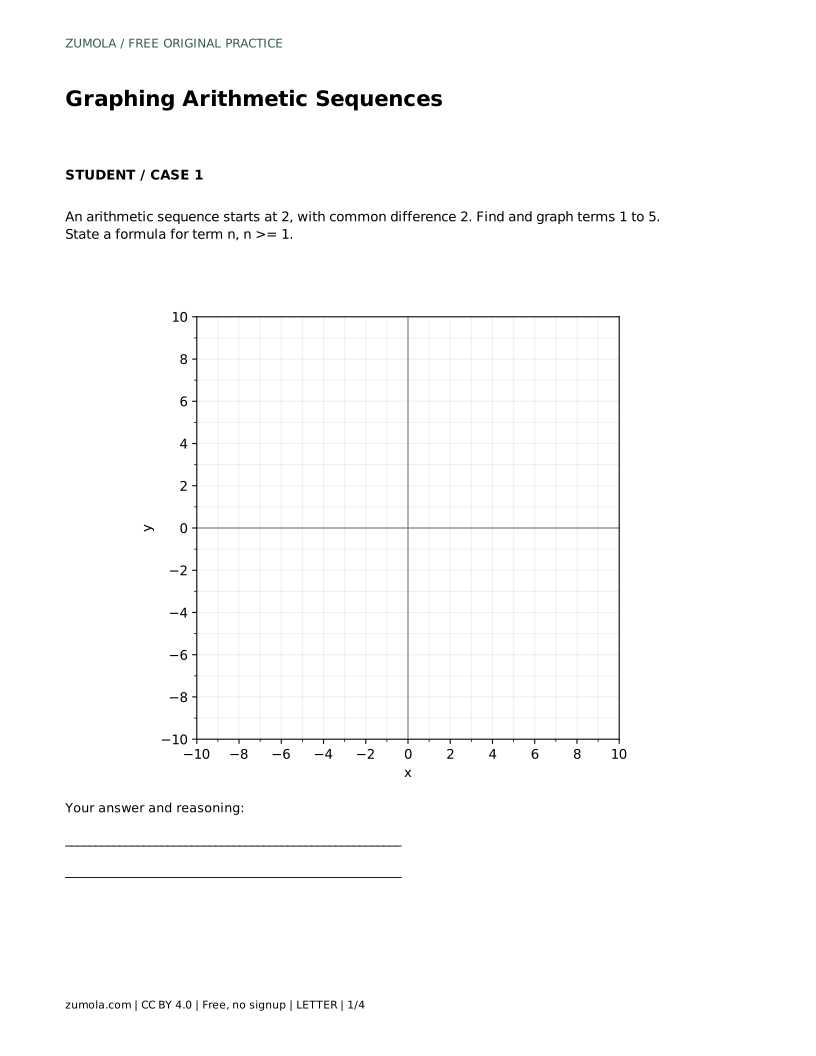
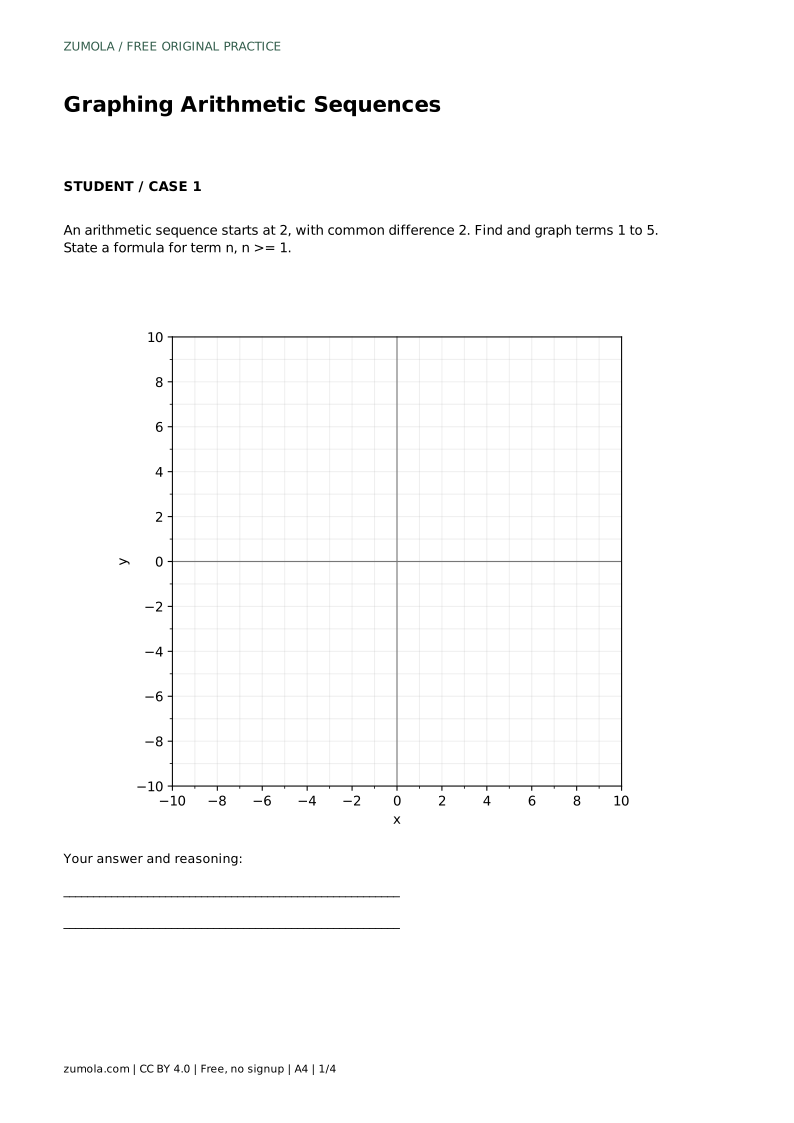
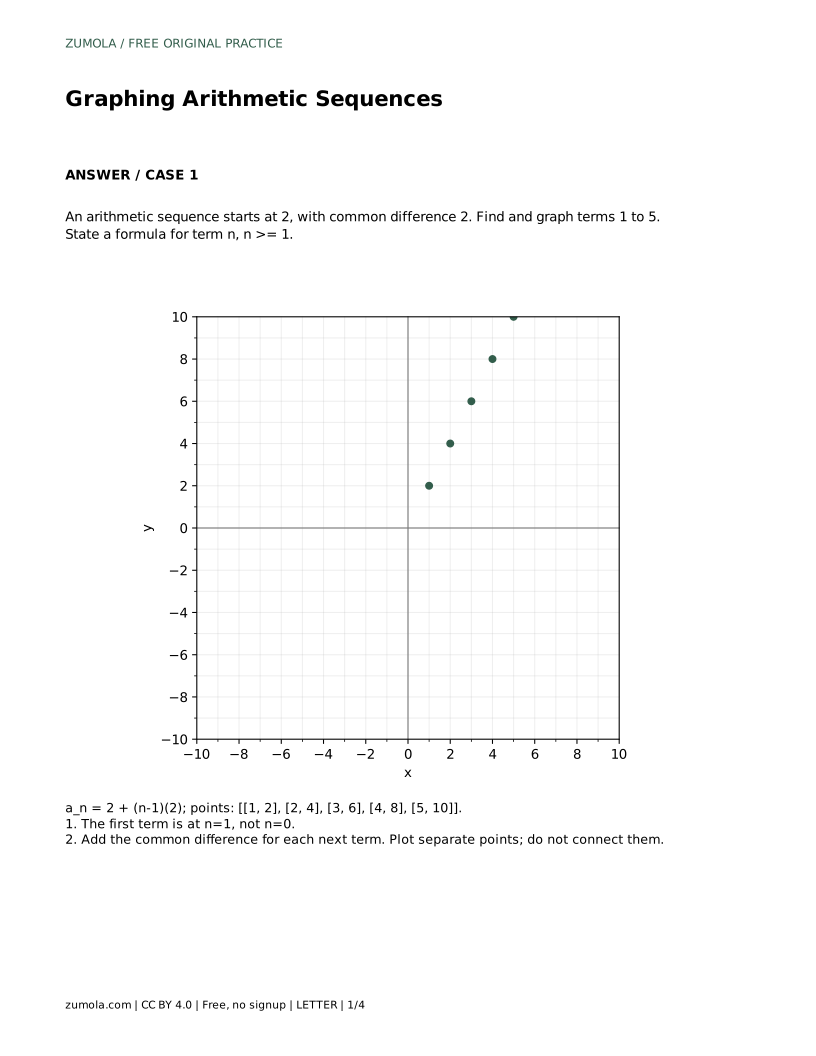
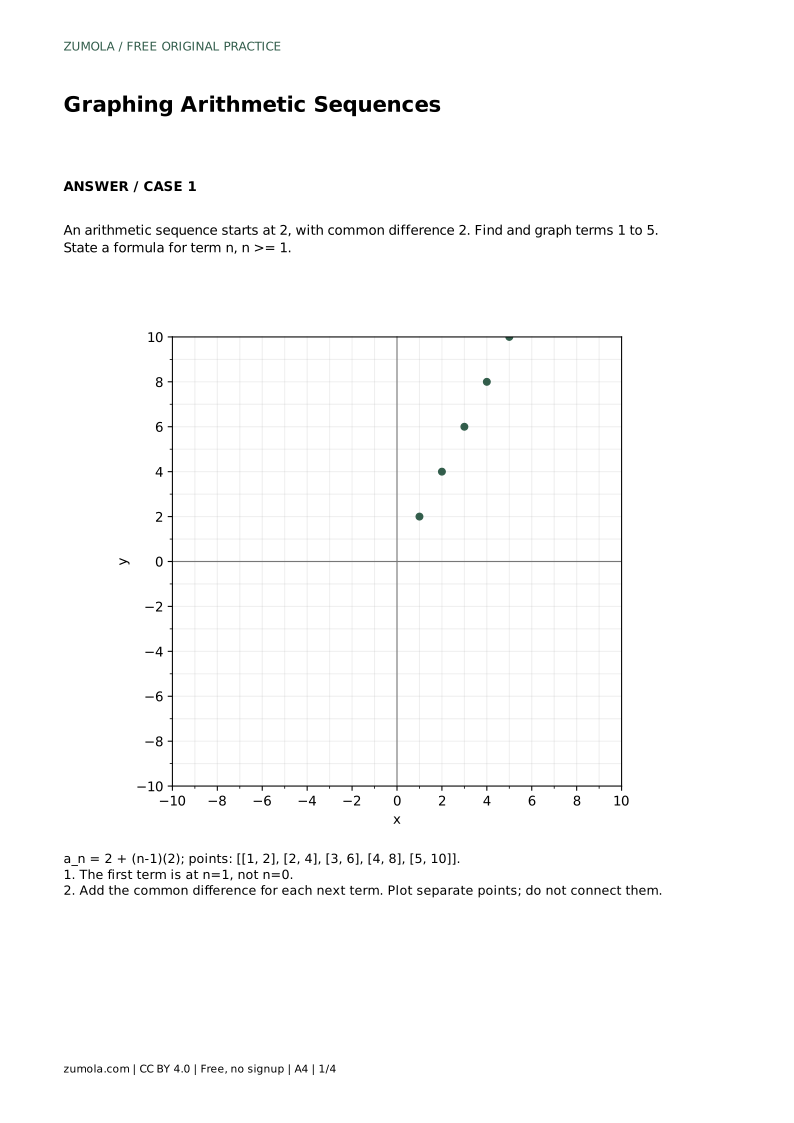
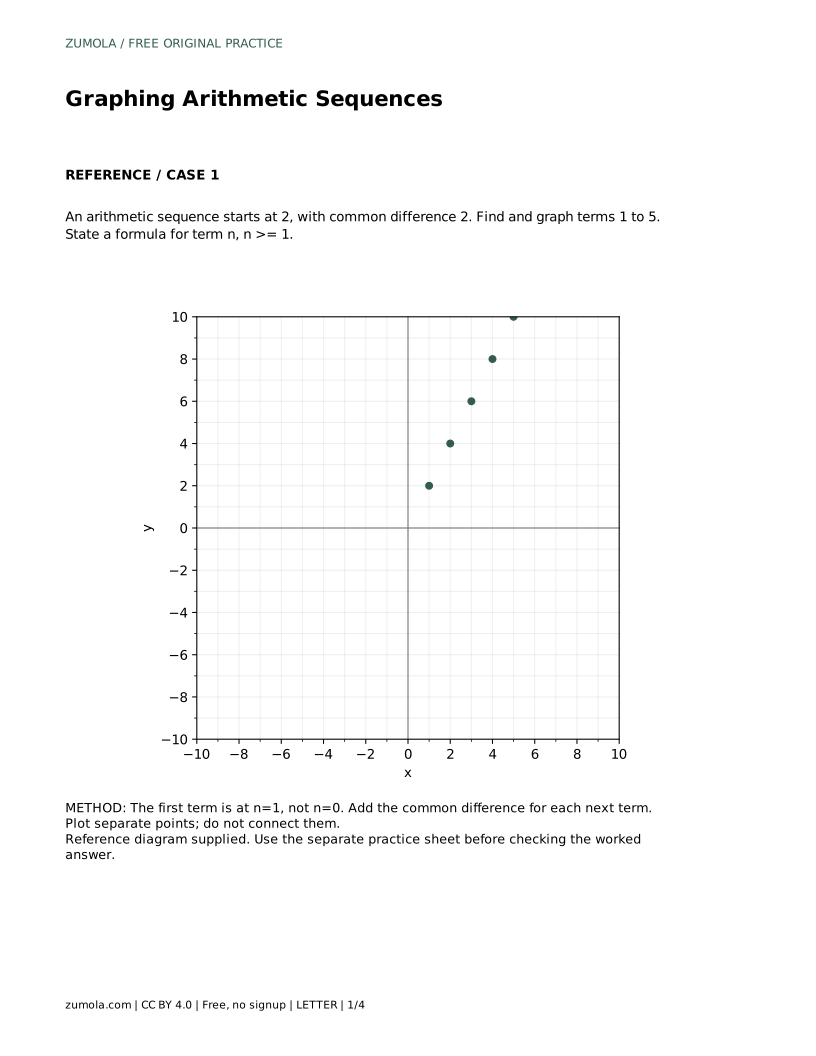
Use the horizontal axis for term position n and the vertical axis for the term value a_n. The first term belongs at n = 1, not n = 0, unless a problem explicitly changes the indexing. For the sequence starting at 2 with common difference 2, the first five points are (1, 2), (2, 4), (3, 6), (4, 8), and (5, 10).
Because n counts positions, only positive whole-number positions belong to the sequence graph. The points may appear to lie on a line, but the sequence does not include values between positions. Plot separate dots and leave gaps between them. If you connect the dots, you are drawing a related continuous function, not the sequence itself.
For an arithmetic sequence with first term a_1 and common difference d, the formula is a_n = a_1 + (n - 1)d for n greater than or equal to 1. The multiplier (n - 1) matters because the first term has no difference added yet. Substituting n = 1 gives a_1 + 0d = a_1, which confirms the indexing.
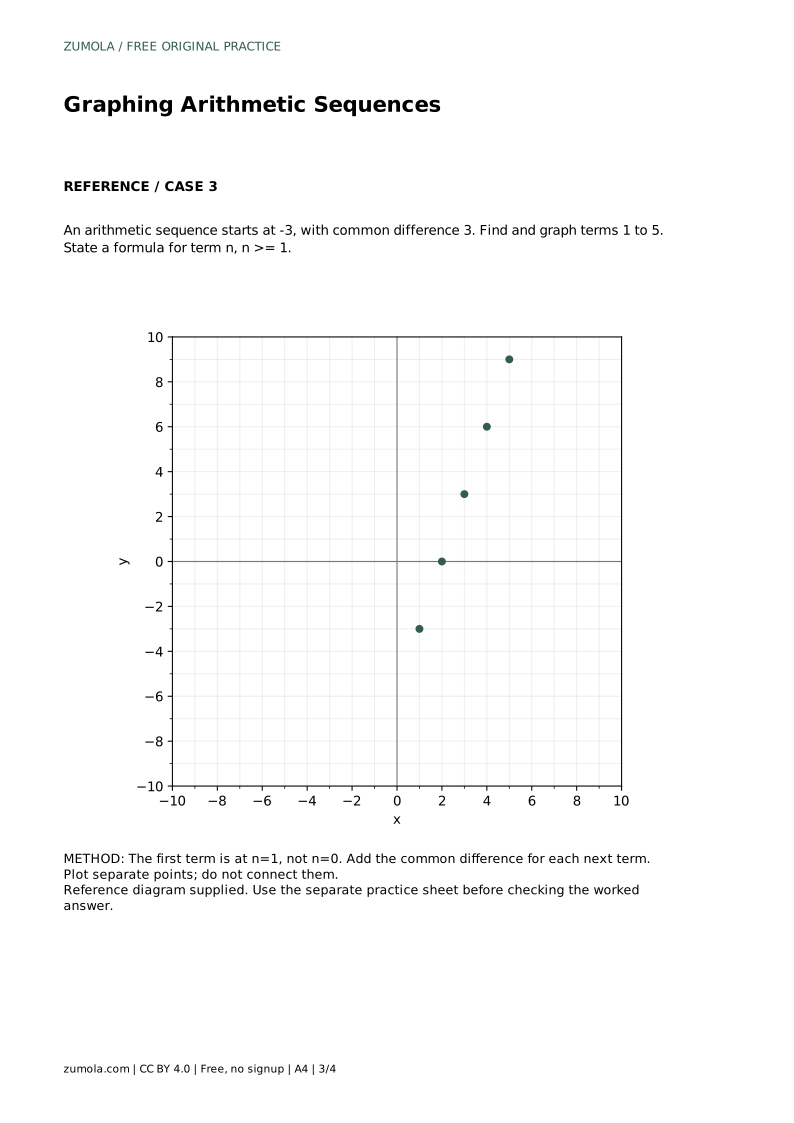
The formula also predicts the graph's shape. Expanding gives a_n = dn + (a_1 - d), so the vertical change per one-step increase in n is d. A positive d makes the points rise from left to right; a negative d makes them fall; d = 0 makes them level. The formula is a check on the plotted points, not a replacement for plotting them.
If you extend the pattern to a line through the points, its slope equals the common difference d. The vertical intercept of that line is a_1 - d, which is generally not the first term. For the sequence 2, 4, 6, 8, 10, the slope is 2 and the line's vertical intercept is 0, while the first plotted term is 2 at n = 1. Confusing the first term with the intercept is a common source of graphing errors.
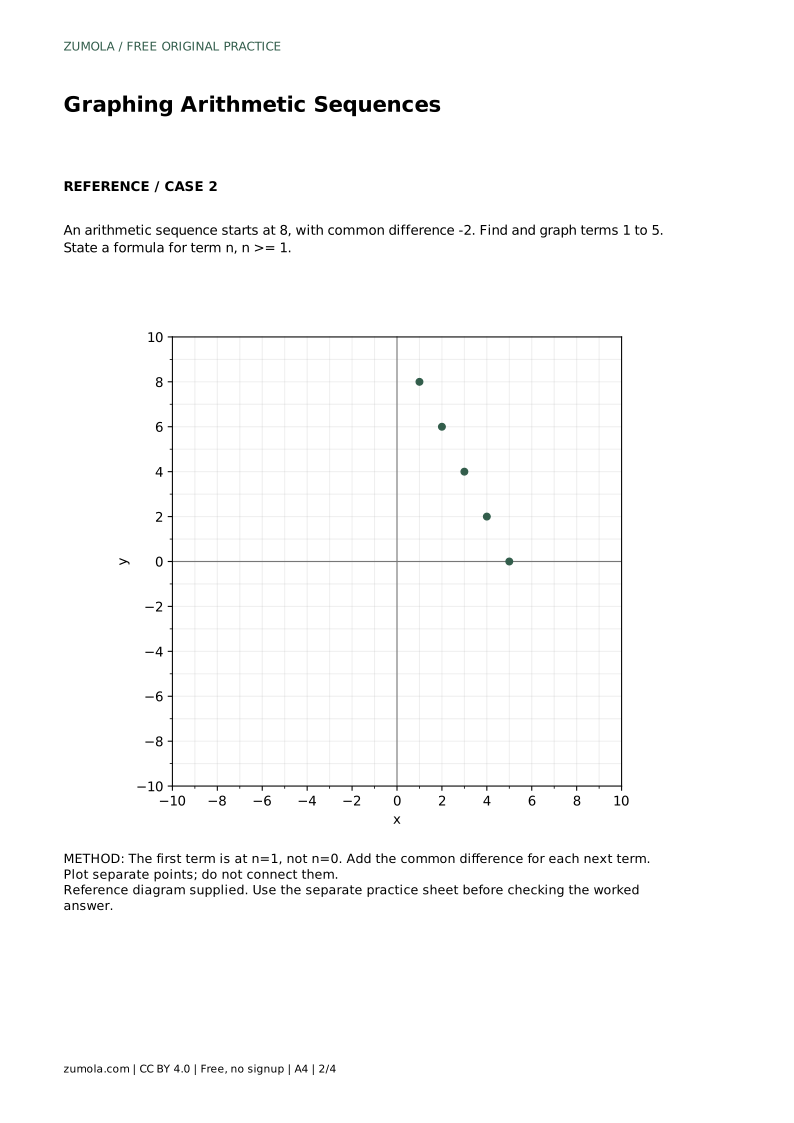
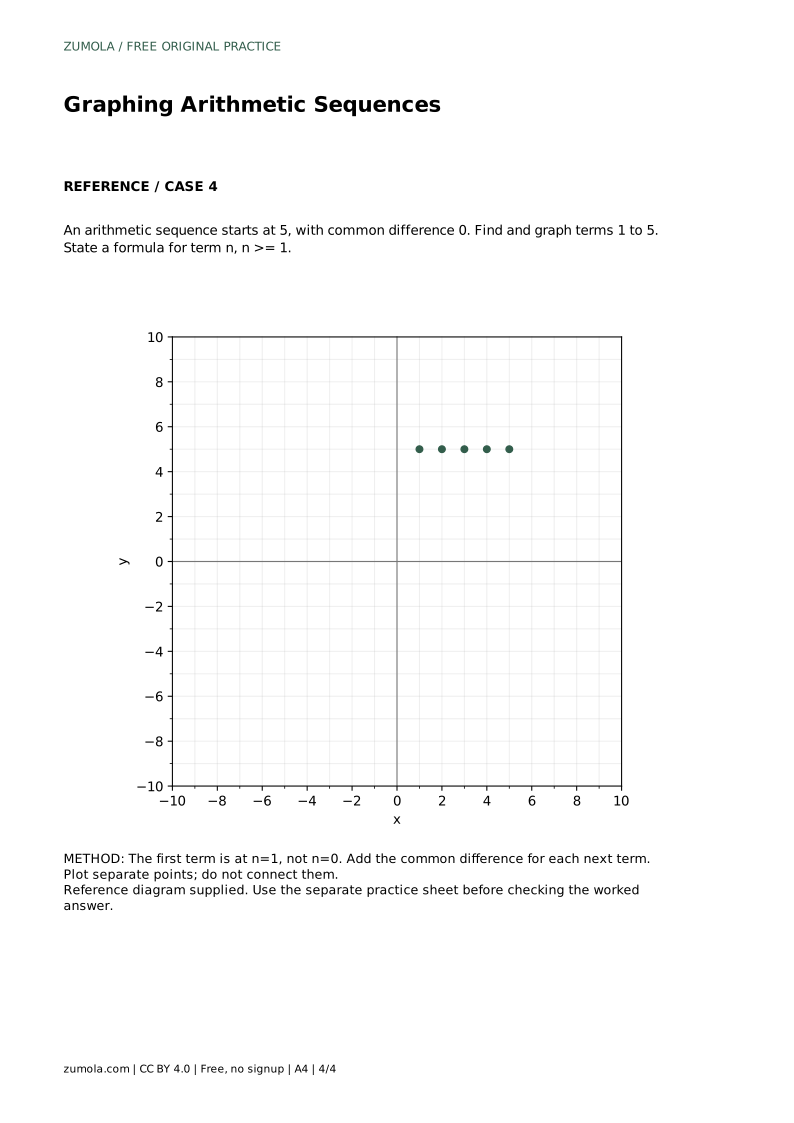
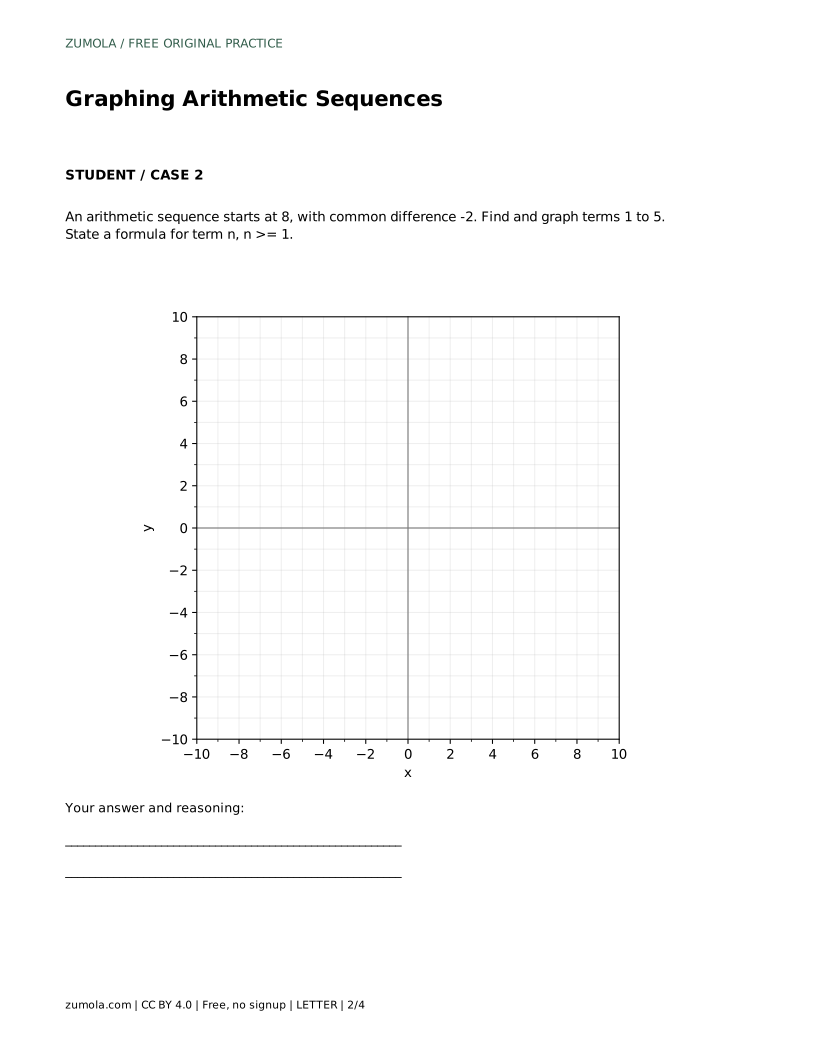
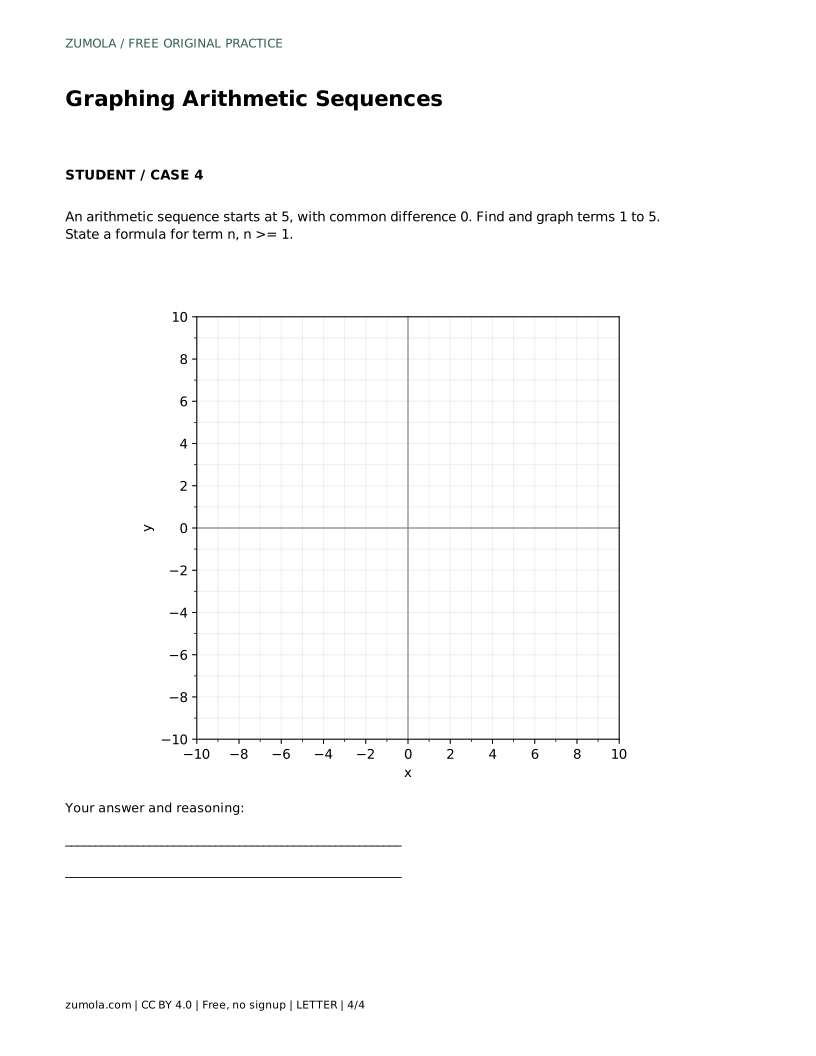
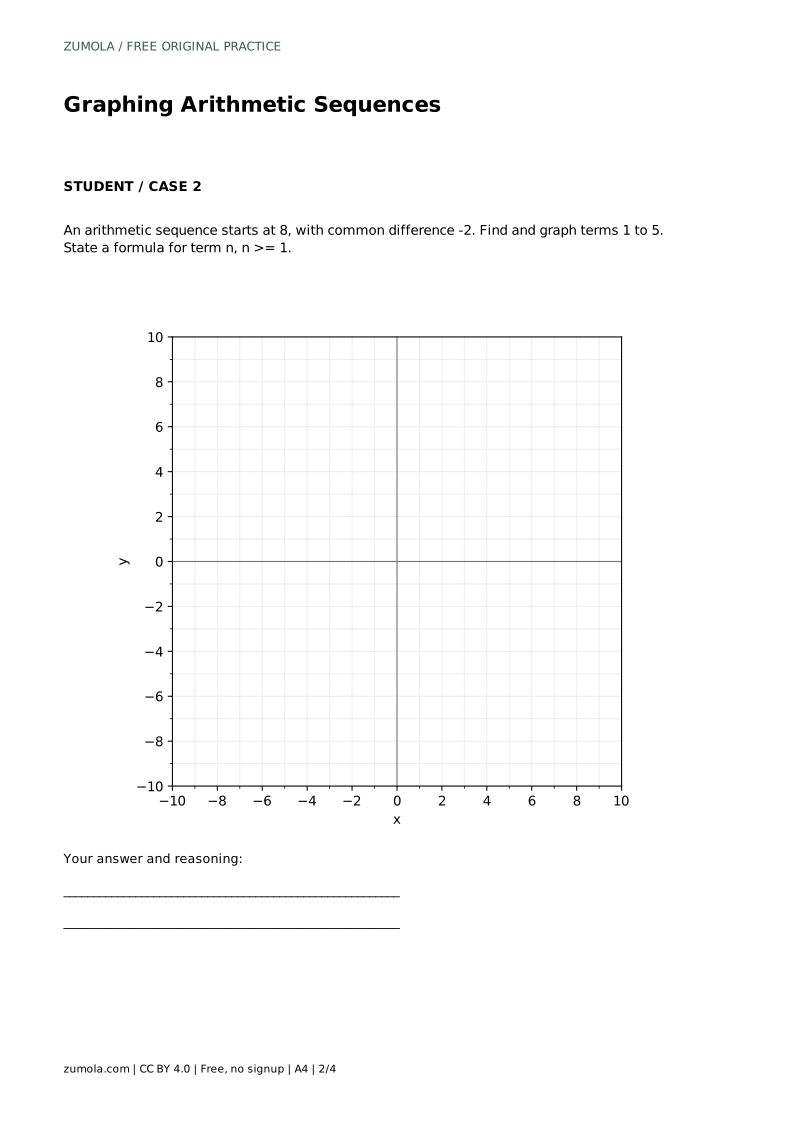
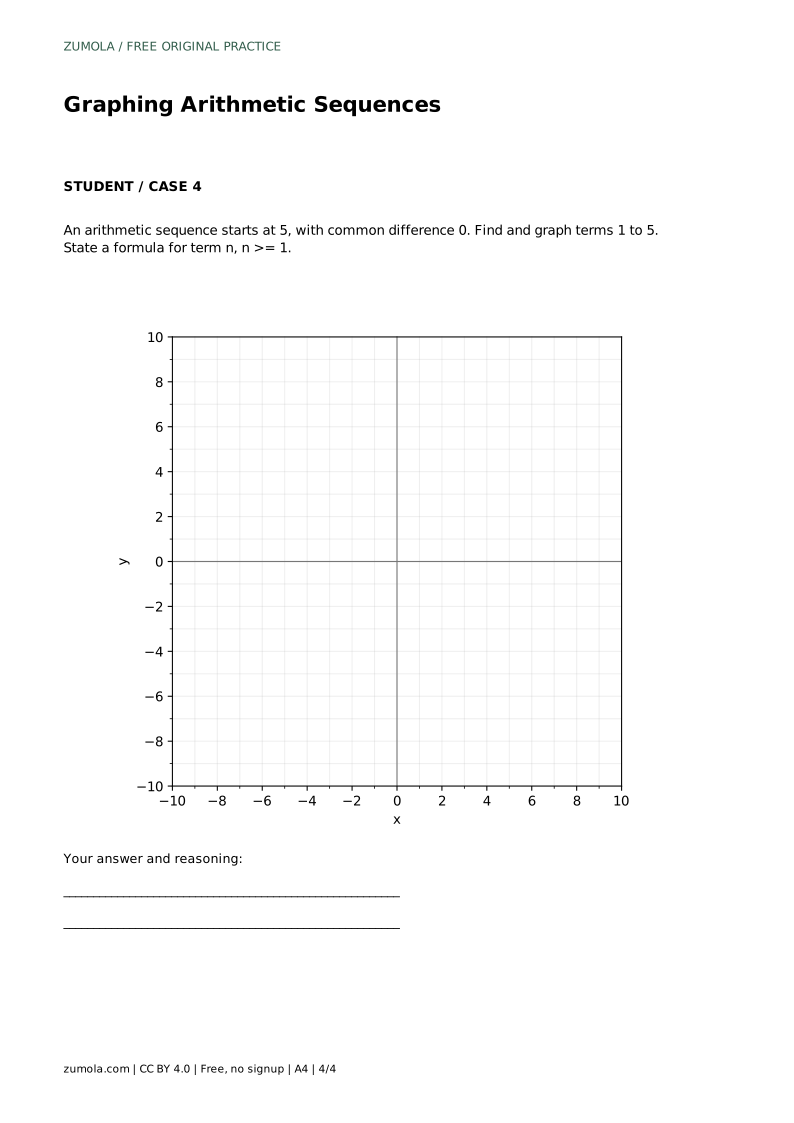
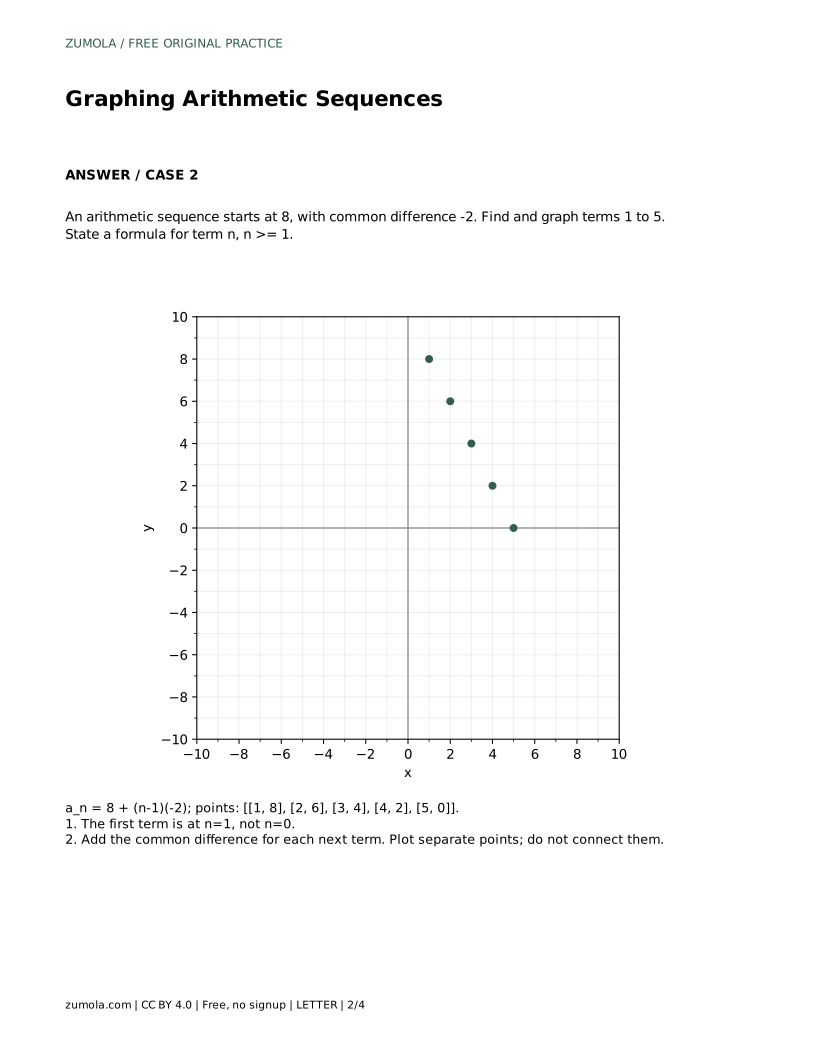
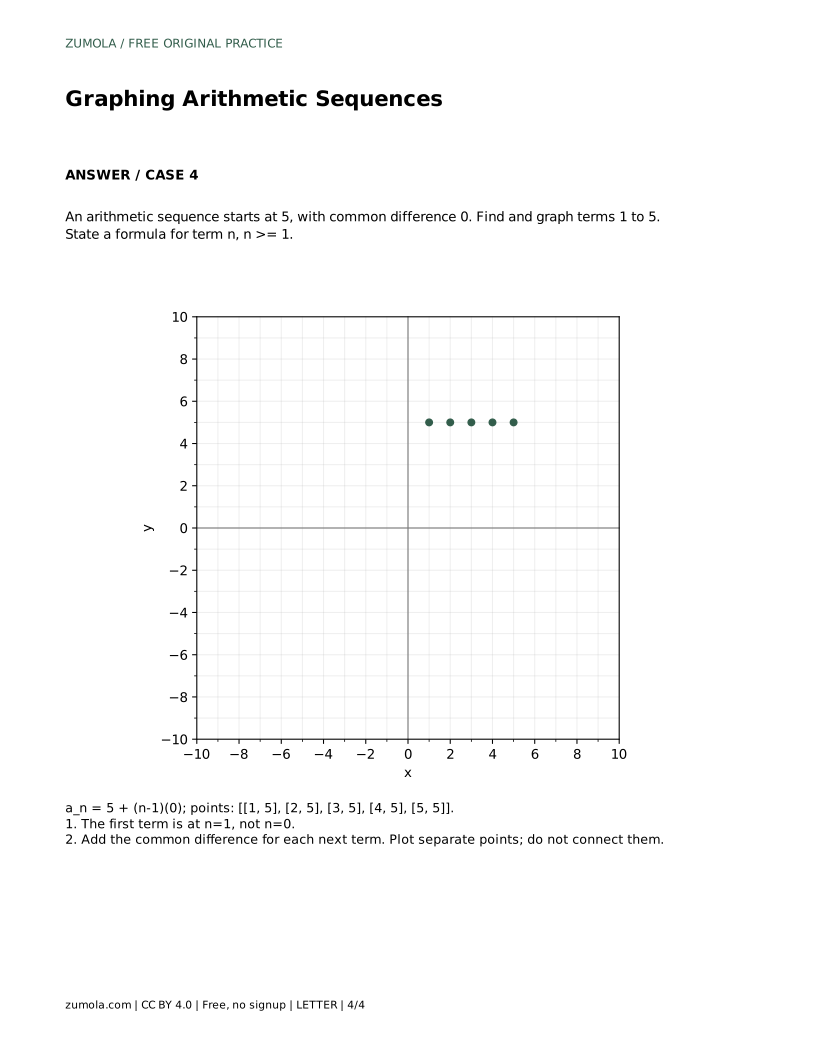
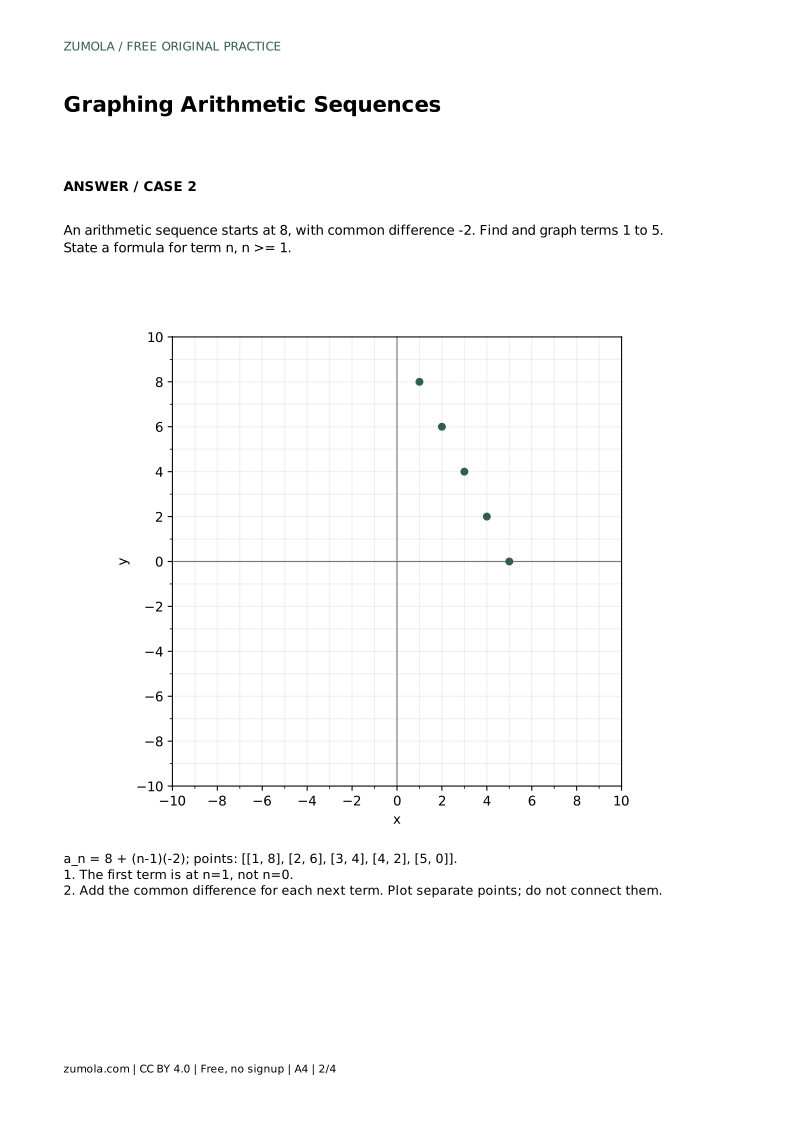
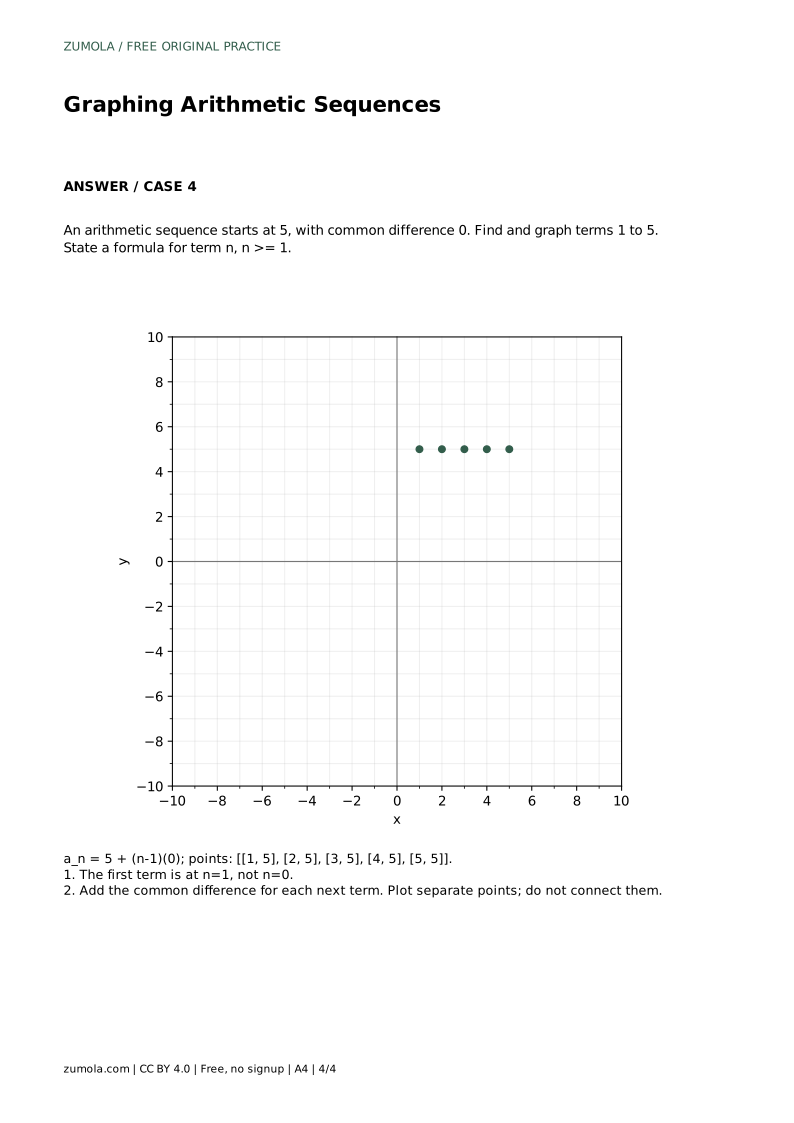
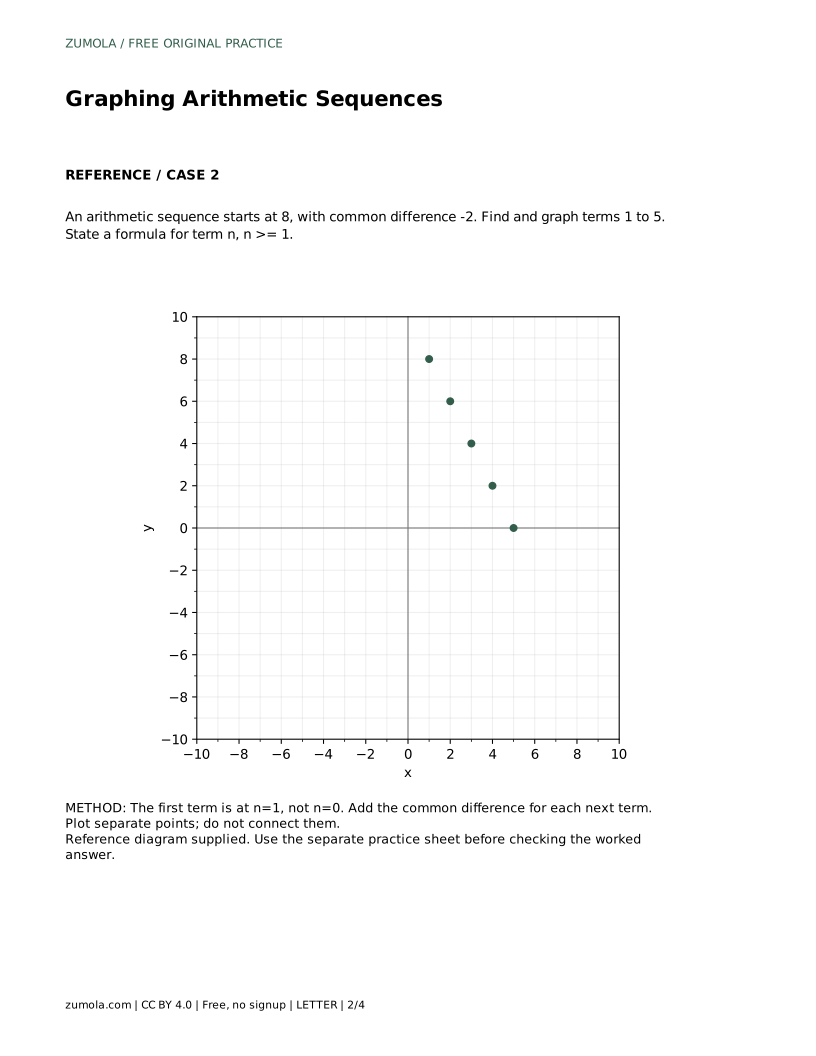
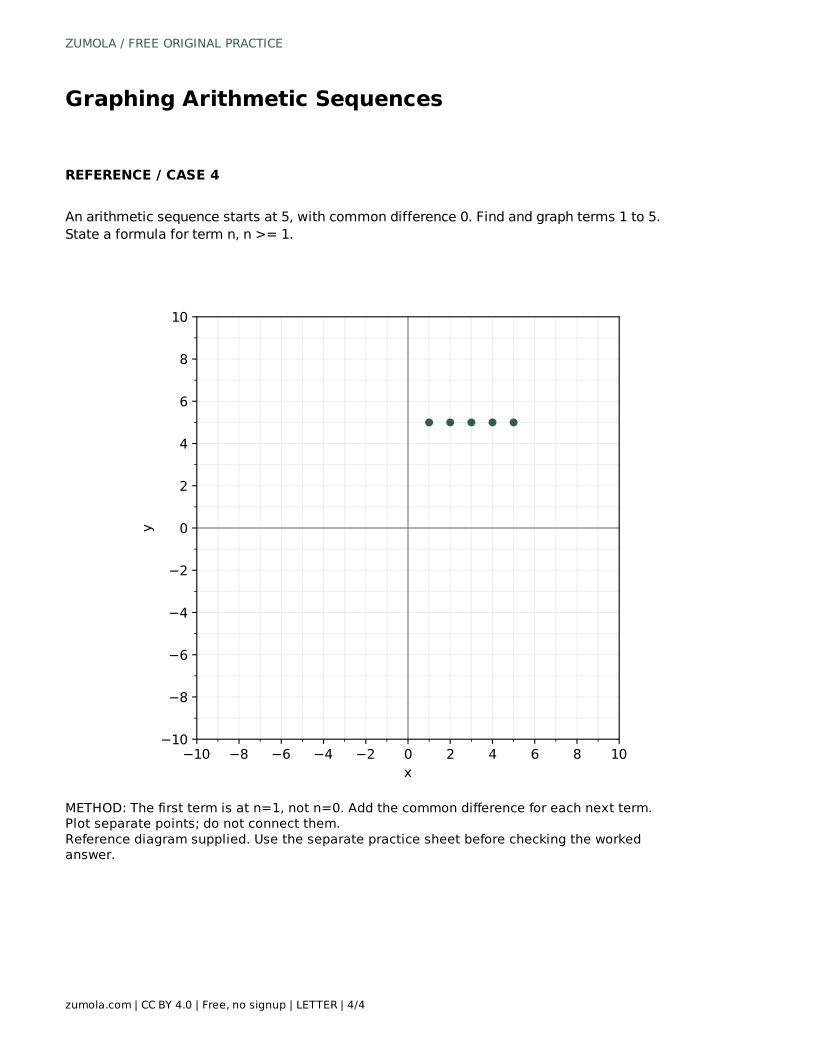
A decreasing sequence behaves the same way. Starting at 8 with d = -2 gives points (1, 8), (2, 6), (3, 4), (4, 2), and (5, 0). The slope is -2, and the line reaches the horizontal axis at n = 5 in this five-term view. A constant sequence such as 5, 5, 5, 5, 5 has d = 0, so its points form a horizontal row at height 5.
A finished graph should match the formula, the listed terms, and the stated domain. Check that the first point sits at n = 1, that each step changes the vertical value by exactly d, and that no extra points appear between whole-number positions. Also check axis labels and scale so a reader can recover each coordinate.
When a printed sheet is used, print at 100% and confirm the calibration bar before trusting measured positions. Artwork and diagrams can have several valid presentations, so judge graphing work with a rubric covering correct coordinates, correct formula, discrete plotting, and clear labels rather than expecting one exact visual answer.
An arithmetic sequence starts at 2 with common difference 2. Find and graph terms 1 to 5, and state a formula for term n with n greater than or equal to 1.
Using a_n = a_1 + (n - 1)d with a_1 = 2 and d = 2 gives a_n = 2 + (n - 1)(2). The first five terms are 2, 4, 6, 8, and 10, plotted as separate points (1, 2), (2, 4), (3, 6), (4, 8), and (5, 10). Check n = 1: 2 + 0 = 2. The points rise by 2 vertically for each one-step increase in n, and they should not be connected.
Each step in n adds the same amount d, so the vertical change is constant. That constant change produces collinear points.
Yes. A zero common difference gives a constant sequence, and its points form a horizontal row.
No, not for the stated domain n greater than or equal to 1. Only whole-number positions from 1 onward belong to the sequence.
All math worksheets · Free coordinate paper
Original resources · CC BY 4.0 · Free for personal and classroom use with attribution.