Reference diagrams
LETTER · Download PDF
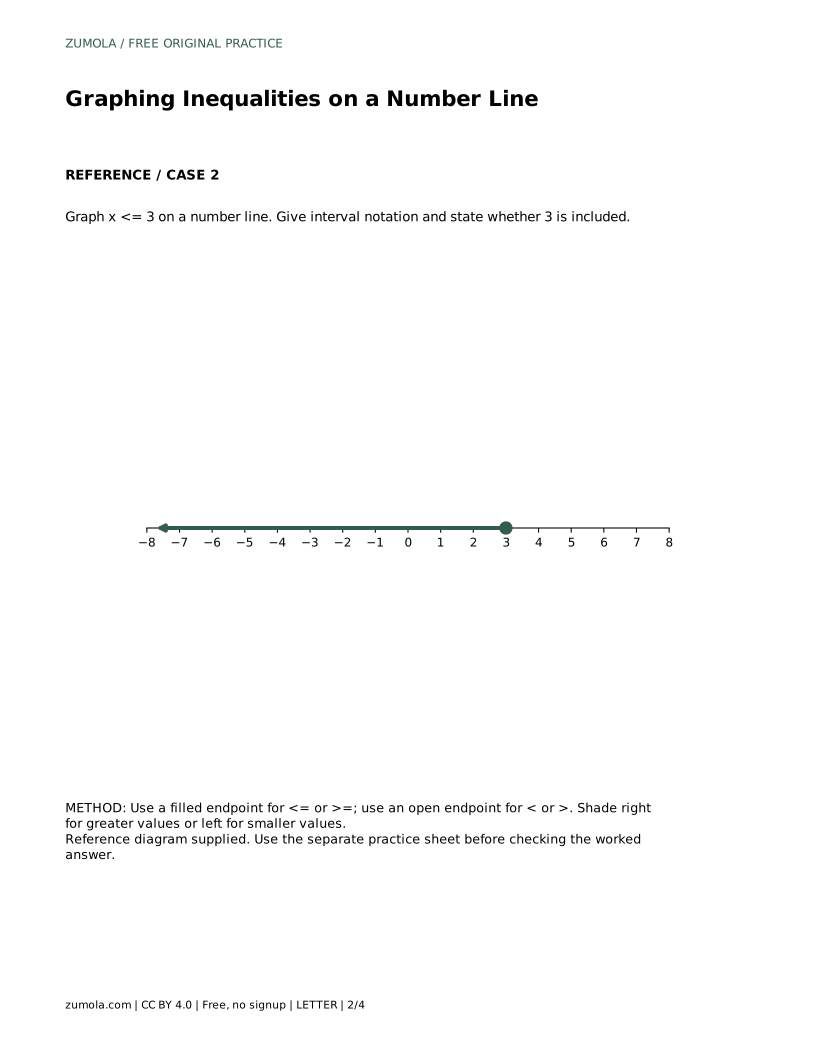
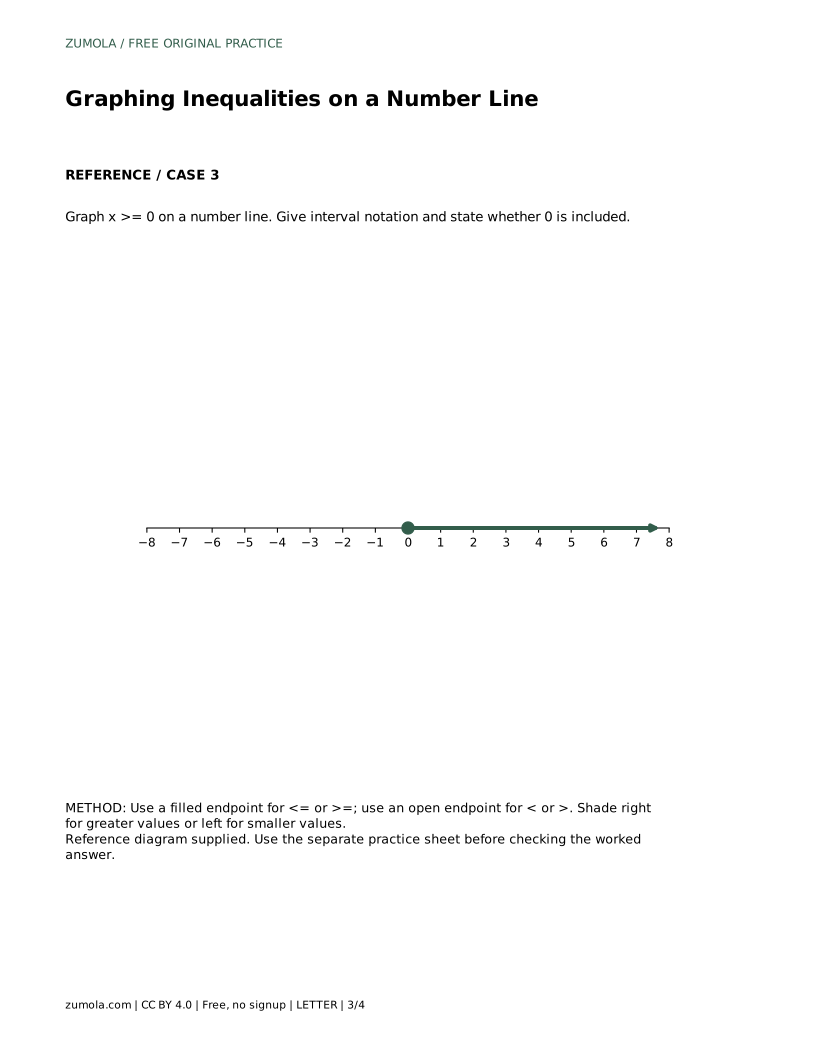
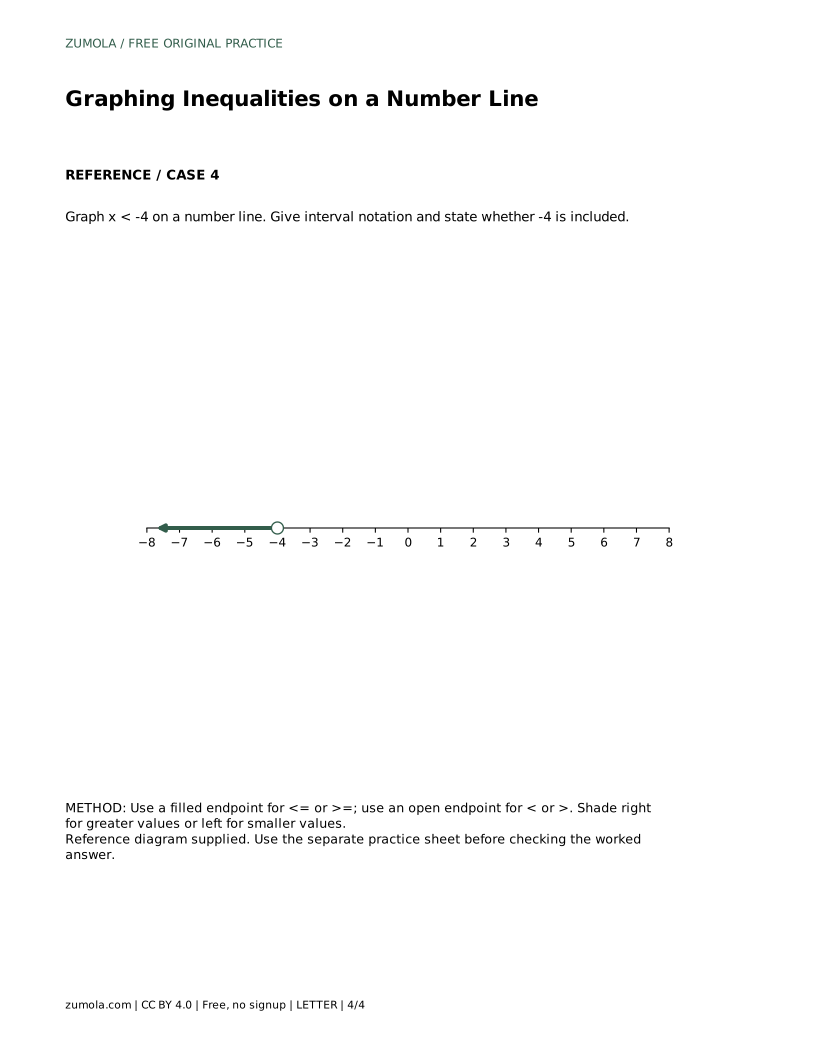
A4 · Download PDF
Free original resources
Learn to graph one-variable inequalities on a number line, choose open or closed endpoints, shade the correct direction, and write interval notation.
Four original cases, with reference diagrams, practice sheets and worked answers. Everything is free; no signup required.
LETTER · Download PDF
A4 · Download PDF
LETTER · Download PDF
A4 · Download PDF
LETTER · Download PDF
A4 · Download PDF
Use A4 or US Letter to match your printer. Graph coordinates determine the answers; these worksheets are not physical measuring rulers.
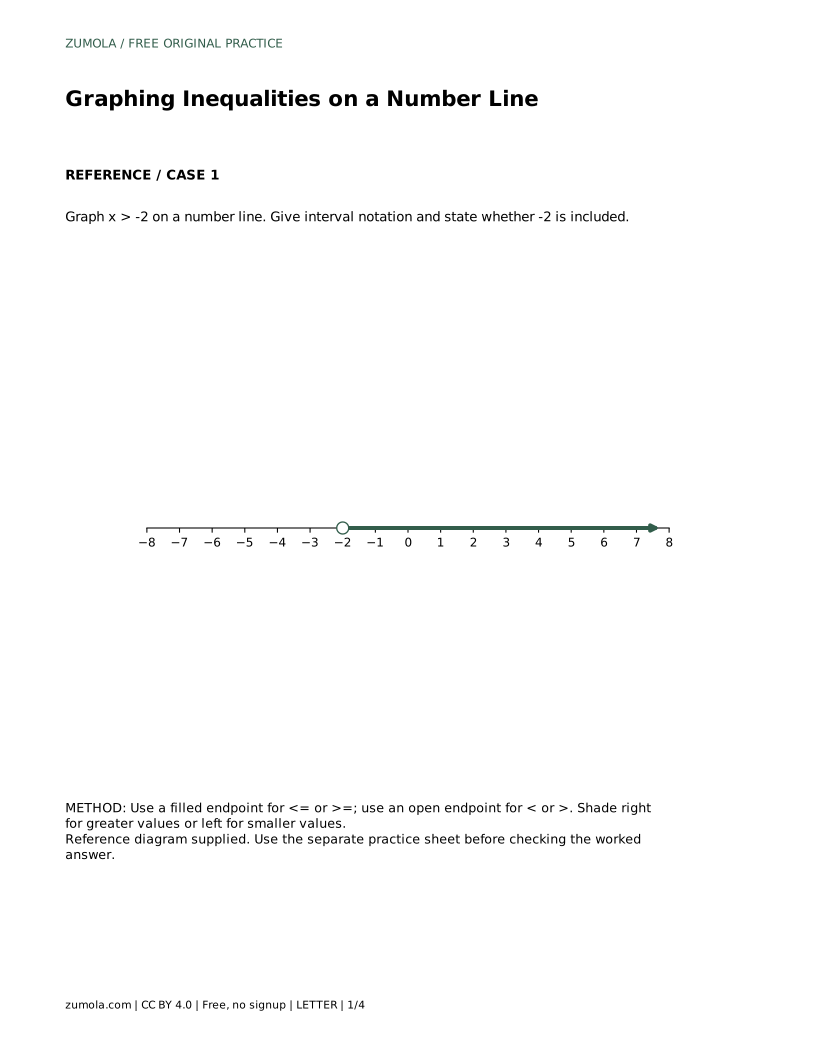
A one-variable inequality describes a range of values, not a single point. Graphing it on a number line makes that range visible: an endpoint marks the boundary, and a shaded ray shows which side satisfies the inequality. This page explains how to choose an open or closed endpoint, which direction to shade, and how to translate the picture into interval notation. It covers strict inequalities such as x > -2 and non-strict inequalities such as x <= 3, with a worked example you can check independently.
The inequality symbol decides whether the boundary number belongs to the solution set. The symbols < and > are strict: the boundary is not included, so you draw an open endpoint, usually a small circle, at that number. The symbols <= and >= are non-strict: the boundary is included, so you draw a filled endpoint, usually a solid dot.
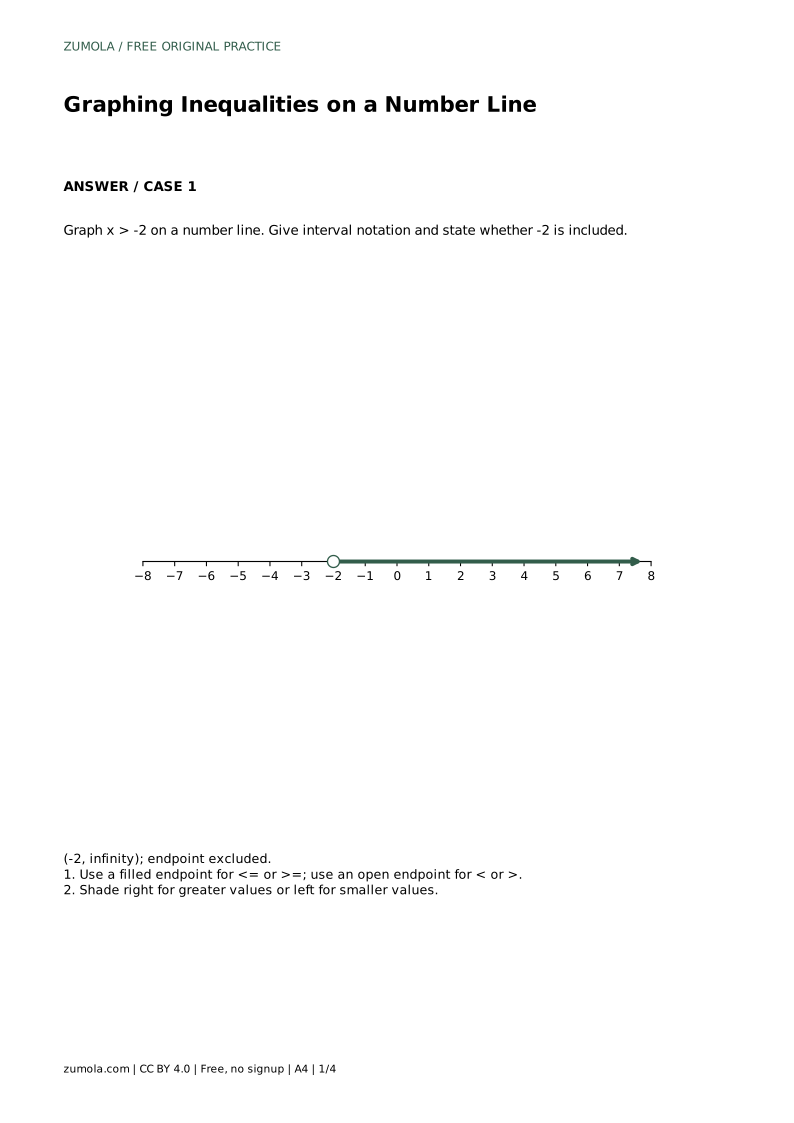
This distinction matters because it changes the interval notation. An open endpoint uses a parenthesis, while a closed endpoint uses a square bracket. For example, x > -2 excludes -2 and is written (-2, infinity). By contrast, x >= -2 includes -2 and is written [-2, infinity). The endpoint is a single number, but it decides whether the ray starts with or without that value.
After marking the endpoint, shade the ray that contains all values satisfying the inequality. For x > a or x >= a, shade to the right, because greater values lie to the right on a standard number line. For x < a or x <= a, shade to the left, because smaller values lie to the left.
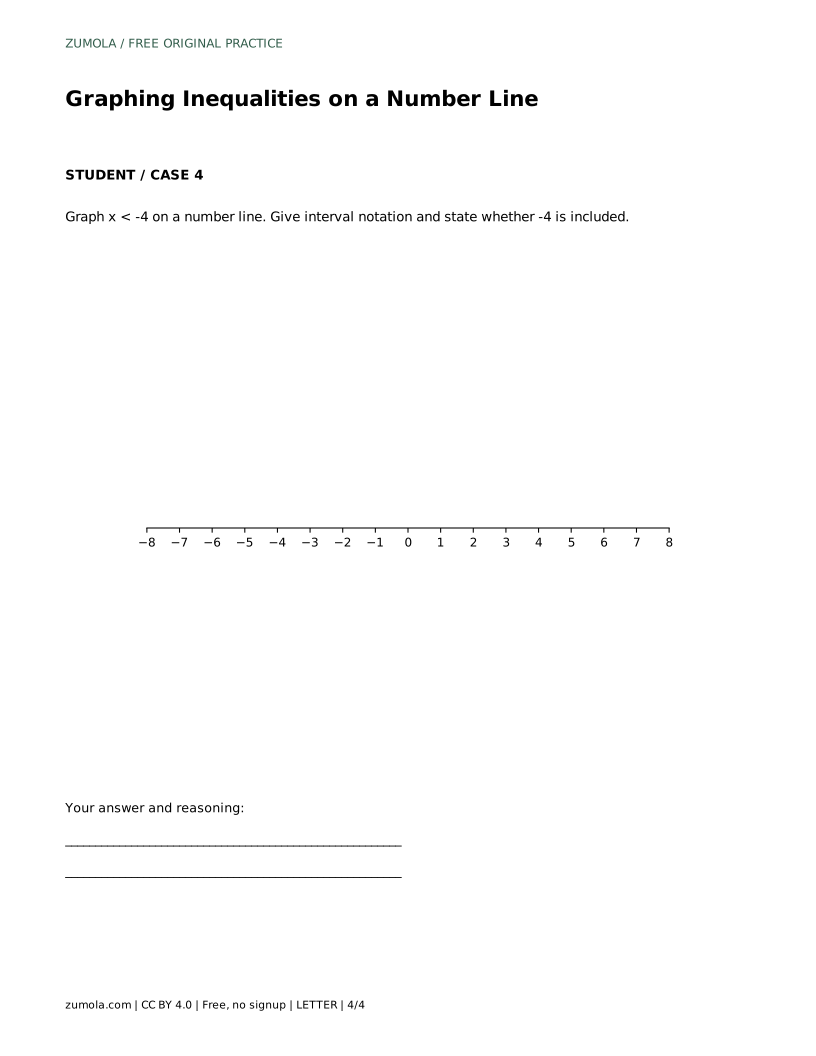
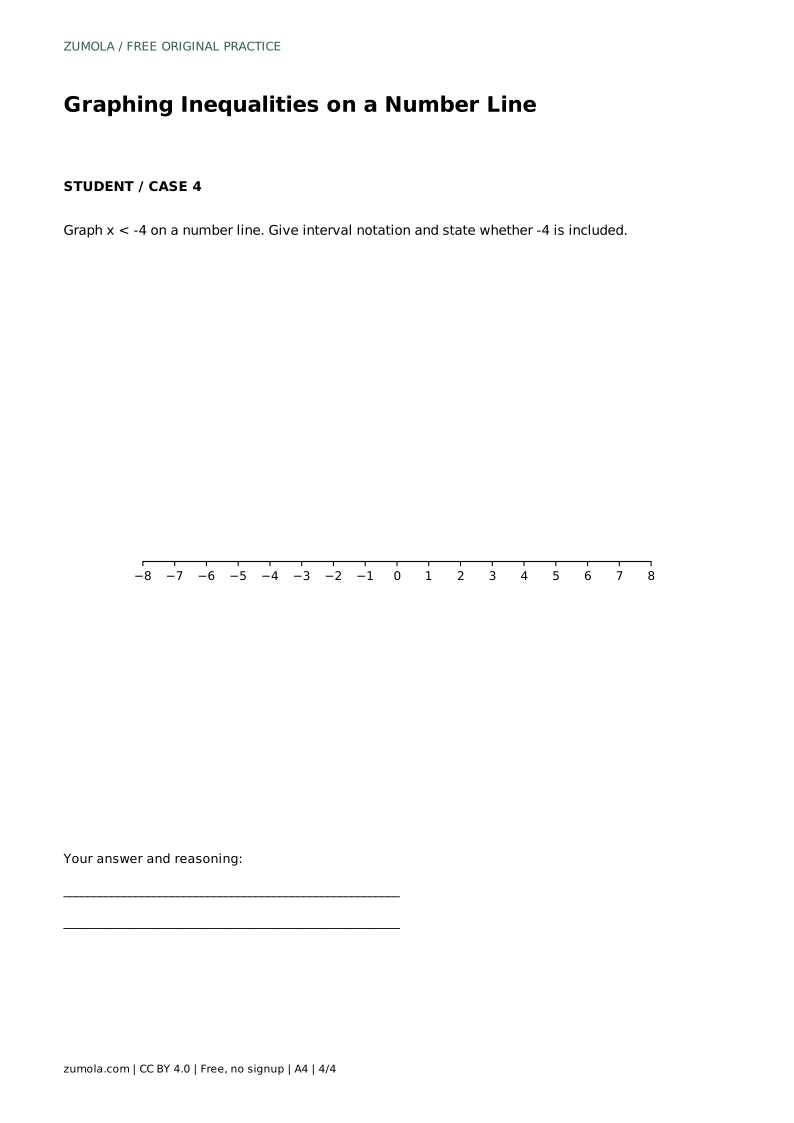
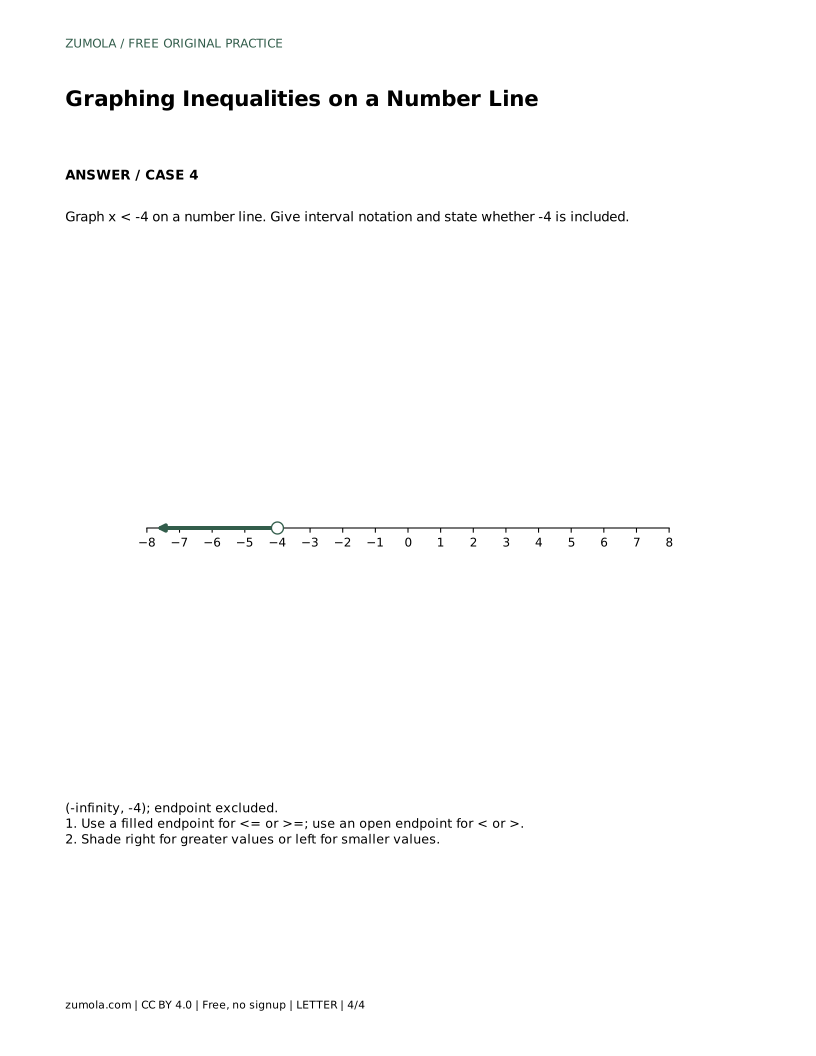
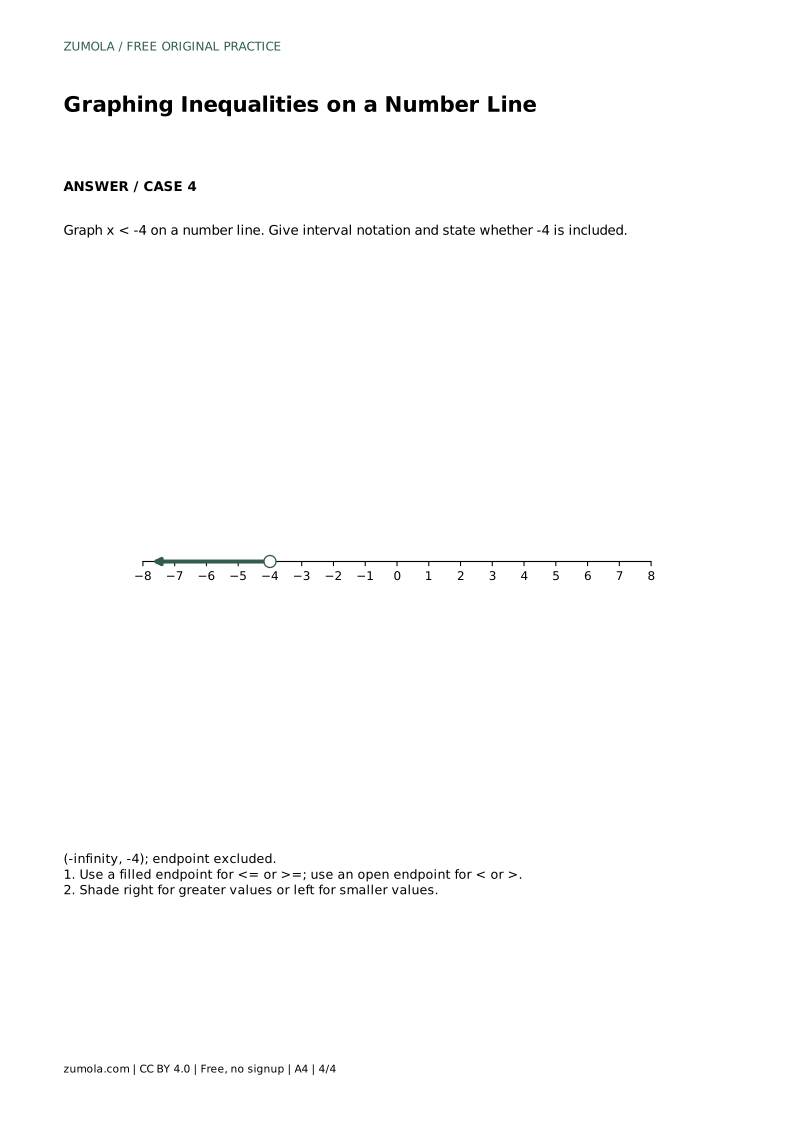
A quick test prevents direction errors. Pick one number on the side you plan to shade and substitute it into the inequality. If it makes the statement true, shade that side. For x > -2, test 0: 0 > -2 is true, so shade right. For x < -4, test -5: -5 < -4 is true, so shade left. Keep the test number simple and clearly on one side of the boundary.
Interval notation summarizes the shaded ray. The boundary number appears once, and infinity appears on the unbounded side. Always use a parenthesis next to infinity, because infinity is not a number you can include. The bracket or parenthesis at the boundary matches the endpoint: open endpoint gives a parenthesis, closed endpoint gives a square bracket.
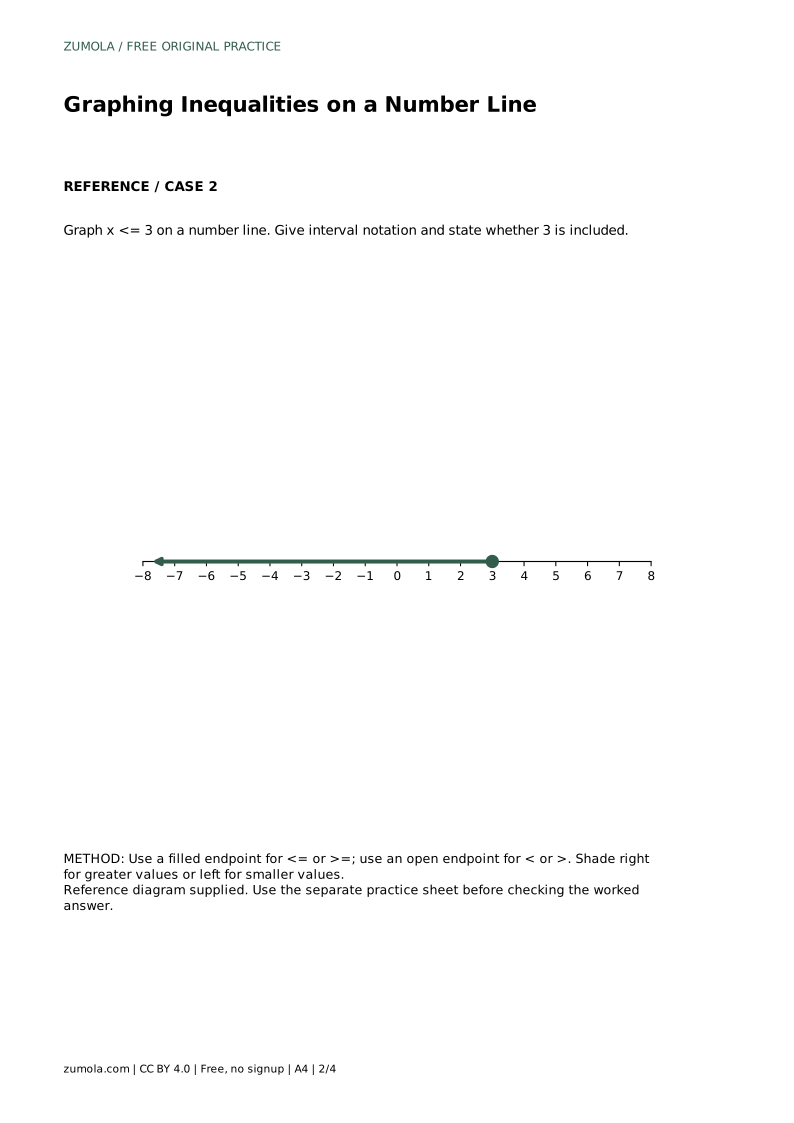
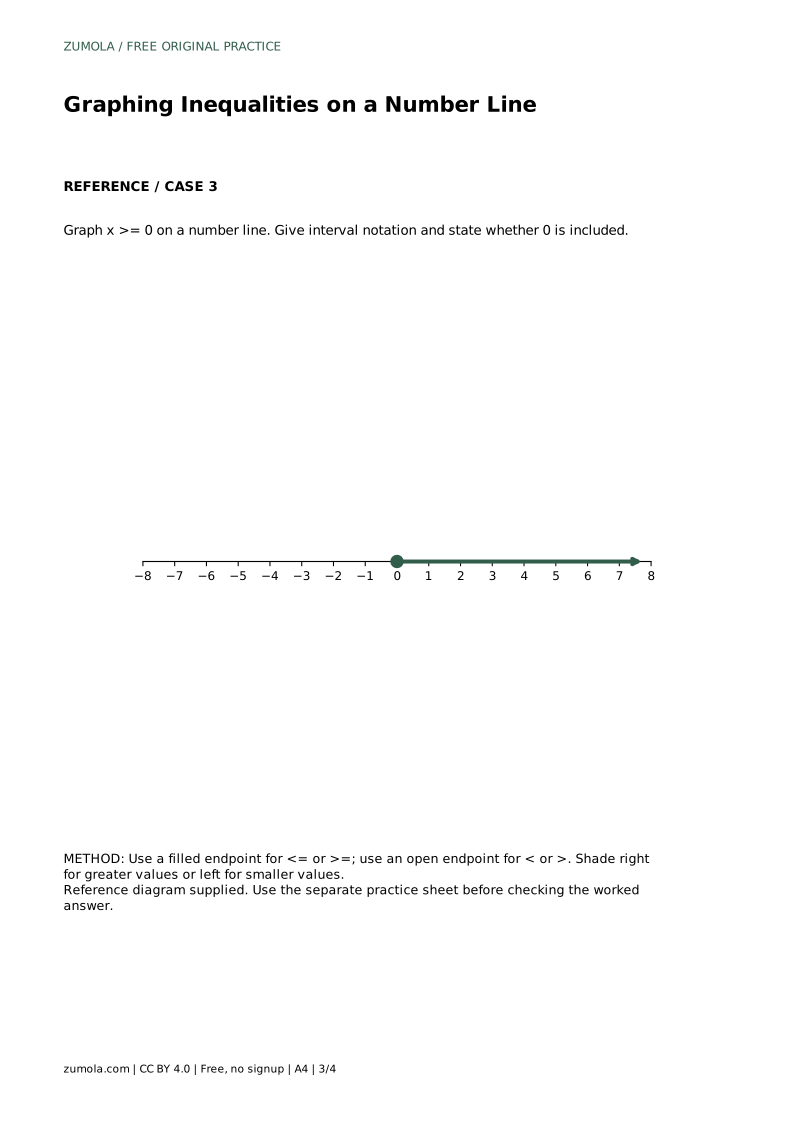
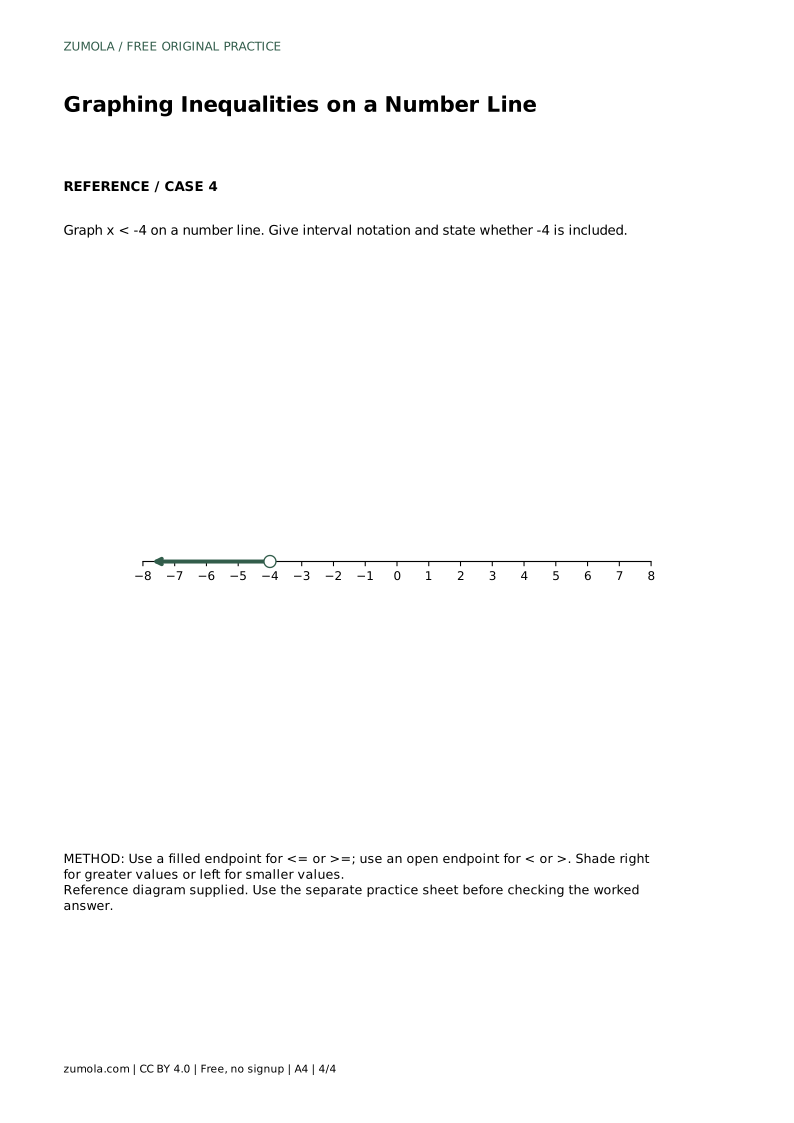
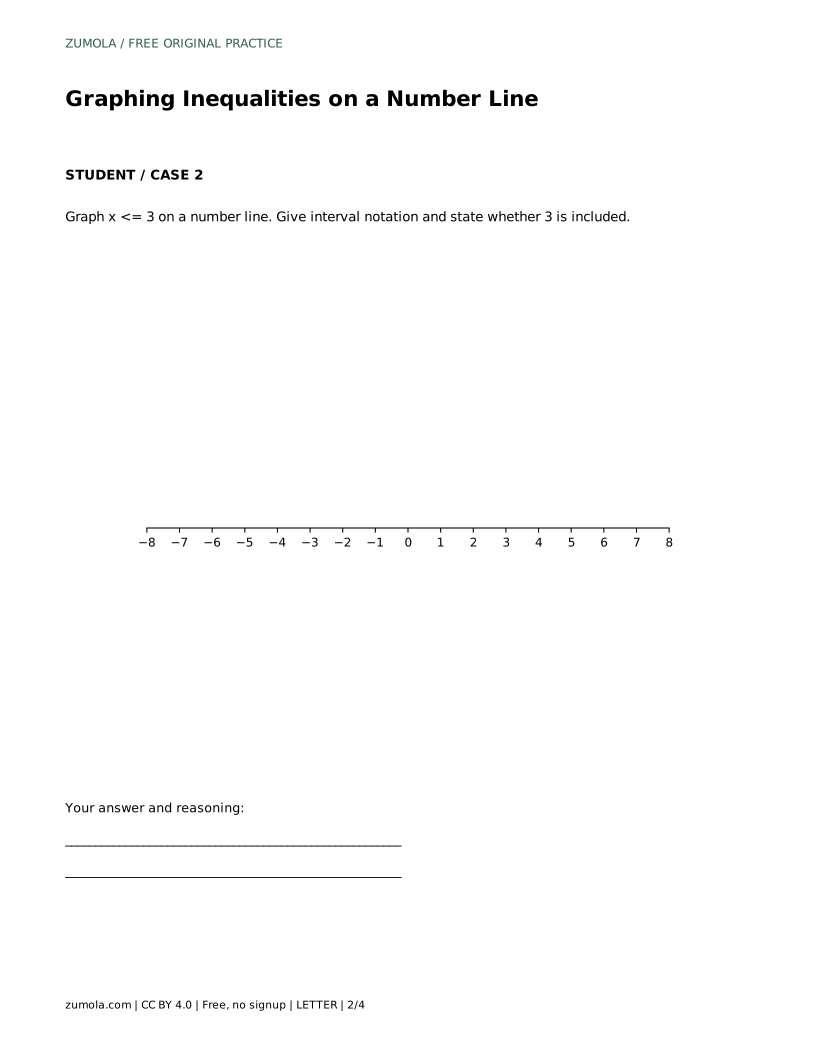
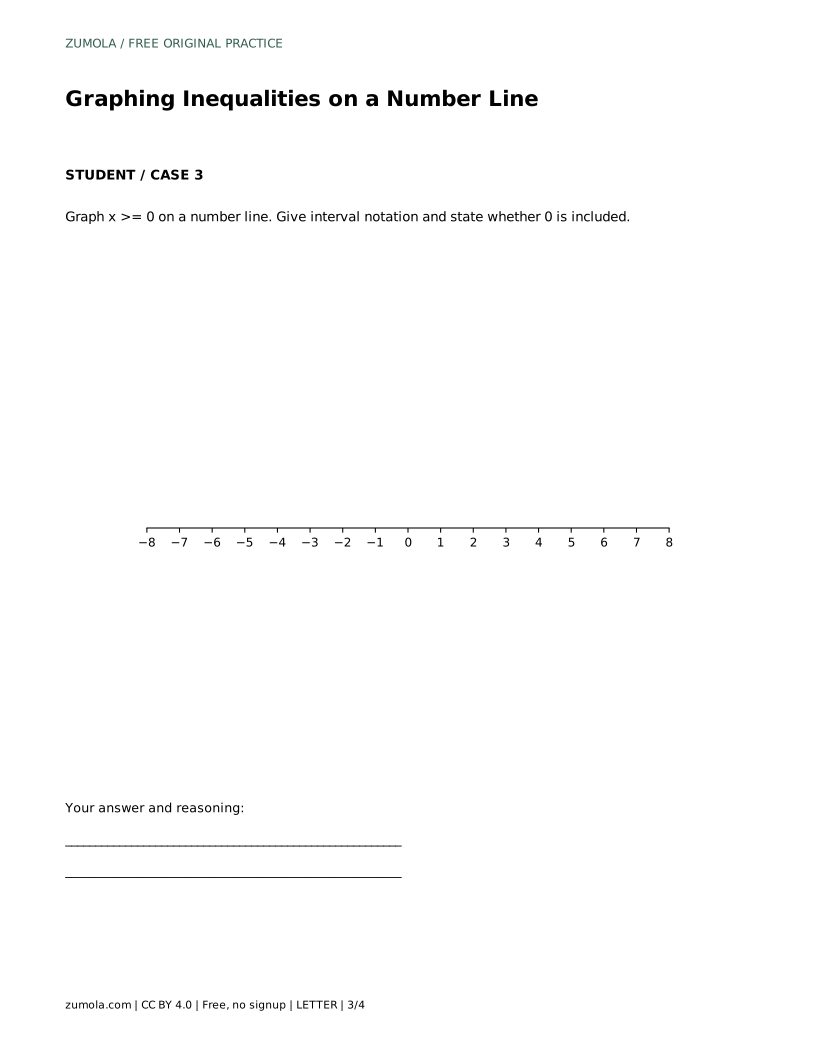
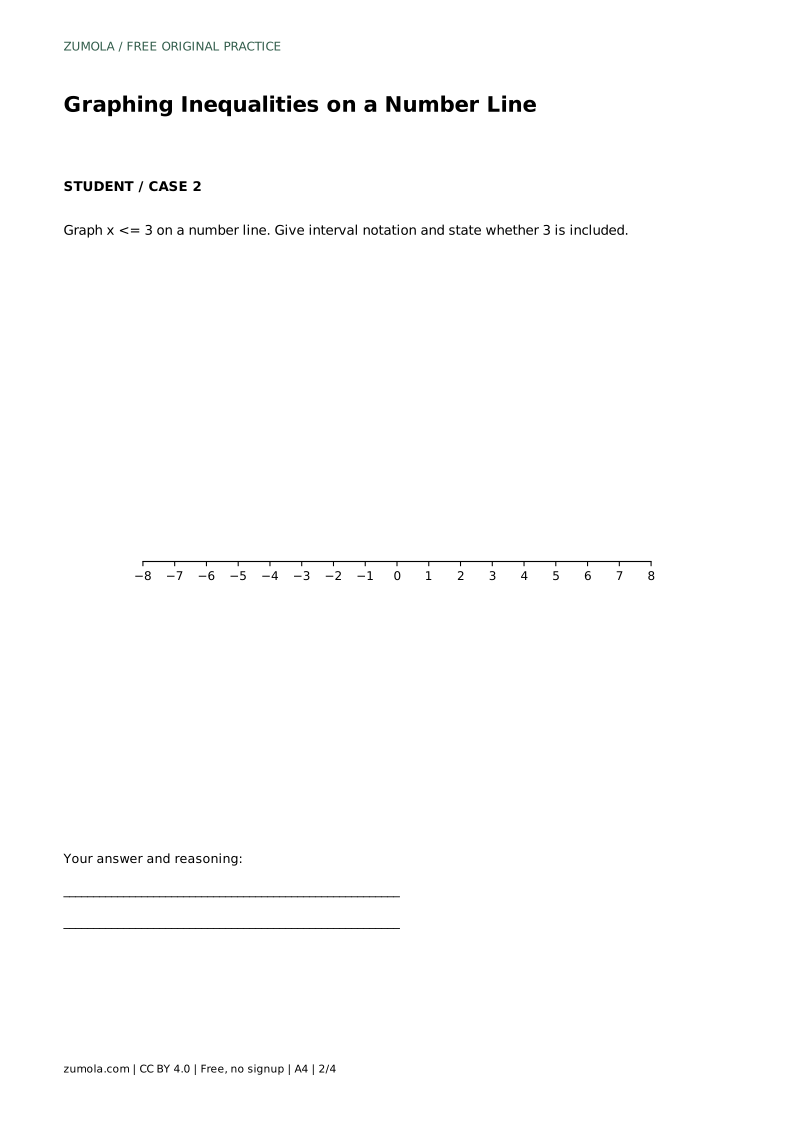
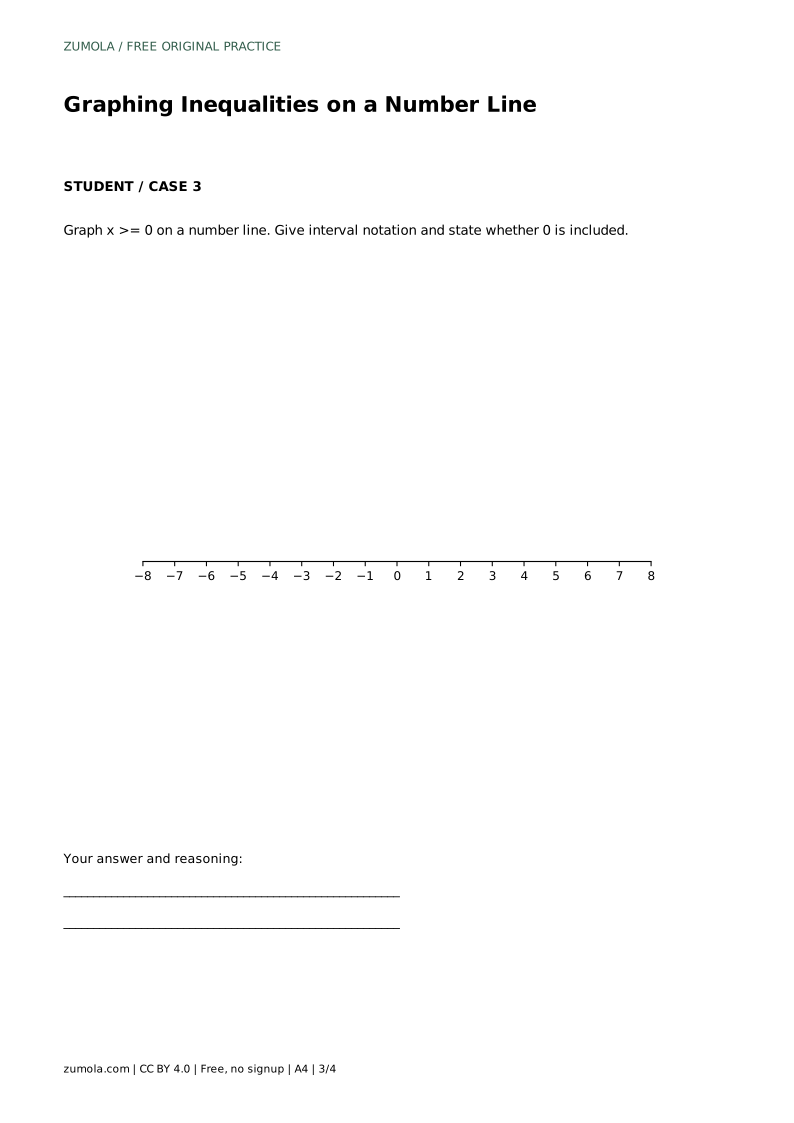
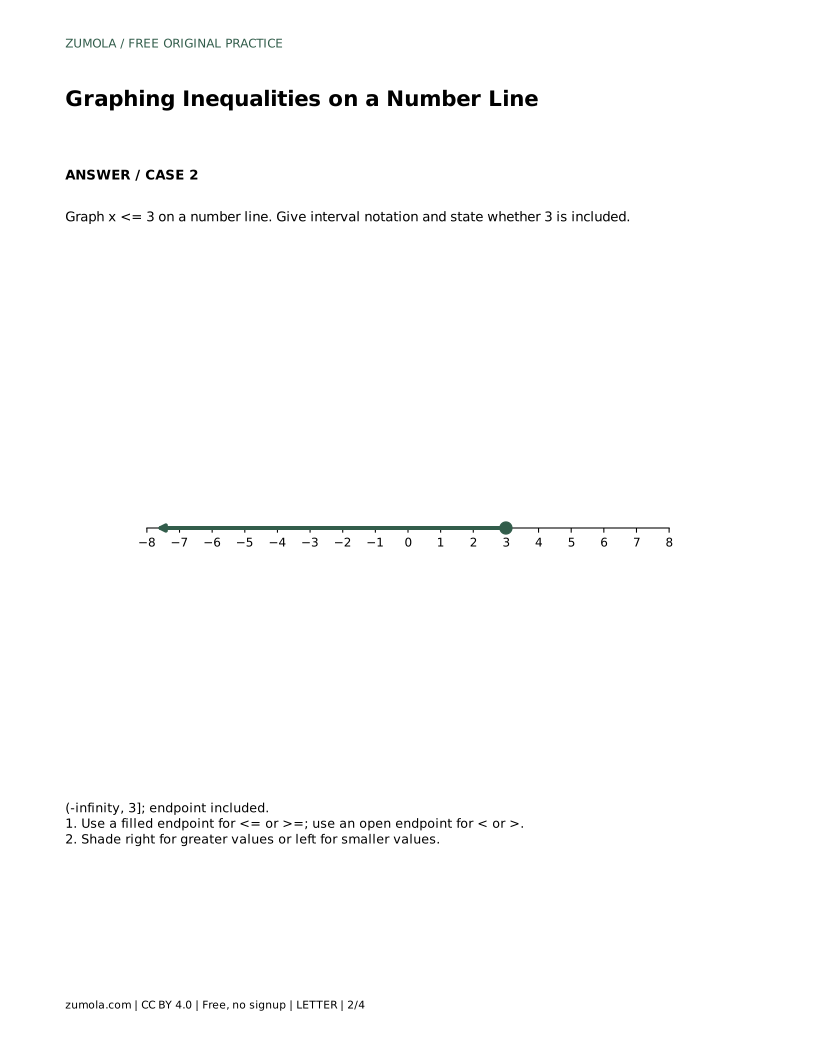
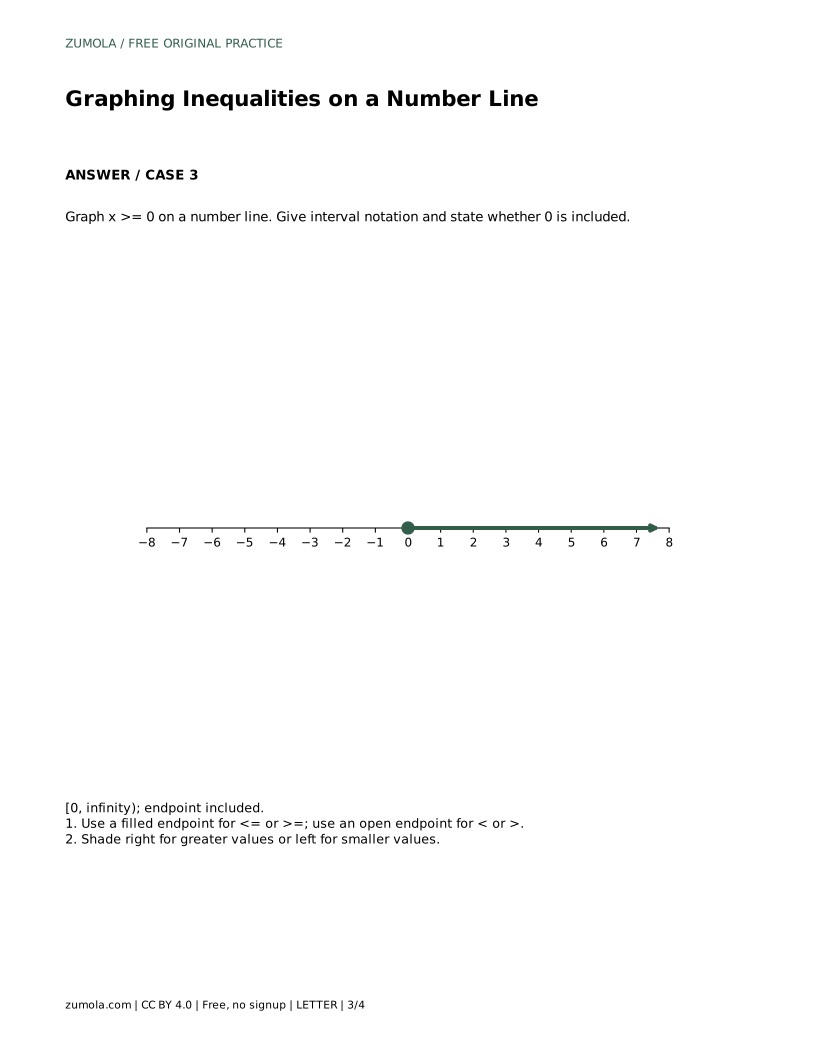
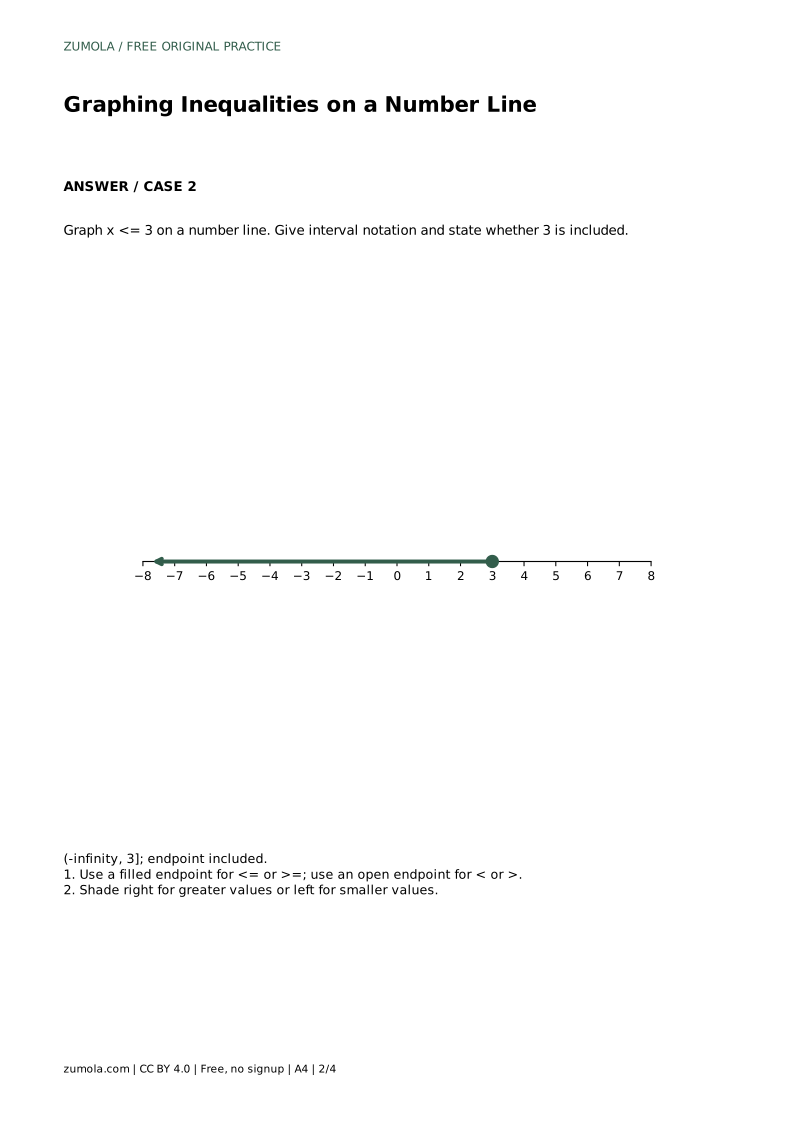
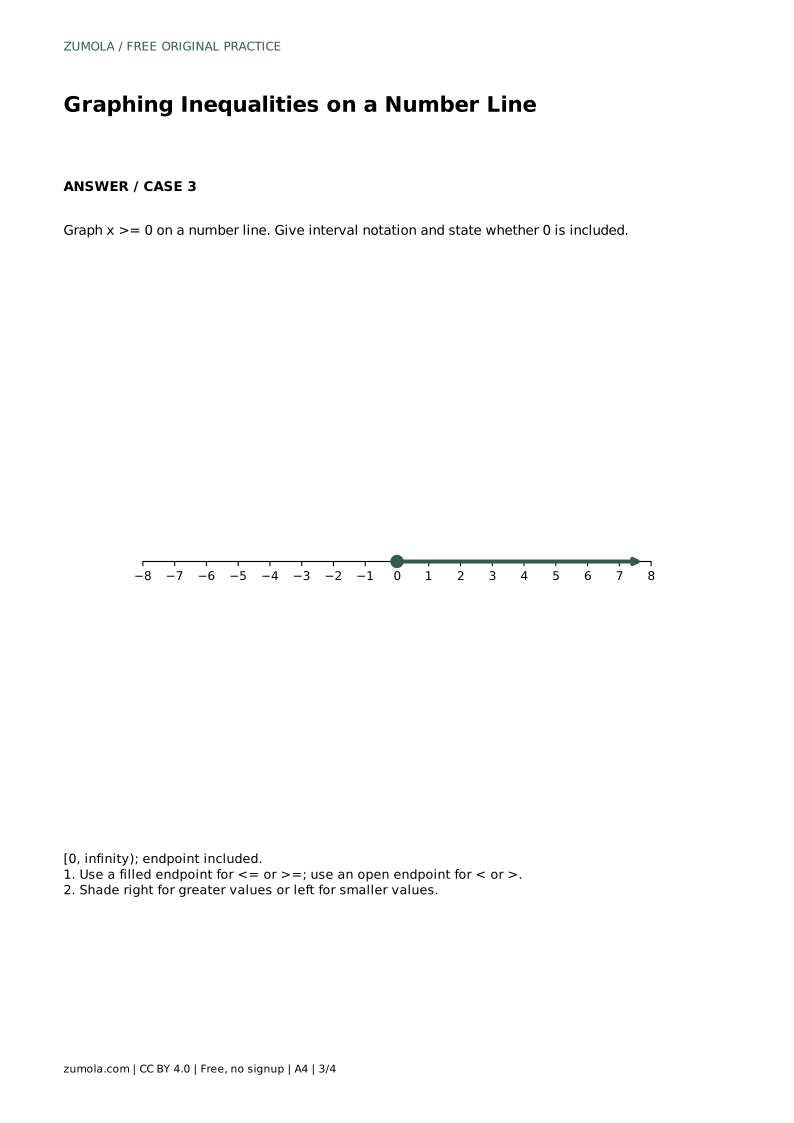
For x <= 3, the graph has a filled endpoint at 3 and shades left, so the interval is (-infinity, 3]. For x >= 0, the graph has a filled endpoint at 0 and shades right, so the interval is [0, infinity). For x < -4, the graph has an open endpoint at -4 and shades left, so the interval is (-infinity, -4). Read the interval from left to right, matching the number line's order.
A correct graph satisfies three checks: the endpoint is at the right number, the endpoint style matches the strict or non-strict symbol, and the shaded side contains values that make the inequality true. Test the boundary itself when the endpoint is closed; it should satisfy the inequality. When the endpoint is open, the boundary should fail the inequality.
Also test one shaded value and one unshaded value. For x >= 0, the boundary 0 satisfies 0 >= 0, and 2 satisfies 2 >= 0, while -1 fails. This three-point check catches most endpoint and direction mistakes before you finalize the answer.
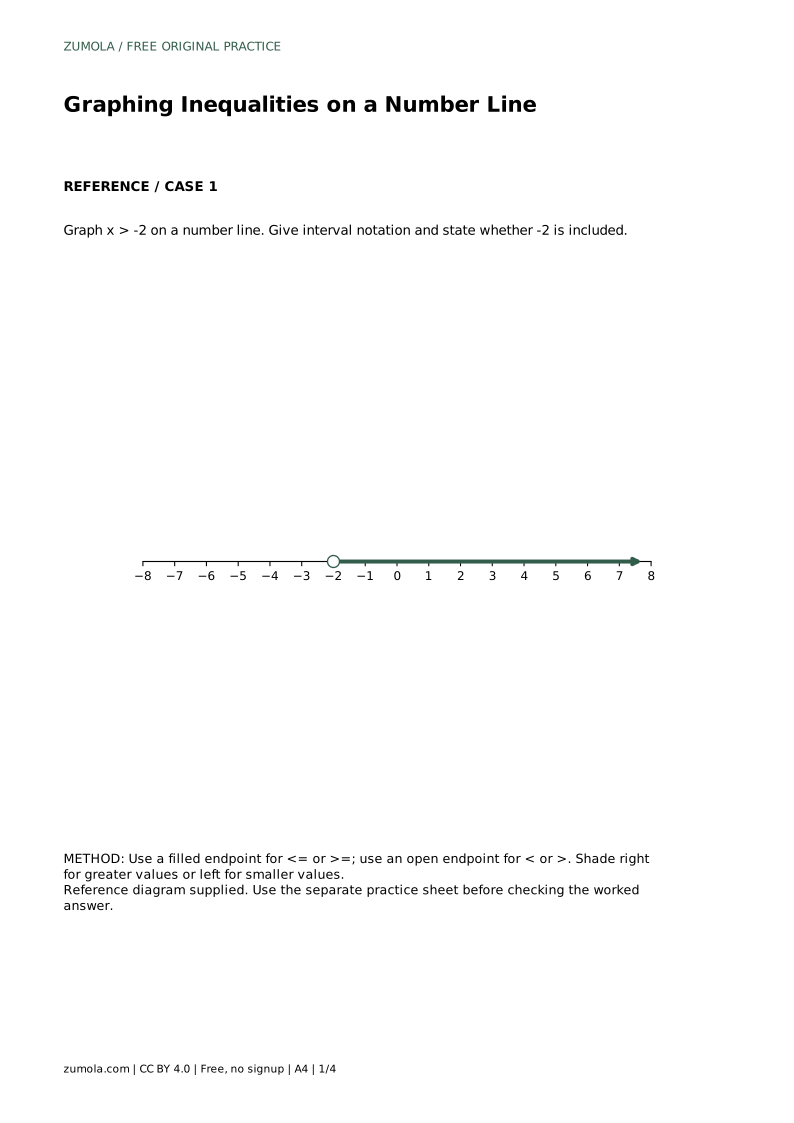
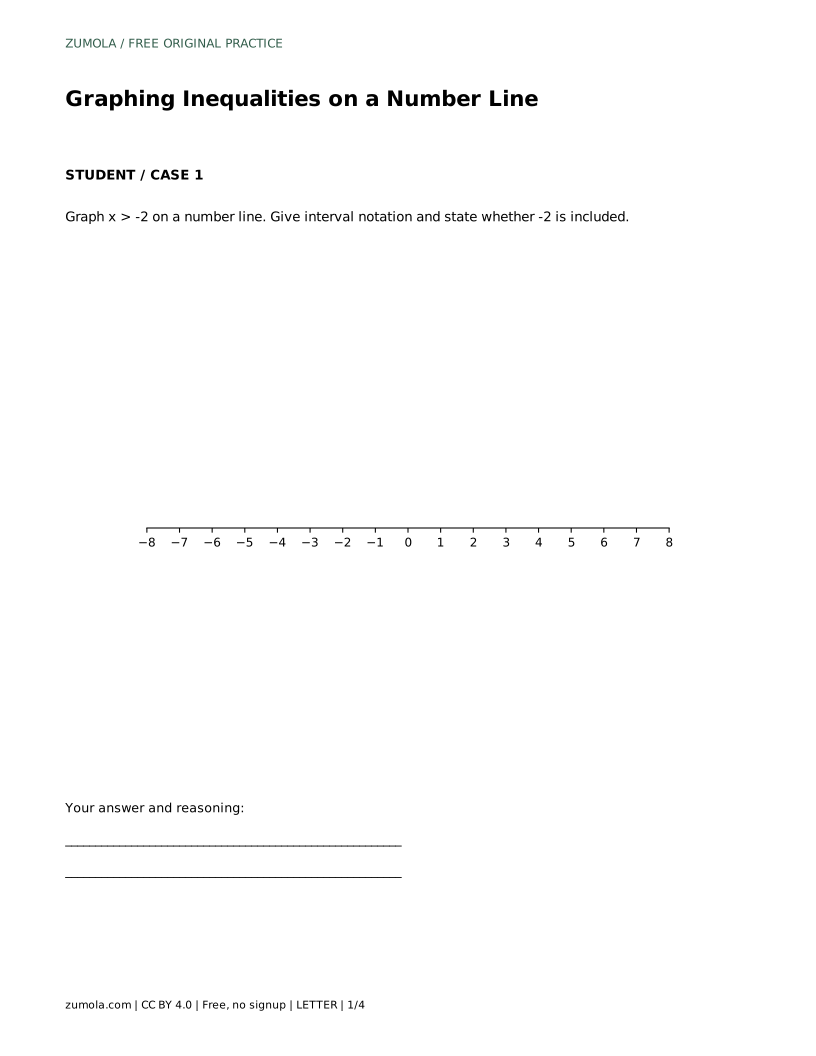
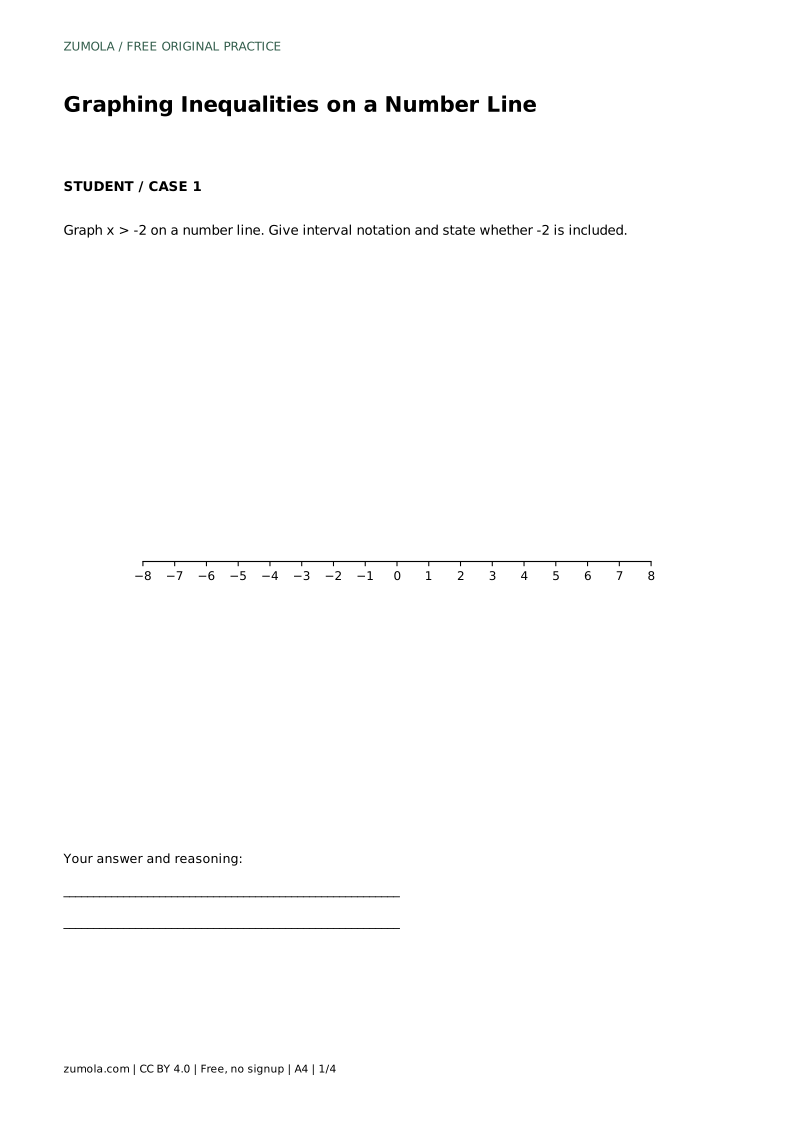
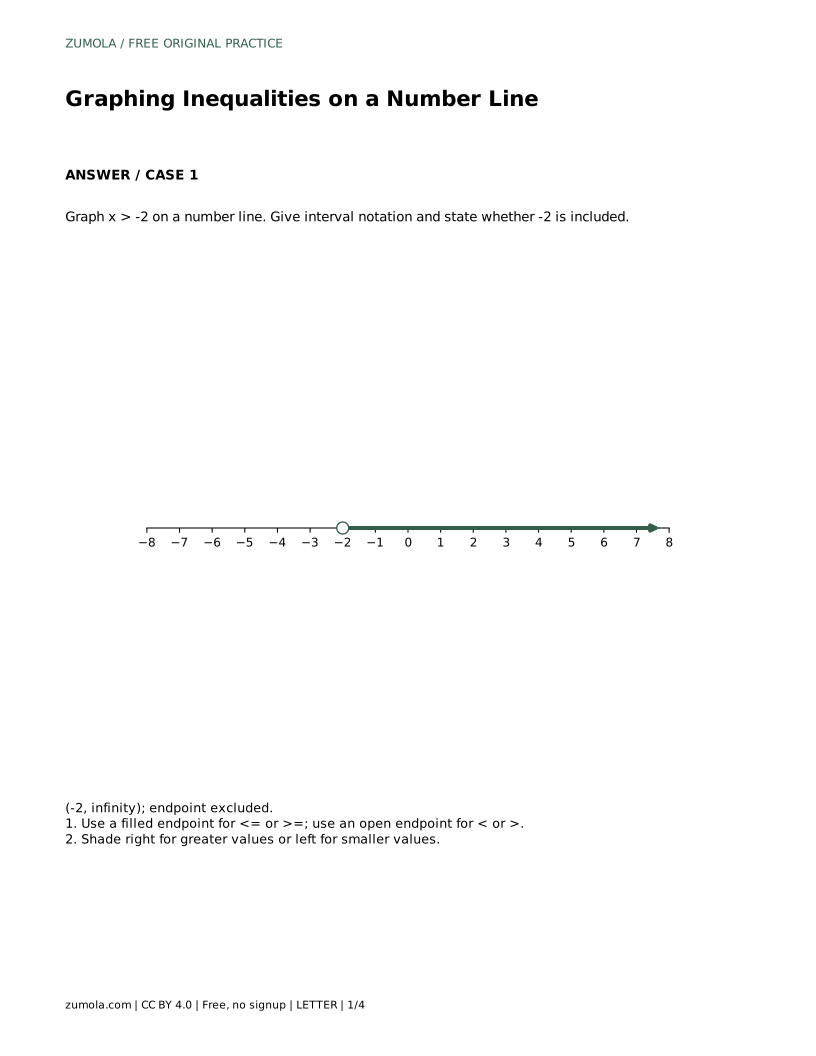
Graph x > -2 on a number line, give interval notation, and state whether -2 is included.
The symbol is >, which is strict, so -2 is not included. Draw an open endpoint at -2. Since the inequality means greater than -2, shade to the right. Test 0: 0 > -2 is true, confirming the rightward shade. In interval notation, the excluded boundary gives a parenthesis and the unbounded right side gives infinity with a parenthesis: (-2, infinity). The endpoint -2 is excluded.
No. It belongs only when the symbol is <= or >=. For < and >, the boundary is excluded and the endpoint is open.
Infinity is not a finite number that can be included, so interval notation never uses a bracket beside infinity.
Substitute one simple number from the side you intend to shade. If it makes the inequality true, that side is correct.
All math worksheets · Free coordinate paper
Original resources · CC BY 4.0 · Free for personal and classroom use with attribution.